
|
시장보고서
상품코드
2035106
배터리 에너지 저장 시스템(BESS) 시장 : 점유율 분석, 산업 동향 및 통계 데이터, 성장 예측(2026-2031년)Battery Energy Storage System (BESS) - Market Share Analysis, Industry Trends & Statistics, Growth Forecasts (2026 - 2031) |
||||||
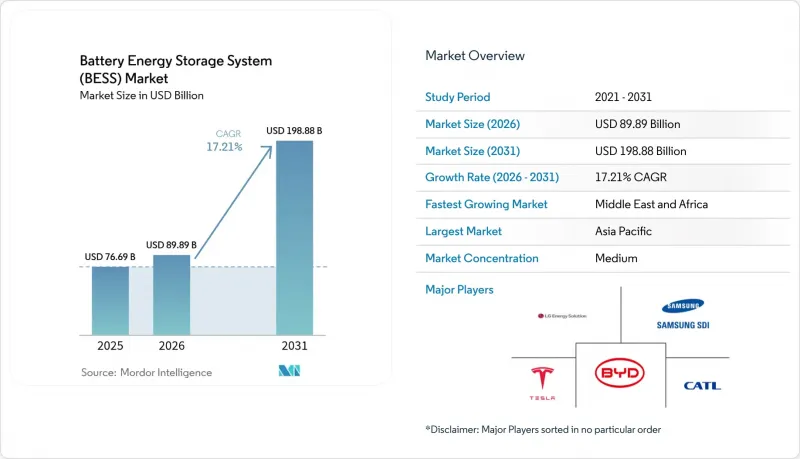
배터리 에너지 저장 시스템(BESS) 시장 규모는 2025년 766억 9,000만 달러에서 2026년에는 898억 9,000만 달러로 확대되어 2026년부터 2031년까지 CAGR 17.21%로 성장을 지속하여, 2031년에는 1,988억 8,000만 달러에 이를 것으로 예측됩니다.

리튬 이온 배터리의 급속한 비용 하락, 조달 의무화 추진, 전력망 현대화에 대한 지출 증가로 인해 대규모 전력 저장 시스템은 틈새 신뢰성 확보 수단에서 주류 인프라로 변모하고 있습니다. 미국의 '인플레이션 억제법'과 유럽연합(EU)의 '넷 제로 산업법'과 같은 정책적 지원으로 수 기가 와트 규모의 프로젝트 파이프라인이 구축된 반면, 그리드 포밍 인버터의 요구사항으로 인해 수익원은 에너지 차익거래의 틀을 넘어 확장되고 있습니다. 동시에 호주와 칠레의 태양광 발전 + 축전 전력 구매 계약(PPA)의 가격 동등성은 4시간 동안 축전 가능한 배터리가 경쟁력 있는 가격으로 저녁 피크 시간대에 안정적인 공급을 제공할 수 있다는 것을 증명하고 있습니다. 데이터센터의 전력 수요 증가와 정치적 요인으로 인한 공급망의 국내 회귀도 이 부문의 모멘텀을 더욱 촉진하고 있습니다.
세계 배터리 에너지 저장 시스템(BESS) 시장 동향과 인사이트
미국, 중국, 유럽 연합의 유틸리티 규모 조달 의무
조달 의무화는 개발의 양상을 완전히 바꾸고 있습니다. 캘리포니아주 장시간 축전 시스템 입찰은 2GW를 목표로 하고, 중국전력(Power China)의 입찰은 16GWh를 요구했으며, 한국은 540MW/3,240MWh를 낙찰받았습니다. 이를 통해 개발사는 수익성과 자금 조달 가능성에 대한 명확한 전망을 얻게 되었습니다. 유럽에서는 '넷 제로 산업법'이 국내 조달을 장려하고 있으며, 중국에서는 최근 개혁으로 엄격한 할당 규칙이 폐지되고 시장 펀더멘털이 경제성을 좌우하게 되었습니다. 이러한 프로그램은 자금 조달 비용을 절감하고, 계통 서비스 성능 보증을 충족하는 적격 통합업체로 프로젝트를 유도합니다.
그리드 포밍용 인버터의 도입으로 공동 배치의 가치 실현
그리드 추종에서 그리드 포밍 아키텍처로의 전환은 축전지가 합성 관성 및 전압 지원을 제공할 수 있도록 합니다. 이는 기존에는 계통운영자가 동기발전에서 조달하던 서비스입니다. Transgrid의 조사에 따르면 4.8GW의 그리드 형성 수요와 Fluence의 300MW 규모의 호주 프로젝트는 그 상업적 타당성을 강조하고 있습니다. 유럽 송전사업자인 TenneT는 2030년까지 5.2-12.7GW의 저장 용량을 예상하고 있어 그 폭넓은 적용 가능성을 뒷받침하고 있습니다. 관성력 관련 제품을 통한 추가 수익과 계통연계 조건 강화로 프로젝트의 경제성이 향상되고, 태양광 발전과 축전을 결합한 하이브리드 개발이 촉진됩니다.
리튬 및 흑연 가공의 병목현상
중국은 전 세계 흑연의 90%를 가공하고 있으며, 인도네시아의 니켈 수출 금지 조치로 인해 국내 정제가 진행되어 집중 리스크가 발생하고 있습니다. 수 기가 와트 규모의 입찰이 급증하는 가운데, 재료 부족이 배터리 생산을 위협하고 있습니다. Group14와 같은 스타트업 기업들은 실리콘이 풍부한 음극재를 시험 가동하고 있지만, 상업적 규모로 생산하기 위해서는 아직 몇 년이 더 필요합니다. 재활용 프로그램은 1차 수요를 완화할 수 있지만, 물류 문제로 인해 고순도 원료를 필요로 하는 유틸리티 규모의 프로젝트에 미치는 즉각적인 영향은 제한적입니다.
부문 분석
2025년 리튬 이온 배터리는 배터리식 에너지 저장 시스템 시장에서 88.05%의 점유율을 유지했습니다. 그러나 LFP(리튬인산철리튬)의 비용 및 열 안정성 우위가 CAGR 18.62%를 견인하고 있으며, BYD의 2024년 40GWh 도입 실적이 그 좋은 예입니다. NMC 계열 배터리는 에너지 밀도가 중요한 분야에서 여전히 중요하지만, 바나듐 플로우 배터리와 나트륨 이온 배터리 기술은 장시간 작동 및 고주기 사용에서 틈새 시장으로 주목받고 있습니다. 리튬 이온 배터리 변종에 의한 배터리 에너지 저장 시스템(BESS) 시장 규모는 규모 확대에 따른 kWh당 비용 하락으로 확대될 것으로 예측됩니다. 화학적 구성의 다양화는 공급망 리스크를 줄이고, 자산별 헤지 구조를 통한 프로젝트 파이낸싱의 가능성을 넓혀줍니다.
도입 전략은 지역에 따라 다릅니다. 중국 기업은 초저가 LFP 랙형 배터리를 제공하고, 유럽 전력회사는 추운 날씨에 대한 내성을 검증하기 위해 나트륨 이온 배터리를 시험적으로 도입하고, 미국 전력망 운영자는 8시간 서비스를 위해 아연-브롬 플로우 배터리를 시험 운용하고 있습니다. 이러한 병행 노력은 화학 성분의 선택이 '만능' 패러다임이 아닌 가동 주기에 따라 최적화되는 경향이 강해지고 있음을 보여줍니다.
2025년 도입 실적에서 계통연계형 시스템이 77.35%를 차지했습니다. 이는 표준화된 계통연계 표준과 탄탄한 전력 판매 수익 기회가 뒷받침하고 있습니다. 한편, 오프 그리드 부문은 농촌의 전기화 및 산업의 탄력성 요구 사항으로 인해 CAGR 18.04%로 빠르게 성장하고 있습니다. 파키스탄의 2030년까지 8.75GWh의 수입 전망은 취약한 국가 인프라를 우회하는 마이크로그리드에 대한 신흥 시장 수요를 상징합니다.
계통 연계 모드와 고립 모드를 전환하는 하이브리드 구성은 수요 요금 절감과 함께 백업 전원을 제공하는 신흥 하위 부문으로 부상하고 있는 분야입니다. 이러한 유연성 자산은 가상발전소(VPP)의 집적을 통해 도매시장에 참여하고 있으며, 이러한 추세는 현재 미국의 여러 독립계통운영사업자(ISO)의 요금 개정에서 규정되어 있습니다.
'배터리 에너지 저장 시스템(BESS) 시장 보고서'는 배터리 유형(리튬이온, 리튬인산철, 기타), 연결 방식(계통연계, Off-grid), 구성요소(배터리 팩/랙, 전력변환시스템, 기타), 에너지 용량(100MWh 미만, 기타), 최종사용처(유틸리티, 가정용, 기타), 지역(북미, 유럽, 아시아태평양, 중동, 아프리카, 유럽, 아시아태평양) 등으로 분류하여 분석하였습니다. 기타), 최종 사용자용도(유틸리티, 가정용, 기타), 지역(북미, 유럽, 아시아태평양, 기타)으로 분류됩니다.
지역별 분석
아시아태평양은 2025년 49.85%의 점유율을 유지했습니다. 이는 연간 두 배로 증가한 중국의 7,000만kW 도입 실적에 힘입은 것입니다. 인도는 SECI의 1GW/2GWh 입찰로 전환점을 맞이했으며, 일본의 1.67GW 용량 시장에서의 낙찰은 용량 확보에 있어 축전지의 역할을 뒷받침하고 있습니다. 한국은 540MW 입찰을 진행했고, LG에너지솔루션은 유럽과 일본에 수 GWh 규모의 시스템을 수출하며 이 지역의 높은 제조역량을 입증했습니다.
중동 및 아프리카는 CAGR 19.07%로 가장 빠르게 성장하는 지역입니다. 사우디아라비아의 7.8GW 규모의 Sungrow와의 파트너십과 아프리카개발은행(AfDB)이 자금을 지원한 200MWh 규모의 이집트 프로젝트가 대표적인 사례입니다. 남아공의 1GW 규모의 주문은 축전지가 만성적인 전력망 불안정성에 어떻게 대처하고 있는지를 잘 보여주고 있습니다. 또한, 아랍에미리트(UAE)는 5.2GW의 태양광 발전소와 19GWh의 전력 저장 시스템을 통합하여 사막 기후에서 기저부하 재생에너지의 선구자 역할을 하고 있습니다.
북미와 유럽은 배터리 에너지 저장 시스템 시장에서 여전히 높은 절대적인 도입량을 기록하고 있습니다. 미국에서는 1,000억 달러의 투자가 발표되었지만, 2,600GW에 달하는 프로젝트에서 계통연계 대기 기간이 4년이나 되는 상황입니다. 유럽의 '넷 제로 산업법'은 공급망의 지산지소(地産地消)를 목표로 하고 있지만, 이미 발표된 기가팩토리의 절반 이상이 자금 조달 지연에 직면해 있습니다. 영국의 용량 시장, 이탈리아의 차량 도입 의무, 캐나다의 생산 크레딧 등 지역별 정책의 다양성으로 인해 수익 모델의 모자이크가 형성되고 있으며, 숙련된 개발업체들은 이를 차익거래로 활용하고 있습니다.
기타 특전:
- 엑셀 형식 시장 예측(ME) 시트
- 3개월간 애널리스트 지원
자주 묻는 질문
목차
제1장 서론
제2장 분석 방법
제3장 주요 요약
제4장 시장 구도
제5장 시장 규모와 성장 예측
제6장 경쟁 구도
제7장 시장 기회와 향후 전망
JHS 26.05.20The Battery Energy Storage System market size is expected to grow from USD 76.69 billion in 2025 to USD 89.89 billion in 2026 and is forecast to reach USD 198.88 billion by 2031 at 17.21% CAGR over 2026-2031.
Rapid cost declines in lithium-ion cells, supportive procurement mandates, and rising grid-modernization spending are turning large-scale storage from a niche reliability tool into mainstream infrastructure. Policy tailwinds such as the Inflation Reduction Act in the United States and the Net-Zero Industry Act in the European Union have anchored multi-gigawatt project pipelines, while grid-forming inverter requirements are expanding revenue streams beyond energy arbitrage. Simultaneously, price parity for solar-plus-storage power purchase agreements (PPAs) in Australia and Chile proves that four-hour batteries can offer firm, evening-peak supply at competitive rates. Growing data-center electricity demand and politically driven supply-chain reshoring further reinforce the sector's momentum.
Global Battery Energy Storage System (BESS) Market Trends and Insights
Utility-scale procurement mandates in the United States, China, and the European Union
Mandated procurements are reshaping the development landscape. California's long-duration solicitation targets 2 GW, Power China tender seeks 16 GWh, and South Korea awarded 540 MW/3,240 MWh, giving developers visibility on revenue and bankability. In Europe, the Net-Zero Industry Act incentivizes domestic content, while recent Chinese reforms removed rigid allocation rules, letting market fundamentals guide economics. Such programs lower financing costs and channel volume to qualified integrators who meet grid-service performance guarantees.
Grid-forming inverter adoption unlocking co-location value
Moving from grid-following to grid-forming architectures lets batteries deliver synthetic inertia and voltage support, services that grid operators historically procured from synchronous generation. Transgrid's study showing 4.8 GW of grid-forming needs and Fluence's 300 MW Australian project highlight commercial viability. European operator TenneT foresees 5.2-12.7 GW storage by 2030, underscoring broad applicability. Added revenue from inertia products and strengthened interconnection terms improve project economics and favor hybrid solar-storage development.
Lithium and graphite processing bottlenecks
China processes 90% of global graphite, and Indonesia's nickel export bans push domestic refining, introducing concentration risk. Material shortages threaten cell production just as multi-gigawatt auctions surge. Start-ups such as Group14 are piloting silicon-rich anodes, but commercial volumes remain years away. Recycling programs can ease primary demand, yet logistic hurdles limit immediate impact for utility-scale projects that require high-purity inputs.
Other drivers and restraints analyzed in the detailed report include:
- PV-plus-storage PPA price parity in Australia and Chile
- EU and US supply-chain acts catalyzing domestic manufacturing
- Fire-safety code tightening under UL-9540A and NFPA-855
For complete list of drivers and restraints, kindly check the Table Of Contents.
Segment Analysis
Lithium-ion maintained 88.05% battery energy storage system market share in 2025. Yet LFP's cost and thermal-stability advantages drive its 18.62% CAGR, exemplified by BYD's 40 GWh 2024 installations. NMC chemistries remain relevant where energy density matters, while vanadium flow and sodium-ion technologies attract niche interest for long-duration or high-cycle use. Lithium-ion variants' battery energy storage system market size is projected to widen as scaling lowers per-kilowatt-hour costs. Diversification across chemistries reduces supply-chain risk and opens project financing to asset-specific hedging structures.
Implementation tactics vary by region. Chinese players offer ultra-low-priced LFP racks, European utilities test sodium-ion for cold-weather resilience, and U.S. grid operators pilot zinc-bromine flow batteries for eight-hour services. These parallel pathways illustrate how chemistry choice is increasingly optimized for duty cycle rather than a one-size-fits-all paradigm.
On-grid systems captured 77.35% of 2025 deployments, supported by standardized interconnection and robust merchant revenue opportunities. The off-grid segment, however, is accelerating at 18.04% CAGR owing to rural electrification and industrial resilience requirements. Pakistan's import projection of 8.75 GWh by 2030 typifies emerging-market demand for microgrids that bypass weak national infrastructure.
Hybrid configurations that switch between grid and islanded mode are a rising subset, offering customers demand-charge reduction plus backup power. These flexible assets partake in wholesale markets through virtual-power-plant aggregation, a trend now codified in several U.S. independent system operators' tariff updates.
The Battery Energy Storage System (BESS) Market Report is Segmented Into Battery Type (Lithium-Ion, Lithium Iron Phosphate, and Others), Connection Type (On-Grid and Off-Grid), Components (Battery Pack and Racks, Power Conversion System, and Others), Energy Capacity Range (Below 100 MWh, and Others), End-User Application (Utility, Residential, and Others), and Geography (North America, Europe, Asia-Pacific, and Others).
Geography Analysis
Asia-Pacific retained a 49.85% share in 2025, powered by China's 70 million kW installed base that doubled yearly. India reached an inflection point with SECI's 1 GW/2 GWh auction, and Japan's 1.67 GW capacity-market awards validated storage's role in capacity adequacy. South Korea advanced a 540 MW tender, and LG Energy Solution exported multi-GWh systems to Europe and Japan, underscoring the region's manufacturing clout.
The Middle East and Africa are the fastest-growing regions at 19.07% CAGR. Saudi Arabia's 7.8 GW partnership with Sungrow and Egypt's 200 MWh AfDB-financed project illustrate large-scale commitments. South Africa's 1 GW awards highlight how storage addresses chronic grid instability. Moreover, the United Arab Emirates integrates 19 GWh with a 5.2 GW solar plant, pioneering baseload renewables in desert climates.
North America and Europe continue to post high absolute volumes in the battery energy storage system market. The United States hosts USD 100 billion in announced investments but suffers four-year interconnection queues for 2,600 GW of projects. Europe's Net-Zero Industry Act seeks to localize supply chains, yet over half of announced gigafactories face financing delays. Regional policy diversity-capacity markets in the United Kingdom, fleet mandates in Italy, and production credits in Canada-produces a mosaic of revenue models that sophisticated developers arbitrage.
- BYD Company Limited
- Contemporary Amperex Technology Co. Ltd. (CATL)
- LG Energy Solution Ltd.
- Panasonic Holdings Corp.
- Tesla Inc.
- Samsung SDI Co. Ltd.
- Fluence Energy Inc.
- ABB Ltd.
- Siemens Energy AG
- GE Vernova
- Hitachi Energy Ltd.
- Mitsubishi Power
- Sungrow Power Supply Co.
- Eaton Corporation plc
- Toshiba Corp.
- EVE Energy Co.
- VARTA AG
- Saft SAS (TotalEnergies)
- CellCube Energy Storage Systems Inc.
- Enphase Energy Inc.
Additional Benefits:
- The market estimate (ME) sheet in Excel format
- 3 months of analyst support
TABLE OF CONTENTS
1 Introduction
- 1.1 Study Assumptions & Methodology Scope
- 1.2 Market Definition
2 Research Methodology
3 Executive Summary
4 Market Landscape
- 4.1 Market Overview
- 4.2 Recent Trends & Innovations
- 4.3 Market Drivers
- 4.3.1 Utility-Scale Procurement Mandates in U.S., China & EU Accelerating Gigawatt-Scale Orders
- 4.3.2 Grid-Forming Inverter Requirements Unlocking Co-Location Value Stacks
- 4.3.3 PV-Plus-Storage PPA Price Parity in Australia & Chile
- 4.3.4 EU & U.S. Battery Supply-Chain Acts Creating Domestic Manufacturing Pull-Through
- 4.3.5 Data-Center & AI Load Growth Driving 4-Hr Storage Demand in North America
- 4.3.6 Second-Life EV Battery Availability Reducing CapEx in Asia
- 4.4 Market Restraints
- 4.4.1 Lithium & Graphite Processing Bottlenecks in Indonesia and Africa
- 4.4.2 Fire-Safety Code Tightening (UL-9540A, NFPA-855) Inflating Balance-of-Plant Costs
- 4.4.3 Long Interconnection Queues in U.S. ISOs Delaying FTM Project Revenues
- 4.4.4 High Interest-Rate Environment Compressing Merchant Revenue Stacks
- 4.5 Supply-Chain Analysis
- 4.6 Regulatory and Policy Outlook
- 4.7 Technological Outlook
- 4.8 Porter's Five Forces
- 4.8.1 Bargaining Power of Suppliers
- 4.8.2 Bargaining Power of Buyers
- 4.8.3 Threat of New Entrants
- 4.8.4 Threat of Substitutes
- 4.8.5 Intensity of Competitive Rivalry
5 Market Size & Growth Forecasts
- 5.1 By Battery Type
- 5.1.1 Lithium-ion
- 5.1.2 Lithium Iron Phosphate (LFP)
- 5.1.3 Nickel-Manganese-Cobalt (NMC)
- 5.1.4 Lead-acid
- 5.1.5 Others [Flow Batteries (Vanadium, Zinc-Br), Sodium-based (NaS, Na-ion)]
- 5.2 By Connection Type
- 5.2.1 On-Grid (Utility Interconnected)
- 5.2.2 Off-Grid (Micro-Grid, Hybrid)
- 5.3 By Component
- 5.3.1 Battery Pack and Racks
- 5.3.2 Power Conversion System (PCS)
- 5.3.3 Energy Management Software (EMS)
- 5.3.4 Balance-of-Plant and Services
- 5.4 By Energy Capacity Range
- 5.4.1 Below 100 MWh
- 5.4.2 101 to 500 MWh
- 5.4.3 Above 500 MWh
- 5.5 By End-user Application
- 5.5.1 Residential
- 5.5.2 Commercial and Industrial
- 5.5.3 Utility
- 5.6 By Geography
- 5.6.1 North America
- 5.6.1.1 United States
- 5.6.1.2 Canada
- 5.6.1.3 Mexico
- 5.6.2 Europe
- 5.6.2.1 United Kingdom
- 5.6.2.2 Germany
- 5.6.2.3 France
- 5.6.2.4 Spain
- 5.6.2.5 Nordic Countries
- 5.6.2.6 Russia
- 5.6.2.7 Rest of Europe
- 5.6.3 Asia-Pacific
- 5.6.3.1 China
- 5.6.3.2 India
- 5.6.3.3 Japan
- 5.6.3.4 South Korea
- 5.6.3.5 Malaysia
- 5.6.3.6 Thailand
- 5.6.3.7 Indonesia
- 5.6.3.8 Vietnam
- 5.6.3.9 Australia
- 5.6.3.10 Rest of Asia-Pacific
- 5.6.4 South America
- 5.6.4.1 Brazil
- 5.6.4.2 Argentina
- 5.6.4.3 Colombia
- 5.6.4.4 Rest of South America
- 5.6.5 Middle East and Africa
- 5.6.5.1 United Arab Emirates
- 5.6.5.2 Saudi Arabia
- 5.6.5.3 South Africa
- 5.6.5.4 Egypt
- 5.6.5.5 Rest of Middle East and Africa
- 5.6.1 North America
6 Competitive Landscape
- 6.1 Market Concentration
- 6.2 Strategic Moves (M&A, Partnerships, PPAs)
- 6.3 Market Share Analysis (Market Rank/Share for key companies)
- 6.4 Company Profiles (includes Global level Overview, Market level overview, Core Segments, Financials as available, Strategic Information, Products & Services, and Recent Developments)
- 6.4.1 BYD Company Limited
- 6.4.2 Contemporary Amperex Technology Co. Ltd. (CATL)
- 6.4.3 LG Energy Solution Ltd.
- 6.4.4 Panasonic Holdings Corp.
- 6.4.5 Tesla Inc.
- 6.4.6 Samsung SDI Co. Ltd.
- 6.4.7 Fluence Energy Inc.
- 6.4.8 ABB Ltd.
- 6.4.9 Siemens Energy AG
- 6.4.10 GE Vernova
- 6.4.11 Hitachi Energy Ltd.
- 6.4.12 Mitsubishi Power
- 6.4.13 Sungrow Power Supply Co.
- 6.4.14 Eaton Corporation plc
- 6.4.15 Toshiba Corp.
- 6.4.16 EVE Energy Co.
- 6.4.17 VARTA AG
- 6.4.18 Saft SAS (TotalEnergies)
- 6.4.19 CellCube Energy Storage Systems Inc.
- 6.4.20 Enphase Energy Inc.
7 Market Opportunities & Future Outlook
- 7.1 White-space & Unmet-Need Assessment
