
|
시장보고서
상품코드
2044033
통신 엣지 인프라 : 시장 점유율 분석, 업계 동향 및 통계, 성장 예측(2026-2031년)Telecom Edge Infrastructure - Market Share Analysis, Industry Trends & Statistics, Growth Forecasts (2026 - 2031) |
||||||
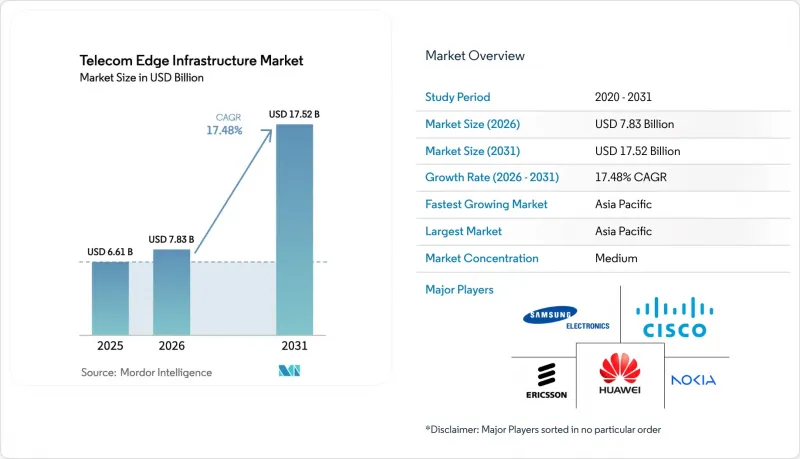
통신 엣지 인프라 시장 규모는 2025년 66억 1,000만 달러로 평가되었습니다. 2026년 78억 3,000만 달러로 확대되어 2026년부터 2031년에 걸쳐 CAGR 17.48%를 나타내, 2031년에는 175억 2,000만 달러에 이를 것으로 예측됩니다.
5G 디바이스의 트래픽 증가, 공장 자동화에 대한 더 엄격한 지연 시간 목표, 그리고 Tier 1 통신 사업자의 마이크로 엣지 노드에 대한 자본 재분배가 이러한 성장 가속화의 배경이 되고 있습니다. 하드웨어가 여전히 지출의 대부분을 차지하고 있지만, 통신사업자들이 전용 어플라이언스에서 클라우드 네이티브 워크로드로 전환함에 따라 소프트웨어 정의 네트워크 기능과 오케스트레이션 플랫폼이 새로운 가치를 창출하고 있습니다. 하이퍼스케일 클라우드 제공업체들은 셀 사이트 단위의 거리에 컴퓨팅 기능을 내장하고 있으며, 이를 통해 기업들은 10밀리초 미만의 왕복 지연 시간으로 빠르게 접속할 수 있어 기존 벤더의 우위를 잃어가고 있습니다. 기가비트 연결 및 데이터 거주성에 대한 규제 기한이 시급한 반면, 에너지 절약형 RAN 컨트롤러는 총소유비용을 개선하고 분산형 배포의 비즈니스 사례를 강화합니다.
세계의 통신 엣지 인프라 시장 동향 및 인사이트 : 5G NR 구축 가속화
독립형 5G로의 전환은 통신사들의 당초 예상보다 빠르게 진행되고 있으며, 엣지노드 구축 일정이 단축되고 있습니다. 2025년 말까지 중국에서는 독립형 방식의 보급률이 79%, 인도에서는 49.2%, 싱가포르에서는 37%를 나타냈습니다. 마케팅 주장과 핵심 네트워크 업그레이드의 괴리는 상용 5G 서비스 출시가 384건인 반면, 독립형 아키텍처로의 전환을 선언한 통신사는 전 세계적으로 192개에 불과하다는 점에서도 알 수 있습니다. 독립형 코어 네트워크는 네트워크 슬라이싱과 URLLC(초저지연, 고신뢰성) 서비스를 실현하여 분산 컴퓨팅에 대한 수요를 높입니다. 일본에서는 풀스택 가상화 네트워크에서 RAN 지능형 컨트롤러 가동 후 약 20%의 에너지 절감 효과를 얻을 수 있어 운영 비용 측면의 이점도 동시에 나타났습니다. 독립형 업그레이드를 미루는 통신사업자는 확정적인 지연을 보장할 수 있는 경쟁사에게 산업용 고객을 빼앗길 수 있는 위험을 감수해야 합니다.
초저지연 엔터프라이즈 이용 사례 급증
제조, 의료, 에너지 기업들은 현재 폐루프 제어 및 원격 제어를 위해 10밀리초 미만의 지연을 요구하고 있습니다. 2025년에 실시된 시간 민감형 네트워킹 테스트에서 5G를 통해 122나노초의 동기화를 달성하여 과거 산업용 이더넷에 의존하던 로봇 조립을 가능하게 했습니다. On-Premise 엣지 컴퓨팅과 프라이빗 5G를 활용하는 한 식품 가공 공장은 6밀리초 만에 예지보전 경보를 발령해 예기치 못한 다운타임을 줄였습니다. 원격 수술 실험에서 촉각 피드백의 지연 상한이 1-5밀리초인 것으로 확인되었습니다. 이는 수백 킬로미터 떨어진 중앙집중형 클라우드에서는 달성할 수 없는 수치입니다. 프라이빗 5G를 시범 도입한 기업의 90% 이상이 12개월 이내에 투자 회수를 달성했다고 보고했으며, 그 요인은 연결 비용 절감보다는 생산성 향상에 기인하는 것으로 나타났습니다. 따라서 통신 엣지 인프라 시장은 얼리어답터를 넘어 일반 운영기술(OT) 구매자로 확대되고 있습니다.
MEC 및 개방형 RAN 스택의 표준 단편화
병행하여 활동하는 표준화 단체들이 호환성이 거의 없는 중복된 규격을 발표하고 있습니다. 2025년 PlugFest 테스트에서 멀티 벤더 RAN 요소의 통합 실패율이 30%를 초과하는 것으로 나타났습니다. 통신사업자들은 각 공급업체의 엣지 플랫폼마다 별도의 오케스트레이션 플레인을 유지하는 경우가 많으며, 이로 인해 설비투자 비용과 엔지니어링 비용이 모두 증가하게 됩니다. 수직적 통합은 리스크를 줄일 수 있지만, 벤더 종속성에 대한 우려를 높입니다. 통일된 프레임워크의 부재는 광범위한 채택을 지연시키고 투자 의욕을 떨어뜨리고 있습니다.
부문 분석
소프트웨어 분야가 가장 빠르게 성장하여 2031년까지 20.88% 증가할 것으로 예상되며, 하드웨어는 2025년 매출의 53.41%를 차지할 것으로 예측됩니다. 가상화된 사용자 플레인 기능과 방화벽이 쿠버네티스 컨테이너로 전환되고, 통신사업자들이 벤더별 어플라이언스에서 벗어나면서 통신 엣지 인프라 시장의 소프트웨어 시장 규모는 확대될 것으로 예측됩니다. 범용 고객 가정 내 기기(CPE)와 화이트박스 서버의 보급으로 하드웨어는 상품화가 진행되어 수익률은 낮아지는 반면, 공급업체 수는 증가하고 있습니다. 여러 벤더가 제공하는 오케스트레이션 플랫폼은 복잡성을 추상화하여 서비스 도입 주기를 몇 개월에서 몇 주 단위로 단축합니다. 대부분의 통신사들은 내부적으로 클라우드 엔지니어링 기술이 부족하기 때문에 통합 및 관리형 서비스 제공은 여전히 필수적이며, 시스템 통합사업자는 지출 점유율을 확대할 수 있는 위치에 있습니다.
또 다른 추세는 칩 제조업체들이 가속기 카드를 오픈소스 프레임워크와 번들로 묶어 도입을 간소화하고 성능을 향상시키고 있다는 점입니다. 이에 따라 벤더들은 열악한 기지국 환경을 위해 설계된 견고한 엣지 서버를 시장에 출시하고 있습니다. 통신 엣지 인프라 시장은 비용에 최적화된 상용 장비와 보수적인 네트워크 사업자의 도입 위험을 줄여주는 라이프사이클 서비스 패키지로 구성된 프리미엄 통합 스택 사이에서 균형을 유지하고 있습니다.
매크로 사이트와 마이크로 사이트가 여전히 도입의 주류를 이루고 있지만, 공장, 병원, 항만의 관심 증가를 반영하여 On-Premise 기업 거점에서의 도입은 22.02% 성장할 것으로 예측됩니다. 공장 내 기계 제어 루프를 사설 네트워크가 처리하게 되면서 기업 거점 내 통신 엣지 인프라 시장 점유율이 확대될 것으로 예측됩니다. 어그리게이션 허브는 20밀리초 미만의 지연을 견딜 수 있는 워크로드의 성능 격차를 해소하고, 리노베이션된 중앙 스테이션은 비용 효율적인 지역 커버리지를 제공합니다.
산업 분야의 프라이빗 클라이언트는 확정적인 성능과 데이터 주권을 중시하고 있으며, 이에 따라 자체적으로 컴퓨팅을 호스팅하거나 전문 통합업체에 위탁하고 있습니다. 통신사들은 존재의 의미를 지키기 위해 매니지드 프라이빗 5G로 대응하고 있지만, 치열한 경쟁으로 인해 매출총이익률은 줄어들고 있습니다. 화이트박스 장비와 오픈소스 관리 스택은 진입장벽을 낮춰 플랜트 소유주들이 멀티 벤더 아키텍처를 시도할 수 있도록 돕고 있습니다.
지역별 분석
아시아태평양이 도입을 주도하고 있고, 2025년 매출의 42.52%를 차지했으며 21.61%의 연평균 복합 성장률(CAGR)을 나타낼 전망입니다. 중국, 일본, 한국의 전국적인 5G 커버리지는 고밀도 광섬유 백홀에 의해 지원되며, 스마트 제조 클러스터 내 대규모 엣지 노드를 지원합니다. 인도에서는 1급 및 2급 도시에 독립형 5G가 보급되고 있지만, 농촌 지역의 광섬유 부족으로 인해 균일한 보급에 제동이 걸리고 있습니다. 싱가포르와 태국 등 동남아시아의 스마트시티 프로그램은 공공 부문의 엣지 관련 지출을 가속화하고 있습니다.
북미는 매출의 약 4분의 1을 차지합니다. 미국 통신 사업자는 게임, 컴퓨터 비전, 소매 분석을 목표로 30개 이상의 메트로 엣지 존을 운영하고 있습니다. 캐나다는 디지털 전환에 대한 정부 인센티브를 활용하여 자동차 및 항공우주 공장에 사설 네트워크를 구축하고 있습니다. 통신사들은 하이브리드 환경 전체에서 20밀리초 미만의 지연을 보장하는 서비스 수준 계약(SLA)을 통해 차별화를 꾀하고 있습니다.
유럽도 비슷한 점유율을 기록하고 있으며, 기가비트 통신의 보급을 요구하는 '디지털 디케이드'의 요구사항이 그 원동력이 되고 있습니다. 독일, 프랑스, 스페인은 산업 및 자동차 산업 회랑에 집중하는 반면, 북유럽 국가들은 풍부한 재생에너지를 활용하여 탄소 중립적인 엣지 호스팅을 제공합니다. 표준의 분열과 주파수 대역의 복잡한 라이선싱으로 인해 통합이 지연되고 있지만, 견고한 광섬유 인프라는 장기적인 확장을 촉진하고 있습니다.
중동 및 아프리카의 경우, 진행상황에 편차가 있습니다. 걸프 국가들은 높은 가처분 소득과 정부의 경제 다변화 정책을 활용하여 스마트시티를 위한 엣지 플랫폼을 전개하고 있습니다. 한편, 사하라 이남 아프리카에는 여전히 광섬유 망의 공백이 존재하며, 통신사업자들은 엣지 구축을 위해 매크로 사이트 도입과 위성 백홀에 집중할 수밖에 없습니다. 남미에서는 브라질과 아르헨티나에서 기세가 높아지고 있습니다. 이들 국가에서는 도시 지역의 5G 커버리지와 산업계의 관심이 높아지고 있지만, 주파수 상한에 대한 규제의 불확실성으로 인해 여러 국가로의 확장이 지연되고 있습니다.
기타 혜택 :
- 엑셀 형식 시장 예측(ME) 시트
- 3개월간 애널리스트 지원
자주 묻는 질문
목차
제1장 서론
제2장 조사 방법
제3장 주요 요약
제4장 시장 구도
제5장 시장 규모와 성장 예측
제6장 경쟁 구도
제7장 시장 기회와 향후 전망
KTH 26.05.29The Telecom Edge Infrastructure Market size is expected to grow from USD 6.61 billion in 2025 to USD 7.83 billion in 2026 and is forecast to reach USD 17.52 billion by 2031 at 17.48% CAGR over 2026-2031. Rising traffic from 5G devices, tighter latency targets for factory automation, and tier-1 operator capital re-allocation toward micro-edge nodes underpin this acceleration. Hardware still dominates spending, yet software-defined network functions and orchestration platforms are capturing incremental value as carriers shift from purpose-built appliances to cloud-native workloads. Hyperscale cloud providers are embedding compute at cell-site distances, giving enterprises quick access to sub-10 millisecond round-trip latency and tilting the balance of power away from traditional equipment vendors. Regulatory deadlines for gigabit connectivity and data residency add urgency, while energy-saving RAN controllers improve total cost of ownership and reinforce the business case for distributed deployments.

Global Telecom Edge Infrastructure Market Trends and Insights 5G NR Roll-Out Acceleration
Standalone 5G migration is advancing faster than initial operator forecasts, compressing the schedule for edge node deployment. China recorded 79% standalone penetration by late 2025, while India reached 49.2% and Singapore 37%. The decoupling between marketing claims and core-network upgrades is evident in the 192 operators globally that committed to a standalone architecture, compared with 384 commercial 5G launches. Standalone cores unlock network slicing and URLLC services, sharpening demand for distributed compute. Japan's full-stack virtualized network achieved roughly 20% energy savings after the activation of the RAN Intelligent Controller, illustrating parallel opex benefits. Operators that defer standalone upgrades risk ceding industrial clients to rivals able to guarantee deterministic latency.
Surge in Ultra-Low-Latency Enterprise Use-Cases
Manufacturing, healthcare, and energy firms now require sub-10-millisecond latency for closed-loop control and teleoperation. A 2025 time-sensitive networking trial achieved 122-nanosecond synchronization over 5G, enabling robotic assembly that once relied on industrial Ethernet. Food-processing plants using private 5G with on-prem edge compute issued predictive-maintenance alerts in 6 milliseconds, cutting unplanned downtime. Remote surgery experiments established a 1-5 millisecond latency ceiling for haptic feedback, unachievable from centralized clouds hundreds of kilometers away. Above 90% of enterprises piloting private 5G reported payback within 12 months, driven more by productivity gains than by connectivity cost reductions. The telecom edge infrastructure market is therefore extending beyond early adopters into mainstream operational technology buyers.
Fragmented Standards Across MEC and Open RAN Stacks
Parallel standard bodies publish overlapping specifications that rarely interoperate cleanly. PlugFest testing in 2025 revealed integration failures topping 30% for multi-vendor RAN elements. Operators often maintain separate orchestration planes for each supplier's edge platform, inflating both capital and engineering costs. Vertical integration can reduce risk but raises fears of vendor lock-in. The absence of a unified framework delays broad adoption and cools investment appetite.
Other drivers and restraints analyzed in the detailed report include:
- Private 5G and Campus Networks Adoption
- Telco CAPEX Shift Toward Distributed Cloud Architecture
- High Upfront Site Power and Cooling Costs
For complete list of drivers and restraints, kindly check the Table Of Contents.
Segment Analysis
Software captured the fastest growth, rising 20.88% through 2031, while hardware retained 53.41% of 2025 revenue. The telecom edge infrastructure market size for software is projected to expand as virtualized user-plane functions and firewalls migrate to Kubernetes containers, freeing operators from proprietary appliances. Universal customer-premises equipment and white-box servers commoditize hardware, lowering margins yet enlarging the pool of suppliers. Orchestration platforms from multiple vendors abstract complexity, cutting service introduction cycles from months to weeks. Integration and managed-service offers remain vital because most carriers lack in-house cloud engineering skills, positioning system integrators to capture a rising share of spending.
A secondary trend sees chip manufacturers bundling accelerator cards with open-source frameworks, simplifying deployment and boosting performance. Hardware vendors respond by shipping ruggedized edge servers built for harsh cell-site environments. The telecom edge infrastructure market continues to balance between cost-optimizing commodity gear and premium, integrated stacks packaged with lifecycle services that de-risk adoption for conservative network operators.
Macro and micro sites still lead deployments, yet on-premises enterprise locations are forecast to grow at 22.02%, reflecting surging interest from factories, hospitals, and ports. The telecom edge infrastructure market share for enterprise sites is set to grow as private networks handle machine control loops on plant floors. Aggregation hubs fill a performance gap for workloads tolerant of sub-20 millisecond latency, while refurbished central offices drive cost-efficient regional coverage.
Private industrial clients prize deterministic performance and data sovereignty, pushing them to self-host compute or contract specialized integrators. Telecom operators counter with managed private 5G to defend relevance, but intense price competition shrinks gross margins. White-box gear and open-source management stacks lower entry barriers, encouraging plant owners to experiment with multi-vendor architectures.
The Telecom Edge Infrastructure Market Report is Segmented by Component (Hardware, Software, and Services), Edge Location (Macro/Micro Cell Sites, Aggregation Hubs, and More), Deployment Model (On-Premise, Telco/Private Cloud, and Hybrid), Application (Enhanced Mobile Broadband (eMBB), and More), End-User Industry (Telecom Operators, Manufacturing, and More), and Geography. The Market Forecasts are Provided in Terms of Value (USD).
Geography Analysis
Asia-Pacific leads adoption, accounting for 42.52% of 2025 revenue and a forecast CAGR of 21.61%. Nationwide 5G coverage in China, Japan, and South Korea, underpinned by dense fiber backhaul, supports large-scale edge nodes inside smart-manufacturing clusters. India rolls out standalone 5G across tier-1 and tier-2 cities, though rural fiber scarcity tempers uniform distribution. Southeast Asian smart-city programs in Singapore and Thailand accelerate public-sector edge spending.
North America contributes roughly one-quarter of revenue. U.S. operators deploy thirty-plus metro edge zones to target gaming, computer vision, and retail analytics. Canada builds private networks in automotive and aerospace plants, leveraging government incentives for digital transformation. Operators differentiate through service-level agreements that guarantee sub-20 millisecond latency across hybrid footprints.
Europe records a similar aggregate share, spurred by the Digital Decade requirement for gigabit coverage. Germany, France, and Spain focus on industrial and automotive corridors, while the Nordics exploit abundant renewable energy to offer carbon-neutral edge hosting. Standards fragmentation and spectrum licensing complexities introduce integration delays, yet robust fiber infrastructure smooths long-run scaling.
The Middle East and Africa see uneven progress. Gulf states leverage high disposable income and government diversification agendas to deploy smart-city edge platforms. Sub-Saharan Africa endures fiber gaps, forcing operators to concentrate on macro-site deployments and satellite backhaul for edge outreach. South America gains momentum in Brazil and Argentina, where urban 5G coverage and industrial interest coincide, though regulatory uncertainty around spectrum caps slows multi-country expansion.
List of Companies Covered in this Report:
- Telefonaktiebolaget LM Ericsson
- Nokia Corporation
- Huawei Technologies Co., Ltd.
- Cisco Systems, Inc.
- Samsung Electronics Co., Ltd.
- ZTE Corporation
- NEC Corporation
- Dell Technologies Inc.
- Hewlett Packard Enterprise Company
- Intel Corporation
- Juniper Networks, Inc.
- VMware, Inc. ( Broadcom)
- Red Hat, Inc. (International Business Machines Corporation)
- Amazon Web Services, Inc.
- Microsoft Corporation
- Google LLC
- Mavenir Systems, Inc.
- Parallel Wireless, Inc.
- Rakuten Symphony, Inc. (Rakuten Group, Inc.)
- Affirmed Networks, Inc. (Microsoft Corporation)
Additional Benefits:
- The market estimate (ME) sheet in Excel format
- 3 months of analyst support
TABLE OF CONTENTS
1 INTRODUCTION
- 1.1 Study Assumptions and Market Definition
- 1.2 Scope of the Study
2 RESEARCH METHODOLOGY
3 EXECUTIVE SUMMARY
4 MARKET LANDSCAPE
- 4.1 Market Overview
- 4.2 Market Drivers
- 4.2.1 5G NR Roll-Out Acceleration
- 4.2.2 Surge in Ultra-Low-Latency Enterprise Use-Cases
- 4.2.3 Private 5G and Campus Networks Adoption
- 4.2.4 Telco CAPEX Shift Toward Distributed Cloud Architecture
- 4.2.5 RAN Intelligent Controller (RIC) Enabling Agile Edge Apps
- 4.2.6 Micro-Edge Sustainability Incentives (Renewable Power)
- 4.3 Market Restraints
- 4.3.1 Fragmented Standards Across MEC and Open RAN Stacks
- 4.3.2 High Upfront Site Power and Cooling Costs
- 4.3.3 Limited Edge-To-Core Orchestration Skill-Set Among CSPs
- 4.3.4 Fiber Backhaul Bottlenecks in Emerging Economies
- 4.4 Industry Value Chain Analysis
- 4.5 Regulatory Landscape
- 4.6 Technological Outlook
- 4.7 Porter's Five Forces Analysis
- 4.7.1 Threat of New Entrants
- 4.7.2 Bargaining Power of Suppliers
- 4.7.3 Bargaining Power of Buyers
- 4.7.4 Threat of Substitutes
- 4.7.5 Competitive Rivalry
5 MARKET SIZE AND GROWTH FORECASTS (VALUE)
- 5.1 By Component
- 5.1.1 Hardware
- 5.1.1.1 Edge Servers
- 5.1.1.2 uCPE / White-box
- 5.1.1.3 RAN Distributed Units (DU)
- 5.1.2 Software
- 5.1.2.1 Virtualized Network Functions
- 5.1.2.2 Edge Orchestration Platforms
- 5.1.3 Services
- 5.1.1 Hardware
- 5.2 By Edge Location
- 5.2.1 Macro / Micro Cell Sites
- 5.2.2 Aggregation Hubs
- 5.2.3 Central Offices
- 5.2.4 Regional Data Centers
- 5.2.5 Enterprise On-prem Edge
- 5.3 By Deployment Model
- 5.3.1 On-premises
- 5.3.2 Telco / Private Cloud
- 5.3.3 Hybrid
- 5.4 By Application
- 5.4.1 Enhanced Mobile Broadband (eMBB)
- 5.4.2 Massive IoT (mMTC)
- 5.4.3 Mission-critical / URLLC
- 5.5 By End-user Industry
- 5.5.1 Telecom Operators
- 5.5.2 Manufacturing
- 5.5.3 Healthcare
- 5.5.4 Media and Entertainment
- 5.5.5 Transportation and Logistics
- 5.5.6 Other end-user Industries
- 5.6 By Geography
- 5.6.1 North America
- 5.6.1.1 United States
- 5.6.1.2 Canada
- 5.6.1.3 Mexico
- 5.6.2 South America
- 5.6.2.1 Brazil
- 5.6.2.2 Argentina
- 5.6.2.3 Rest of South America
- 5.6.3 Europe
- 5.6.3.1 Germany
- 5.6.3.2 United Kingdom
- 5.6.3.3 France
- 5.6.3.4 Russia
- 5.6.3.5 Rest of Europe
- 5.6.4 Asia-Pacific
- 5.6.4.1 China
- 5.6.4.2 Japan
- 5.6.4.3 India
- 5.6.4.4 South Korea
- 5.6.4.5 Rest of Asia-Pacific
- 5.6.5 Middle East and Africa
- 5.6.5.1 Middle East
- 5.6.5.1.1 Saudi Arabia
- 5.6.5.1.2 United Arab Emirates
- 5.6.5.1.3 Rest of the Middle East
- 5.6.5.2 Africa
- 5.6.5.2.1 South Africa
- 5.6.5.2.2 Nigeria
- 5.6.5.2.3 Rest of Africa
- 5.6.5.1 Middle East
- 5.6.1 North America
6 COMPETITIVE LANDSCAPE
- 6.1 Market Concentration
- 6.2 Strategic Moves
- 6.3 Market Share Analysis
- 6.4 Company Profiles (includes Global level Overview, Market level overview, Core Segments, Financials as available, Strategic Information, Market Rank/Share for key companies, Products and Services, and Recent Developments)
- 6.4.1 Telefonaktiebolaget LM Ericsson
- 6.4.2 Nokia Corporation
- 6.4.3 Huawei Technologies Co., Ltd.
- 6.4.4 Cisco Systems, Inc.
- 6.4.5 Samsung Electronics Co., Ltd.
- 6.4.6 ZTE Corporation
- 6.4.7 NEC Corporation
- 6.4.8 Dell Technologies Inc.
- 6.4.9 Hewlett Packard Enterprise Company
- 6.4.10 Intel Corporation
- 6.4.11 Juniper Networks, Inc.
- 6.4.12 VMware, Inc. ( Broadcom)
- 6.4.13 Red Hat, Inc. (International Business Machines Corporation)
- 6.4.14 Amazon Web Services, Inc.
- 6.4.15 Microsoft Corporation
- 6.4.16 Google LLC
- 6.4.17 Mavenir Systems, Inc.
- 6.4.18 Parallel Wireless, Inc.
- 6.4.19 Rakuten Symphony, Inc. (Rakuten Group, Inc.)
- 6.4.20 Affirmed Networks, Inc. (Microsoft Corporation)
7 MARKET OPPORTUNITIES AND FUTURE OUTLOOK
- 7.1 White-space and Unmet-need Assessment
(주말 및 공휴일 제외)
