
|
시장보고서
상품코드
2062313
소셜 TV 시장 : 시장 점유율 분석, 업계 동향 및 통계, 성장 예측(2026-2031년)Social TV - Market Share Analysis, Industry Trends & Statistics, Growth Forecasts (2026 - 2031) |
||||||
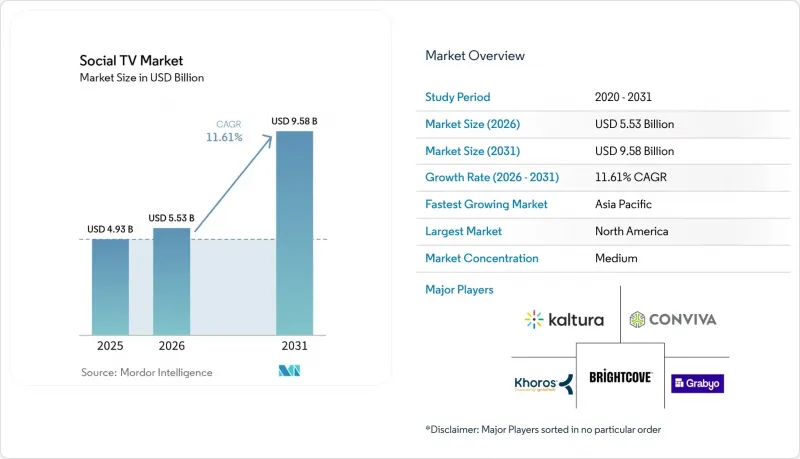
Mordor Intelligence에 의하면, 소셜 TV 시장 규모는 2025년에 49억 3,000만 달러로 평가되었고, 2026년 55억 3,000만 달러로 추정되고, 2031년까지 95억 8,000만 달러에 이를 것으로 예측되며, 예측 기간(2026-2031년) CAGR은 11.61%를 나타낼 전망입니다.

본 보고서는 구성 요소별(소프트웨어 플랫폼, 소셜 TV 분석 도구 등), 용도별(타겟팅 광고 및 스폰서십 등), 기기 및 플랫폼별(웹 브라우저 인터페이스, 게임기 등), 도입 모델별(클라우드, 온프레미스 및 엣지), 최종 사용자별(광고주 및 브랜드, 컨텐츠 제작 스튜디오 등), 그리고 지역별로 분류되어 있습니다. 시장 전망은 금액(달러) 기준으로 제시되어 있습니다.
세계의 소셜 TV 시장 동향 및 인사이트
AI를 활용한 맞춤형 컨텐츠 추천
추천 엔진은 정기적인 업데이트에서 제안 내용을 실시간으로 업데이트하는 지속적인 행동 모델링으로 전환되고 있으며, 컨텐츠 발견을 의도 주도형 서비스로 변화시키고 있습니다. Roku Channel에서 크리에이터 주도의 프로그램에 대한 스트리밍 시간은 2025년에 전년 대비 약 80% 증가할 것으로 예상되며, 이는 진정한 이야기를 찾는 소비자들 수요를 반영하고 있습니다. 디즈니가 200여 개의 상징적인 캐릭터에 OpenAI의 Sora를 도입하는 계약을 체결한 것은 생성형 AI가 제작 비용을 절감하면서도 대규모 자산의 현지화를 가능하게 한다는 점을 보여줍니다. 그러나 시청자의 58%가 실제 컨텐츠와 합성 컨텐츠를 구분하지 못한다고 보고했으며, 이로 인해 광고주의 36%가 소셜 미디어에서 더 안전하다고 여겨지는 CTV 환경으로 광고 예산을 전환하려고 하고 있습니다. 따라서 AI를 활용한 개인화와 퍼스트파티 데이터를 결합한 플랫폼은 사용자의 충성도와 광고주의 신뢰 모두를 유지할 수 있는 입장에 있습니다.
CTV 프로그램 매틱 광고비의 급증
공급 측 통합을 통해 구매자는 단일 인서트 오더로 분산된 전체 인벤토리에 캠페인을 전개할 수 있게 되었으며, 2026년에는 전체 CTV 거래의 50%가 프로그래매틱 방식으로 이루어질 것으로 예측됩니다. Brightcove와 Magnite의 제휴는 풍부한 메타데이터가 어떻게 필레이트를 향상시키고 미판매 슬롯을 해소하는지 보여주고 있습니다. 동남아시아에서는 2025년 1분기에 오픈형 프로그램매틱 CTV 광고비가 전년 동기 대비 43% 증가했습니다. 이는 마케터의 57%가 예산의 최소 40%를 커넥티드 스크린으로 재분배했기 때문입니다. 성장이 눈에 띄는 반면, 증가한 자금의 4분의 1은 소셜 미디어나 검색 광고를 통해 유입되고 있어, 방송급 품질의 영상 자료를 보유하지 않은 중소 브랜드의 경우 크리에이티브 자산 부족이라는 과제가 대두되고 있습니다.
점점 더 엄격해지는 개인정보 보호 및 데이터 이용 규제
GDPR(EU 개인정보보호규정), 캘리포니아주 소비자 개인정보 보호법 및 새로운 주 차원의 법규로 인해, 플랫폼은 동의를 얻은 데이터나 문맥적 단서에 의존할 수밖에 없게 되었으며, 규정 준수 부담은 커지는 반면 행동 데이터의 양은 줄어들고 있습니다. 전 세계 각국의 서로 다른 규제가 업무 흐름을 더욱 복잡하게 만들고 있습니다. 한국에서는 엄격한 옵트인 정책이 시행되고 있는 반면, 동남아시아에서는 보다 완화된 규제가 적용되고 있기 때문입니다. CTV로 광고 예산을 전환하는 광고주들은 의사결정 기준으로 투명성과 브랜드 안전성을 점점 더 중요하게 여기고 있습니다. 따라서 ISO 27001이나 이와 유사한 프레임워크에 기반한 인증을 취득한 제공업체가 유리한 입장에 있습니다.
부문별 분석
소프트웨어 플랫폼은 2025년 매출의 44.19%를 차지한 것으로 평가되었으며, 그 핵심은 컨텐츠 관리 제품군, 추천 엔진, 그리고 방송사가 기존 워크플로우를 변경하지 않고도 투표 및 라이브 채팅 기능을 추가할 수 있게 해주는 인터랙티브 오버레이 빌더입니다. 닐슨의 기존 제품을 통합한 ‘Talkwalker Social Content Ratings’는 172개 방송망 및 스트리밍 서비스에 걸친 대화를 추적하여, 프로그램 제작자가 스폰서에게 확산 효과를 입증할 수 있는 수단을 제공합니다. 현재 소셜 TV 시장의 분석 도구 점유율은 여전히 낮은 수준이지만, 저작권 보유자들이 팬들의 실시간 대화 데이터를 판매 가능한 광고 공간으로 전환함에 따라 이 부문은 연평균 성장률(CAGR) 12.43%를 나타낼 것으로 전망됩니다. 각 플랫폼은 자연어 처리와 컴퓨터 비전을 융합하여, 실시간 감정 분석 결과가 1초도 채 되지 않는 시간 내에 미드롤 광고의 가격 책정에 영향을 미치도록 하고 있습니다. 또한, 각 벤더사는 경쟁사 벤치마킹이 가능한 계층형 대시보드를 함께 제공하고 있으며, 이 기능을 통해 자원 부족으로 어려움을 겪는 지방 방송국의 보고서 작성 부담을 덜어주고 있습니다.
주요 클라우드 공급업체들은 분석 모듈을 핵심 플레이아웃 서비스의 부가 기능으로 자리매김함으로써, 포인트 솔루션의 필요성을 줄이고 있습니다. 2026년 3월에 출시된 Amagi NOW의 ‘AI Artwork Engine’은 CTV, 모바일, 소셜 미디어용 썸네일을 자동으로 생성함으로써, 자산 제작 리드타임을 며칠에서 몇 분으로 단축하고, 과거 멀티채널 배포를 지연시켰던 병목 현상을 해소했습니다. YES Network의 ‘Gotham Sports’ 앱 등 초기 도입 사례에 따르면, 야구 생중계에 흥미진진한 퀴즈를 접목한 결과, 경기당 평균 고유 스트림 수가 38% 증가한 것으로 보고되었습니다. 광고주는 세컨드 스크린을 통한 화제성을 바탕으로 검증된 광고 슬롯에 대해 추가 요금을 지불하기 때문에 분석 도구는 소셜 TV 시장의 경제 구조에서 핵심적인 역할을 점차 차지하고 있습니다.
시청자 참여도와 커뮤니티 구축은 2025년 지출의 35.43%를 차지했으며, 이를 이끈 원동력으로는 시청 파티, 퀴즈 오버레이, 연속 시청에 대한 보상으로 제공되는 팬덤 배지 등이 있습니다. 그러나 커머스 및 쇼핑 기능이 탑재된 TV 애플리케이션 시장은 현재 연평균 성장률(CAGR) 12.78%로 성장하고 있으며, 이는 부문별 성장률 중 가장 높은 수치입니다. 월마트와 VIZIO OS의 통합을 통해 매주 1억 5,000만 명의 쇼핑객이 거실의 화면을 통해 상품을 발견하고 원클릭 결제를 진행할 수 있게 되었습니다. Shopify와 연동된 Roku Action Ads는 LolaVie의 매출을 40% 증가시켰으며, TV 광고가 과거 소셜 피드 광고에 국한되었던 장바구니 전환율에 필적할 수 있음을 입증했습니다. 커뮤니티 기능과 연계된 소셜 TV 시장 규모는 여전히 중요한데, 이는 상호작용형 채팅이 평균 시청 시간을 늘리고, 간접적으로 광고 노출 횟수를 증가시키기 때문입니다.
그러나 수익 창출의 효율성은 영감에서 구매에 이르는 퍼널을 단축하는 상거래 경험에 치우쳐 있습니다. NBC 유니버설의 데이터에 따르면, 2023년 3분기부터 2024년 4분기에 걸쳐 전체 프로그램 포트폴리오에서 ‘구매 가능한 활성화’가 참여도를 378% 향상시켰습니다. 이는 소매 전략이 컨텐츠의 유지율을 떨어뜨리는 것이 아니라 오히려 높이는 것을 입증하고 있습니다. 벨 미디어의 ‘Shopsense AI’는 요리 및 스포츠 프로그램을 중심으로 엄선된 스토어프론트를 생성하고 있으며, 시청자의 62.7%가 적어도 한 가지 신상품을 발견하고 있습니다. 이는 맥락에 맞춘 상품 진열이 공감을 불러일으키고 있다는 증거입니다. TV 운영체제 내에서 결제 정보 등록이 보편화됨에 따라, 2031년까지 상거래 분야가 소셜 TV 시장에서 가장 큰 절대 금액을 창출할 것으로 예측됩니다.
지역별 분석
북미는 높은 ARPU와 성숙한 프로그래매틱 광고 인프라에 힘입어 2025년 매출의 34.89%를 차지했습니다. 커넥티드 TV 광고비는 2026년에 약 380억 달러에 달하고, 전년 대비 13.8% 증가할 것으로 예상되며, 광고주의 70%가 예산을 평균 17% 증액하고 있습니다. 월마트의 VIZIO OS 싱글 사인온(SSO) 등 커머스 연동 기능은 이미 스트리밍 노출과 오프라인 매장 매출을 연계하고 있으며, 카페 부스테로와 같은 브랜드의 추가 도달률을 98%까지 끌어올리고 있습니다. 5G의 보급에 따라 대규모 스포츠 중계에서 세컨드 스크린의 확장 기능 동기화가 확대되고 있습니다.
유럽에서도 유사한 인프라가 구축되어 있지만, 보다 엄격한 개인정보 보호 규제 프레임워크 안에서 운영되고 있습니다. 행동 타겟팅을 제한하는 GDPR(EU 개인정보보호규정) 조항으로 인해 플랫폼들은 컨텍스트 엔진에 대한 투자를 강요받고 있으며, 이는 비용 증가를 초래하는 한편 품질 측면에서의 경쟁 우위도 창출하고 있습니다. 업계 합동위원회의 기준 제정이 지연되고 있어, 구매 담당자들은 여러 측정 기준을 병행하여 사용할 수밖에 없으며, 이것이 지역 전체의 지출 확대를 저해하는 과제로 대두되고 있습니다. 동남아시아 시청자들은 자국의 이야기를 선호하기 때문에 이 지역의 OTT 서비스들은 문화적으로 관련성이 높은 IP를 중심으로 소셜 기능을 도입하고 있습니다.
2031년까지 연평균 성장률(CAGR) 12.49%를 나타낼 것으로 예측되는 아시아태평양에서는 중국을 제외한 지역에서 인도와 일본을 필두로 커넥티드 TV 가구가 1억 가구 가까이 증가할 전망입니다. 2025년 1분기, 동남아시아의 오픈 프로그래매틱 광고비는 전년 동기 대비 43% 증가했으며, 이는 수요 측 플랫폼(DSP)이 시장의 분열로 인한 격차를 메우고 있음을 보여줍니다. 남미, 중동 및 아프리카에서는 ARPU가 낮은 문제로 어려움을 겪고 있으며, 일시적인 대책으로 통신 사업자와의 번들형 마이크로 구독 서비스를 추진하고 있습니다. 그럼에도 불구하고, 주요 축구 및 크리켓 경기는 엔터테인먼트 기준치의 2배에서 5배에 달하는 CPM을 창출하고 있으며, 고부가가치 라이브 방송 시간대가 신흥 지역의 소셜 TV 시장 동향을 계속해서 주도할 것으로 확실시되고 있습니다.
기타 혜택 :
- 엑셀 형식 시장 예측(ME) 시트
- 3개월간의 애널리스트 지원
자주 묻는 질문
목차
제1장 서론
제2장 조사 방법
제3장 주요 요약
제4장 시장 구도
제5장 시장 규모 및 성장 예측
제6장 경쟁 구도
제7장 시장 기회 및 향후 전망
AJY 26.06.26According to Mordor Intelligence, the social tV market size was valued at USD 4.93 billion in 2025 and estimated to grow from USD 5.53 billion in 2026 to reach USD 9.58 billion by 2031, at a CAGR of 11.61% during the forecast period (2026-2031).
This report is Segmented by Component (Software Platforms, Social TV Analytics Tools, and More), Application (Targeted Advertising and Sponsorship, and More), Device/Platform (Web Browser Interfaces, Gaming Consoles, and More), Deployment Model (Cloud, On-Premise/Edge), End User (Advertisers and Brands, Content Production Studios, and More), and Geography. The Market Forecasts are Provided in Terms of Value (USD).
Global Social TV Market Trends and Insights
AI-Powered Personalized Content Recommendations
Recommendation engines are shifting from scheduled updates to continuous behavioral modeling that refreshes suggestions in real time, turning discovery into an intent-driven service. Streaming hours devoted to creator-led shows on The Roku Channel climbed almost 80% year over year in 2025, reflecting consumer appetite for authentic narratives. Disney's agreement to use OpenAI's Sora for 200 iconic characters shows how generative AI can lower production costs while localizing assets at scale. Yet 58% of viewers report difficulty telling real from synthetic content, nudging 36% of advertisers to shift dollars from social media toward perceived-safer CTV environments. Platforms that couple AI personalization with first-party data are therefore positioned to sustain both user loyalty and advertiser trust.
Programmatic CTV Ad-Spend Boom
Supply-side integrations now let buyers activate campaigns across scattered inventory with a single insertion order, propelling programmatic to an expected 50% of all CTV deals in 2026. Brightcove's tie-up with Magnite demonstrates how enriched metadata boosts fill rates and clears unsold spots. In Southeast Asia, open programmatic CTV spend jumped 43% year on year in Q1 2025 as 57% of marketers reallocated at least 40% of budgets to connected screens. Despite growth, one quarter of incremental funds move from social and search, creating a creative-asset gap for smaller brands that lack broadcast-quality footage.
Tightening Privacy and Data-Usage Regulations
GDPR, the California Consumer Privacy Act, and new state-level statutes force platforms to rely on consented data and contextual cues, lifting compliance overheads while shrinking behavioral pools. Divergent global rules further complicate workflows, as South Korea enforces strict opt-in policies while Southeast Asia applies lighter-touch regimes. Advertisers shifting spend into CTV increasingly cite transparency and brand safety as decision filters, so providers that certify against ISO 27001 and similar frameworks gain an edge.
Other drivers and restraints analyzed in the detailed report include:
- 5G-Enabled Synchronous Second-Screen Experiences
- Shoppable and Social-Commerce Integrations
- Low ARPU in Emerging Markets Limits Monetization
For complete list of drivers and restraints, kindly check the Table Of Contents.
Segment Analysis
Software platforms accounted for 44.19% of 2025 revenue, anchored by content-management suites, recommendation engines, and interactive overlay builders that let broadcasters add polls and live chat without rewiring linear workflows. Talkwalker Social Content Ratings, which absorbs Nielsen's legacy product, tracks conversations across 172 networks and streaming services, giving programmers a way to prove amplification value to sponsors. The Social TV market share held by analytics tools remains modest today, yet the segment is projected to post a 12.43% CAGR as rights owners translate raw fan chatter into sellable inventory. Platforms fuse natural-language processing with computer vision so that real-time sentiment can influence midroll pricing in under a second. Vendors also bundle tiered dashboards that benchmark performance against competitive shows, a feature that reduces reporting labor for resource-starved local stations.
Leading cloud vendors position analytics modules as add-ons to core playout services, limiting the need for point solutions. Amagi NOW's AI Artwork Engine, launched in March 2026, cuts asset turnaround times from days to minutes by automatically generating thumbnails for CTV, mobile, and social, fixing a bottleneck that once slowed multichannel release. Early adopters such as YES Network's Gotham Sports app reported a 38% jump in average unique streams per game after layering sentiment-rich trivia into live baseball. Because advertisers pay premiums for inventory verified by second-screen buzz, analytics tools are becoming central to the social TV market economic stack.
Audience engagement and community-building accounted for 35.43% of 2025 spend, driven by watch parties, quiz overlays, and fandom badges that reward streak viewership. Yet commerce and shoppable TV applications are now advancing at a 12.78% CAGR, the highest in the segment hierarchy. Walmart's VIZIO OS unification lets 150 million weekly shoppers move from discovery to one-click checkout on the living-room screen. Roku Action Ads, paired with Shopify, raised LolaVie's sales by 40% and proved that television can equal cart-conversion rates once exclusive to social feeds. The social TV market size tied to community features still matters because interactive chats extend average viewing time, thereby indirectly boosting ad impressions.
Yet monetization efficiency skews toward commerce experiences that shorten the funnel from inspiration to purchase. NBC Universal data show that shoppable activations boosted engagement by 378% across the portfolio of shows between Q3 2023 and Q4 2024, confirming that retail hooks lift, rather than cannibalize, content retention. Bell Media's Shopsense AI produces curated storefronts around cooking and sports programs, with 62.7% of viewers discovering at least one new product, evidence that contextual merchandising resonates. As payment credentials proliferate within TV operating systems, the commerce segment is expected to add the largest absolute dollars to the social TV market by 2031.
Geography Analysis
North America retained 34.89% of 2025 revenue, buoyed by high ARPU and mature programmatic rails. Connected-TV ad spend is projected to hit about USD 38 billion in 2026, up 13.8% year over year, with 70% of advertisers lifting budgets by 17% on average. Commerce integrations such as Walmart's VIZIO OS single-sign-on already link streaming exposure to in-store sales, boosting incremental reach for brands like Cafe Bustelo by 98%. Widespread 5G helps synchronize second-screen augmentations across large-scale sports broadcasts.
Europe shows parallel infrastructure yet operates under stiffer privacy rules. GDPR clauses that restrict behavioral retargeting push platforms to invest in contextual engines, adding cost but also creating a quality moat. Joint Industry Committee standards move slowly, leaving buyers to juggle multiple measurement currencies, a pain point restraining spend velocity across the region. Southeast Asian audiences prefer domestic storylines, pushing regional OTTs to weave social features around culturally relevant IP.
Asia-Pacific, forecast to climb at a 12.49% CAGR to 2031, will add almost 100 million connected-TV households outside China, led by India and Japan. Open programmatic spend in Southeast Asia jumped 43% year on year in Q1 2025, signaling that demand-side platforms are closing fragmentation gaps. South America and the Middle East and Africa wrestle with low ARPU, pushing telco-bundled micro-subscriptions as stopgaps. Still, marquee football and cricket fixtures generate CPMs two to five times above entertainment baselines, ensuring that high-value live windows continue to move the social TV market needle in emerging regions.
- Brightcove Inc.
- Kaltura Inc.
- Khoros LLC
- Conviva Inc.
- Grabyo Ltd.
- Sceenic Ltd.
- LiveLike Interactive, Inc.
- Never.no AS
- Flowics Inc.
- Amobee, Inc.
- Red Bee Media Ltd.
- Viaccess-Orca SA
- Yidio LLC
- Youtoo Technologies LLC
- TiVo Corporation
- Gracenote, Inc.
- ScreenHits TV Ltd.
- Amagi Corporation
- Streann Media, Inc.
- Magnite, Inc.
Additional Benefits:
- The market estimate (ME) sheet in Excel format
- 3 months of analyst support
TABLE OF CONTENTS
1 INTRODUCTION
- 1.1 Study Assumptions and Market Definition
- 1.2 Scope of the Study
2 RESEARCH METHODOLOGY
3 EXECUTIVE SUMMARY
4 MARKET LANDSCAPE
- 4.1 Market Overview
- 4.2 Market Drivers
- 4.2.1 AI-Powered Personalised Content Recommendations
- 4.2.2 Programmatic CTV Ad-Spend Boom
- 4.2.3 5G-Enabled Synchronous Second-Screen Experiences
- 4.2.4 Shoppable and Social-Commerce Integrations
- 4.2.5 Real-Time Audience Sentiment as a Trading Currency
- 4.2.6 Strategic Alliances Between OTT Platforms and Social Networks
- 4.3 Market Restraints
- 4.3.1 Tightening Privacy / Data-Usage Regulations
- 4.3.2 Fragmented Device and OS Ecosystem
- 4.3.3 Lack of Unified Cross-Platform Measurement Standards
- 4.3.4 Low ARPU in Emerging Markets Limits Monetisation
- 4.4 Industry Value-Chain Analysis
- 4.5 Regulatory Landscape
- 4.6 Technological Outlook
- 4.7 Impact of Macroeconomic Factors on the Market
- 4.8 Porter's Five Forces Analysis
- 4.8.1 Bargaining Power of Buyers
- 4.8.2 Bargaining Power of Suppliers
- 4.8.3 Threat of New Entrants
- 4.8.4 Threat of Substitutes
- 4.8.5 Competitive Rivalry
5 MARKET SIZE AND GROWTH FORECASTS (VALUE)
- 5.1 By Component
- 5.1.1 Software Platforms
- 5.1.2 Services
- 5.1.3 Hardware / Smart-TV Solutions
- 5.1.4 Social TV Analytics Tools
- 5.2 By Application
- 5.2.1 Audience Engagement and Community Building
- 5.2.2 Targeted Advertising and Sponsorship
- 5.2.3 Content Discovery and Recommendations
- 5.2.4 Social Gaming / Interactive Programming
- 5.2.5 Commerce and Shoppable TV
- 5.3 By Device / Platform
- 5.3.1 Smart TVs and Connected-TV OS
- 5.3.2 Mobile and Tablet Second-Screen Apps
- 5.3.3 Streaming Media Players and Set-Top Boxes
- 5.3.4 Web Browser Interfaces
- 5.3.5 Gaming Consoles
- 5.4 By Deployment Model
- 5.4.1 Cloud
- 5.4.2 On-Premise / Edge
- 5.5 By End User
- 5.5.1 Broadcasters and Pay-TV Operators
- 5.5.2 OTT and Streaming Service Providers
- 5.5.3 Advertisers and Brands
- 5.5.4 Content Production Studios
- 5.5.5 Sports Leagues and Event Owners
- 5.6 By Geography
- 5.6.1 North America
- 5.6.1.1 United States
- 5.6.1.2 Canada
- 5.6.1.3 Mexico
- 5.6.2 Europe
- 5.6.2.1 Germany
- 5.6.2.2 United Kingdom
- 5.6.2.3 France
- 5.6.2.4 Russia
- 5.6.2.5 Rest of Europe
- 5.6.3 Asia-Pacific
- 5.6.3.1 China
- 5.6.3.2 Japan
- 5.6.3.3 India
- 5.6.3.4 South Korea
- 5.6.3.5 Australia
- 5.6.3.6 Rest of Asia-Pacific
- 5.6.4 Middle East and Africa
- 5.6.4.1 Middle East
- 5.6.4.1.1 Saudi Arabia
- 5.6.4.1.2 United Arab Emirates
- 5.6.4.1.3 Rest of Middle East
- 5.6.4.2 Africa
- 5.6.4.2.1 South Africa
- 5.6.4.2.2 Egypt
- 5.6.4.2.3 Rest of Africa
- 5.6.4.1 Middle East
- 5.6.5 South America
- 5.6.5.1 Brazil
- 5.6.5.2 Argentina
- 5.6.5.3 Rest of South America
- 5.6.1 North America
6 COMPETITIVE LANDSCAPE
- 6.1 Market Concentration
- 6.2 Strategic Moves
- 6.3 Market Share Analysis
- 6.4 Company Profiles (includes Global Level Overview, Market Level Overview, Core Segments, Financials as available, Strategic Information, Market Rank/Share, Products and Services, Recent Developments)
- 6.4.1 Brightcove Inc.
- 6.4.2 Kaltura Inc.
- 6.4.3 Khoros LLC
- 6.4.4 Conviva Inc.
- 6.4.5 Grabyo Ltd.
- 6.4.6 Sceenic Ltd.
- 6.4.7 LiveLike Interactive, Inc.
- 6.4.8 Never.no AS
- 6.4.9 Flowics Inc.
- 6.4.10 Amobee, Inc.
- 6.4.11 Red Bee Media Ltd.
- 6.4.12 Viaccess-Orca SA
- 6.4.13 Yidio LLC
- 6.4.14 Youtoo Technologies LLC
- 6.4.15 TiVo Corporation
- 6.4.16 Gracenote, Inc.
- 6.4.17 ScreenHits TV Ltd.
- 6.4.18 Amagi Corporation
- 6.4.19 Streann Media, Inc.
- 6.4.20 Magnite, Inc.
7 MARKET OPPORTUNITIES AND FUTURE OUTLOOK
- 7.1 White-Space and Unmet-Need Assessment
