
|
시장보고서
상품코드
2063407
자율 통신 네트워크 : 시장 점유율 분석, 업계 동향 및 통계, 성장 예측(2026-2031년)Autonomous Telecom Networks - Market Share Analysis, Industry Trends & Statistics, Growth Forecasts (2026 - 2031) |
||||||
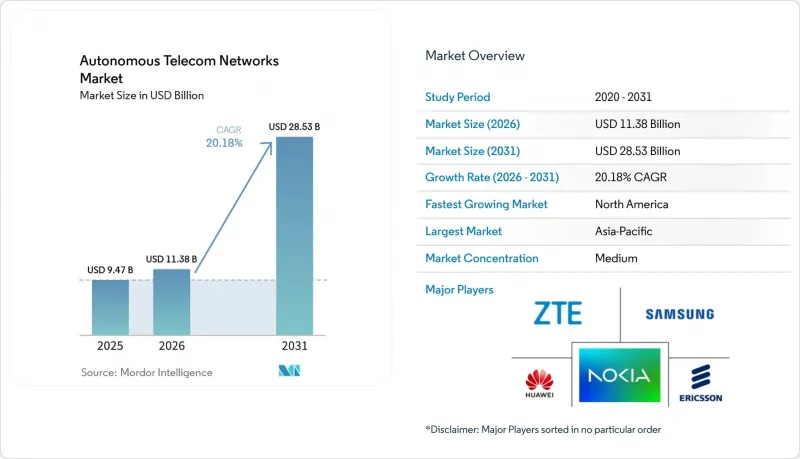
Mordor Intelligence에 의하면, 자율 통신 네트워크 시장 규모는 2025년 94억 7,000만 달러로 평가되었습니다. 2026년 113억 8,000만 달러에서 2031년까지 285억 3,000만 달러로 확대되고 2026년부터 2031년까지 연평균 복합 성장률(CAGR)은 20.18%를 나타낼 것으로 예측됩니다.
본 보고서는 구성 요소(솔루션 및 서비스), 네트워크 계층(무선 액세스 네트워크, 코어 네트워크 등), 도입 형태(On-Premise, 클라우드, 하이브리드), 최종 사용자(Tier 1 MNO, Tier 2 및 Tier 3 MNO 등), 그리고 지역별로 분류되어 있습니다. 시장 전망은 금액(달러) 기준으로 제시되어 있습니다.
세계의 자율 통신 네트워크 시장 동향 및 인사이트
점점 더 복잡해지는 5G 네트워크와 트래픽 양
5세대 독립형(SA) 네트워크는 기존 4G 인프라 위에 동적 스펙트럼 공유, 매시브 MIMO 빔 스티어링 및 멀티 슬라이스 오케스트레이션을 통합하고 있습니다. 버라이즌은 2025년에 15개 대도시권에 RAN 지능형 컨트롤러를 도입하여, 4만 곳의 셀 사이트에서 수동 개입을 68% 줄였습니다. 도이치 텔레콤은 2025년에 하루 평균 23억 건의 무선 측정 데이터를 처리하여, 인구 밀집 도시 지역의 주파수 대역 효율을 22% 향상시켰습니다. 2024년에 최종 확정된 3GPP 규격 릴리스 18에서는 5G 코어 전반에 걸쳐 AI/ML 인터페이스가 의무화되었으며, 통신 사업자들은 일상 업무에 예측 분석을 도입하지 않을 경우, 빠르게 변화하는 경쟁사들에 뒤처질 위험에 직면해 있습니다.
OPEX 절감의 필요성 고조
사용자 1인당 평균 수익은 정체된 반면, 5G 네트워크의 고밀도화로 인해 전력비, 기지국 임대료, 백홀 비용이 증가하고 있습니다. 텔레포니카의 AI 고장 예측 프로그램을 통해 2025년에는 1만 2,000건의 현장 대응이 불필요해졌으며, 네트워크 운영 비용(OPEX)을 30% 절감했습니다. 오렌지사는 같은 해, 매개변수 조정을 자동화함으로써 운영 효율을 25% 향상시켰습니다. 2026년 초, TELUS사는 평균 복구 시간(MTTR)을 40% 단축하고, 1기가바이트당 에너지 소비량을 18% 절감했다고 보고했으며, 이는 연간 8,900만 달러의 비용 절감에 해당합니다. 이러한 성과는 자율적인 워크플로가 네트워크의 성장과 인력 증원을 분리시킨다는 것을 보여줍니다.
AI 플랫폼에 대한 막대한 초기 투자
에릭슨의 추산에 따르면, 5만 개의 기지국을 보유한 Tier 1 통신사가 GPU 서버 및 전문 서비스를 포함한 지능형 자동화 플랫폼을 구축하는 데는 1,500만-3,000만 달러의 비용이 소요됩니다. 마베니어가 2024년에 디시 네트워크를 위해 진행한 Open RAN 프로젝트에서는 네트워크 트래픽이 발생하기도 전에 5,000만 달러가 넘는 비용이 발생했습니다. 따라서 Tier 2 통신 사업자들은 종량제 계약을 선호하지만, 그럼에도 도입 후 3년간의 총 소유 비용은 기존 아키텍처에 비해 여전히 40%에서 60% 더 높습니다.
부문별 분석
2025년에는 솔루션이 매출의 65.53%를 차지했으나, 통신 사업자들이 다중 벤더 통합 문제와 기술 인력 부족에 직면한 가운데, 서비스 부문은 연평균 성장률(CAGR) 22.02%로 확대될 것으로 전망됩니다. IBM은 레거시 OSS, 신흥 오픈 API, 거버넌스 정책을 조화시키는 로드맵을 수립함으로써 2025년에 2억 달러가 넘는 계약을 수주했습니다. 그 결과, Netcracker의 매출 구성에서 지속적인 서비스 요금이 60%를 차지하며, 매출총이익률은 40%를 초과하고 있습니다. 이는 맞춤형 통합 및 관리형 운영 서비스가 플랫폼 라이선스와 동등한 수익원이 되고 있음을 입증합니다.
서비스 분야의 벤더 이익률은 재사용 가능한 AI 모델과 해외 배송 허브 덕분에 향상되고 있으며, 통신 사업자들이 자본 지출(Capex)에서 운영 비용(OpEx)으로 지출 구조를 전환함에 따라, 서비스 제공업체들은 지적 재산을 여러 차례에 걸쳐 수익화할 수 있게 되었습니다. 액센츄어에 따르면, 2026년에는 통신 분야의 매니지드 서비스 매출이 전년 대비 34% 증가할 것으로 예상되며, 이는 자율형 네트워크의 전체 수명 주기에 걸쳐 공급업체의 참여를 보장하는 5년 계약과 관련이 있습니다. 따라서 자율 통신 네트워크 시장에서 매니지드 운영 시장 규모는 솔루션이 여전히 절대적인 최대 점유율을 차지하고 있음에도 불구하고, 플랫폼 수익보다 더 빠르게 확대되고 있습니다.
2025년 매출에서 무선 액세스 자동화가 38.73%로 가장 큰 비중을 차지했으나, 10밀리초 미만의 지연을 요구하는 기업 수요에 힘입어 엣지 오케스트레이션은 연평균 성장률(CAGR) 23.66%를 기록하며 다른 모든 계층을 능가하는 성장이 예상됩니다. 삼성의 AI RAN 엔진은 2025년 버라이즌과 KDDI에서 셀 에지 처리량을 18% 향상시켰습니다. NEC의 엣지 AI 노드는 추론 처리를 생산 라인 근처에 배치함으로써, 자동차 제조업체가 실시간 영상 분석을 통해 식스 시그마 품질 목표를 달성할 수 있도록 이미 지원하고 있습니다.
자율 통신 네트워크 시장 점유율은 여전히 RAN에서 가장 높지만, 공장, 항만, 경기장 등에서 마이크로 데이터센터가 도입됨에 따라 엣지 기능과 관련된 시장 규모는 급속히 확대되고 있습니다. 주니퍼에 따르면, 이 회사의 전송 자동화 제품군은 혼잡이 심한 구역을 우회하여 트래픽을 재라우팅함으로써 패킷 손실을 42% 줄였으며, 눈에 띄지 않는 백홀 영역에서도 AI의 효과가 뚜렷함을 입증하고 있습니다.
지역별 분석
2025년 매출의 36.21%를 차지한 북미 시장은 2031년까지 연평균 19.8%의 성장률을 보일 것으로 전망됩니다. 미국의 통신사들은 이미 5G 독립형 트래픽을 AI 기반 코어로 전환한 반면, 캐나다의 통신사들은 인구 밀도가 낮은 주로 서비스 범위를 확대하기 위해 자동화에 20억 캐나다 달러 이상을 투자했습니다. 또한, 이 지역에서는 벤더 종속성을 완화하고 클라우드 네이티브 스택에 대한 실험을 촉진하는 Open RAN 도입 인센티브도 긍정적인 요인으로 작용하고 있습니다.
아시아·태평양 지역은 2031년까지 23.52%라는 가장 높은 성장률을 달성할 것으로 전망됩니다. 차이나모바일(China Mobile)은 2025년에 100만 곳 이상의 기지국에 AI 최적화 기술을 적용하여 주파수 대역 효율을 15% 향상시켰습니다. 일본의 NTT 도코모는 8만 곳을 아우르는 AI 네트워크 운영 센터를 운영하고 있으며, 한국의 SK텔레콤은 AI를 활용한 네트워크 슬라이싱을 통해 연간 1억 1,200만 달러 이상의 수익을 올리고 있습니다. 인도의 바티 에어텔과 릴라이언스 지오는 2025년 자동화 프로젝트에 맞추어 약 12억 달러를 투자하고 있으며, 이는 해당 지역의 규모가 얼마나 큰지를 여실히 보여주고 있습니다.
유럽은 2025년 지출의 약 22%를 차지했으며, 에너지 효율화 의무화 및 보안 규제가 자동화를 가속화함에 따라 연평균 성장률(CAGR) 18.5%를 기록할 전망입니다. 도이치 텔레콤의 하이브리드 클라우드 네트워크는 3개국에서 99.99%의 가용성을 달성한 반면, 보다폰은 예측 유지보수를 통해 현장 대응을 35% 줄였습니다. 중동 및 아프리카는 사우디아라비아의 스마트시티 구상과 아랍에미리트의 프로젝트에 힘입어 현재 매출의 6%를 차지하고 있습니다. 한편, 라틴아메리카는 4%에 그치고 있지만, 통신 사업자들이 운영 비용(OPEX) 절감을 모색하는 가운데 성장세가 가속화되고 있습니다.
기타 혜택 :
- 엑셀 형식 시장 예측(ME) 시트
- 3개월간의 애널리스트 지원
자주 묻는 질문
목차
제1장 서론
제2장 조사 방법
제3장 주요 요약
제4장 시장 구도
제5장 시장 규모 및 성장 예측
제6장 경쟁 구도
제7장 시장 기회 및 향후 전망
KTH 26.06.22According to Mordor Intelligence, the autonomous telecom networks market size is projected to expand from USD 9.47 billion in 2025 and USD 11.38 billion in 2026 to USD 28.53 billion by 2031, registering a CAGR of 20.18% between 2026 to 2031.

This report is Segmented by Component (Solutions and Services), Network Layer (Radio Access Network, Core Network, and More), Deployment Mode (On-Premises, Cloud, and Hybrid), End User (Tier-1 MNOs, Tier-2 and Tier-3 MNOs, and More), and Geography. The Market Forecasts are Provided in Terms of Value (USD).
Global Autonomous Telecom Networks Market Trends and Insights
Rising 5G Network Complexity and Traffic Volume
Fifth-generation standalone networks layer dynamic spectrum sharing, massive-MIMO beam steering, and multi-slice orchestration on top of existing 4G infrastructure. Verizon deployed RAN intelligent controllers across 15 metropolitan areas in 2025 and cut manual intervention on 40,000 cell sites by 68%. Deutsche Telekom processed 2.3 billion radio measurements per day in 2025, boosting spectral efficiency by 22% in dense urban areas. Release 18 of the 3GPP standard, finalized in 2024, now mandates AI/ML interfaces throughout the 5G core, compelling operators to embed predictive analytics within routine workflows or risk falling behind faster-moving rivals.
Escalating OPEX Reduction Imperatives
Average revenue per user remains flat, yet 5G densification raises electricity, site leasing, and backhaul expenses. Telefonica's AI fault-prediction program removed 12,000 truck rolls and cut network OPEX by 30% in 2025. Orange lifted operational efficiency by 25% after automating parameter tuning in the same year. In early 2026, TELUS reported a 40% reduction in mean-time-to-repair and an 18% drop in energy consumption per gigabyte, equating to USD 89 million in annual savings. These gains illustrate how autonomous workflows decouple network growth from headcount growth.
High Upfront Investment in AI Platforms
Ericsson estimates that a Tier-1 carrier with 50,000 sites spends USD 15 million to USD 30 million to roll out its intelligent automation platform, including GPU servers and professional services. Mavenir's 2024 Open RAN project at Dish Network exceeded USD 50 million before network traffic even flowed. Tier-2 operators therefore prefer consumption-based contracts, yet the total cost of ownership in the first three years still runs 40% to 60% above that of traditional architectures.
Other drivers and restraints analyzed in the detailed report include:
- Shortage of Skilled Network Engineers
- Transition to Cloud-Native Service-Based Architectures
- Data Privacy and Cyber-Security Concerns
For complete list of drivers and restraints, kindly check the Table Of Contents.
Segment Analysis
Solutions accounted for 65.53% of revenue in 2025, yet services are forecast to expand at a 22.02% CAGR as operators confront multivendor integration challenges and skill shortages. IBM captured contracts worth more than USD 200 million in 2025 by drafting roadmaps that aligned legacy OSS, emerging open APIs, and governance policies. As a result, recurring service fees now represent 60% of Netcracker's revenue mix with gross margins above 40%, confirming that bespoke integration and managed operations have become a profit pool equal to platform licenses.
Vendor margins on services benefit from reusable AI models and offshore delivery hubs, letting providers monetize intellectual property several times over while operators shift spend from capex to opex. Accenture saw telecommunications managed-service revenue climb 34% year over year in 2026, tied to five-year engagements that lock in vendor participation across the life of an autonomous network. The autonomous telecom networks market size for managed operations is therefore rising faster than platform revenue, even though solutions remain the largest absolute bucket.
Radio access automation accounted for the largest share of 2025 revenue at 38.73%, but edge orchestration is projected to outpace every other layer with a 23.66% CAGR, driven by enterprise demand for sub-10-millisecond latency. Samsung's AI RAN engine boosted cell-edge throughput by 18% for Verizon and KDDI during 2025. NEC's edge AI nodes bring inference closer to production lines and have already enabled car manufacturers to meet six-sigma quality targets in real-time video analytics.
While the autonomous telecom networks market share remains highest in the RAN, the market size linked to edge functions is growing rapidly as factories, ports, and stadiums deploy micro data centers. Juniper says its transport automation suite reduced packet loss by 42% by rerouting traffic around congestion hotspots, demonstrating that AI's impact is meaningful even in the less visible backhaul domain.
Geography Analysis
North America, which accounted for 36.21% of 2025 revenue, is forecast to compound at 19.8% annually through 2031. U.S. carriers have already moved 5G standalone traffic onto AI-driven cores, while Canadian operators invested more than CAD 2 billion in automation to extend coverage into sparsely populated provinces. The region also benefits from Open RAN procurement incentives that reduce vendor lock-in and encourage experimentation with cloud-native stacks.
Asia-Pacific is on course to deliver the fastest expansion at 23.52% through 2031. China Mobile applied AI optimization to more than 1 million cell sites in 2025, boosting spectral efficiency by 15%. Japan's NTT DOCOMO runs an AI network operations center covering 80,000 sites, and South Korea's SK Telecom earns over USD 112 million annually from AI-enabled network slices. India's Bharti Airtel and Reliance Jio together invested roughly USD 1.2 billion in 2025 automation projects, highlighting the region's scale.
Europe held about 22% of 2025 spending and should post an 18.5% CAGR as energy-efficiency mandates and security rules accelerate automation. Deutsche Telekom's hybrid cloud network achieved 99.99% availability across three countries, while Vodafone cut truck rolls by 35% through predictive maintenance. The Middle East and Africa account for 6% of current revenue, driven by Saudi Arabia's smart-city initiatives and United Arab Emirates projects, whereas Latin America lags at 4% but is gaining momentum as carriers seek OPEX relief.
- Telefonaktiebolaget LM Ericsson
- Nokia Corporation
- Huawei Technologies Co., Ltd.
- ZTE Corporation
- Samsung Electronics Co., Ltd.
- NEC Corporation
- Cisco Systems, Inc.
- Juniper Networks, Inc.
- Hewlett Packard Enterprise Company
- IBM Corporation
- Netcracker Technology Corporation
- Amdocs Limited
- Mavenir Systems, Inc.
- Parallel Wireless, Inc.
- AirHop Communications, Inc.
- Cellwize Wireless Technologies Pte Ltd.
- P.I. Works Inc.
- TEOCO Corporation
- Commsquare SA
Additional Benefits:
- The market estimate (ME) sheet in Excel format
- 3 months of analyst support
TABLE OF CONTENTS
1 INTRODUCTION
- 1.1 Study Assumptions and Market Definition
- 1.2 Scope of the Study
2 RESEARCH METHODOLOGY
3 EXECUTIVE SUMMARY
4 MARKET LANDSCAPE
- 4.1 Market Overview
- 4.2 Market Drivers
- 4.2.1 Rising 5G Network Complexity and Traffic Volume
- 4.2.2 Escalating OPEX Reduction Imperatives
- 4.2.3 Shortage of Skilled Network Engineers
- 4.2.4 Transition to Cloud-Native Service-Based Architectures
- 4.2.5 Adoption of RAN Intelligent Controller (RIC) Automation
- 4.2.6 Multi-Vendor Open RAN Interoperability Requirements
- 4.3 Market Restraints
- 4.3.1 High Upfront Investment in AI Platforms
- 4.3.2 Data Privacy and Cyber-Security Concerns
- 4.3.3 Legacy Integration Complexity
- 4.3.4 Algorithmic Bias and Explainability Risks
- 4.4 Industry Value Chain Analysis
- 4.5 Regulatory Landscape
- 4.6 Technological Outlook
- 4.7 Impact of Macroeconomic Factors
- 4.8 Porter's Five Forces Analysis
- 4.8.1 Bargaining Power of Suppliers
- 4.8.2 Bargaining Power of Buyers
- 4.8.3 Threat of New Entrants
- 4.8.4 Threat of Substitutes
- 4.8.5 Competitive Rivalry
5 MARKET SIZE AND GROWTH FORECASTS (VALUE)
- 5.1 By Component
- 5.1.1 Solutions
- 5.1.2 Services
- 5.2 By Network Layer
- 5.2.1 Radio Access Network (RAN)
- 5.2.2 Core Network
- 5.2.3 Transport Network
- 5.2.4 Edge Network
- 5.2.5 End-to-End Orchestration
- 5.3 By Deployment Mode
- 5.3.1 On-Premises
- 5.3.2 Cloud
- 5.3.3 Hybrid
- 5.4 By End User
- 5.4.1 Tier-1 Mobile Network Operators
- 5.4.2 Tier-2 and Tier-3 Mobile Network Operators
- 5.4.3 Mobile Virtual Network Operators (MVNOs)
- 5.4.4 Private Network Owners (Enterprises and Verticals)
- 5.4.5 Neutral Host Providers
- 5.5 By Geography
- 5.5.1 North America
- 5.5.1.1 United States
- 5.5.1.2 Canada
- 5.5.1.3 Mexico
- 5.5.2 South America
- 5.5.2.1 Brazil
- 5.5.2.2 Argentina
- 5.5.2.3 Rest of South America
- 5.5.3 Europe
- 5.5.3.1 Germany
- 5.5.3.2 United Kingdom
- 5.5.3.3 France
- 5.5.3.4 Italy
- 5.5.3.5 Spain
- 5.5.3.6 Russia
- 5.5.3.7 Rest of Europe
- 5.5.4 Asia-Pacific
- 5.5.4.1 China
- 5.5.4.2 Japan
- 5.5.4.3 India
- 5.5.4.4 South Korea
- 5.5.4.5 Australia
- 5.5.4.6 Rest of Asia-Pacific
- 5.5.5 Middle East and Africa
- 5.5.5.1 Middle East
- 5.5.5.1.1 United Arab Emirates
- 5.5.5.1.2 Saudi Arabia
- 5.5.5.1.3 Turkey
- 5.5.5.1.4 Rest of Middle East
- 5.5.5.2 Africa
- 5.5.5.2.1 South Africa
- 5.5.5.2.2 Egypt
- 5.5.5.2.3 Nigeria
- 5.5.5.2.4 Rest of Africa
- 5.5.5.1 Middle East
- 5.5.1 North America
6 COMPETITIVE LANDSCAPE
- 6.1 Market Concentration
- 6.2 Strategic Moves
- 6.3 Market Share Analysis
- 6.4 Company Profiles (includes Global level Overview, Market level overview, Core Segments, Financials as available, Strategic Information, Market Rank/Share for key companies, Products and Services, and Recent Developments)
- 6.4.1 Telefonaktiebolaget LM Ericsson
- 6.4.2 Nokia Corporation
- 6.4.3 Huawei Technologies Co., Ltd.
- 6.4.4 ZTE Corporation
- 6.4.5 Samsung Electronics Co., Ltd.
- 6.4.6 NEC Corporation
- 6.4.7 Cisco Systems, Inc.
- 6.4.8 Juniper Networks, Inc.
- 6.4.9 Hewlett Packard Enterprise Company
- 6.4.10 IBM Corporation
- 6.4.11 Netcracker Technology Corporation
- 6.4.12 Amdocs Limited
- 6.4.13 Mavenir Systems, Inc.
- 6.4.14 Parallel Wireless, Inc.
- 6.4.15 AirHop Communications, Inc.
- 6.4.16 Cellwize Wireless Technologies Pte Ltd.
- 6.4.17 P.I. Works Inc.
- 6.4.18 TEOCO Corporation
- 6.4.19 Commsquare SA
7 MARKET OPPORTUNITIES AND FUTURE OUTLOOK
- 7.1 White-Space and Unmet-Need Assessment

