
|
시장보고서
상품코드
2065749
감시 카메라 시장 : 점유율 분석, 업계 동향과 통계, 성장 예측(2026-2031년)Surveillance Camera - Market Share Analysis, Industry Trends & Statistics, Growth Forecasts (2026 - 2031) |
||||||
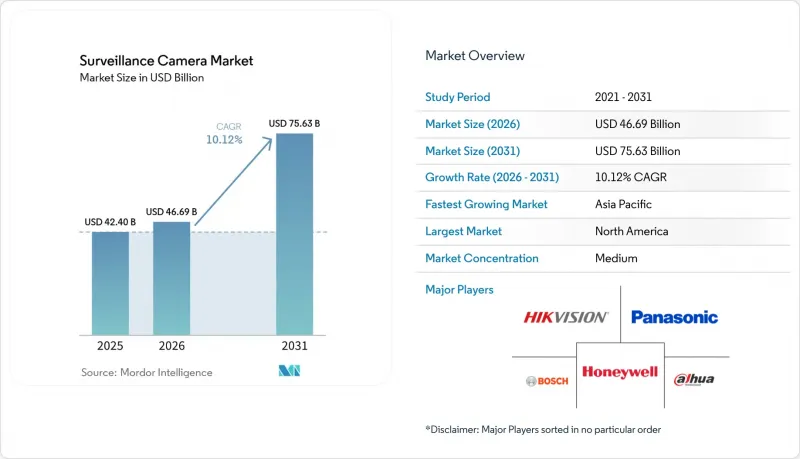
Mordor Intelligence에 의하면, 2026년 감시 카메라 시장 규모는 466억 9,000만 달러로 추정되고 있어 2025년 424억 달러에서 확대해, 2031년에는 756억 3,000만 달러에 이를 것으로 예측됩니다.
2026년부터 2031년까지 연평균 성장률(CAGR) 10.12%로 성장할 것으로 전망됩니다.

본 보고서는 기술별(아날로그 카메라, IP 카메라 등), 형태별(돔 카메라, 배럿 카메라 등), 해상도별(비 HD, HD 등), 연결 방식별(유선, PoE 등), 배포 모델별(On-Premise 등), 최종 사용 산업(은행, 금융서비스 및 보험(BFSI), 운송·인프라 등), 지역별로 분류되어 있습니다. 시장 전망은 금액(달러) 기준으로 제시되어 있습니다.
세계 감시 카메라 시장 동향과 인사이트
5G 엣지 네트워크가 UHD 감시를 실현합니다.
5G를 도입한 산업 시설에서는 10밀리초 미만의 지연 시간을 실현하여, 4K 카메라를 통한 끊김 없는 영상 전송이 가능해지는 한편, 내장형 AI가 기기의 고장이나 안전 규정 위반 등의 이상을 감지합니다. 각 제조업체에 따르면, 엣지 추론이 인적 검사를 대체한 결과, 안전 사고가 37% 감소하고 품질 관리 효율이 42% 향상되었다고 합니다.
아시아 주요 도시에서의 AI 군중 분석
싱가포르와 한국의 교통 당국은 일상적인 이동과 보안 위협을 구분하는 분석 시스템을 도입하여 오경보를 76% 줄이는 동시에 감지 정확도를 94%까지 높였습니다. 승객 흐름에 대한 인사이트를 활용함으로써 인력 배치 결정이 개선되어, 피크 시간대의 처리 능력이 23% 향상되었습니다.
GPU 공급 부족으로 인해 AI 카메라 비용이 상승
엣지 AI 카메라의 경우, 비전 가속기의 납기 기간이 26주로 길어지면서 부품 비용이 18-25% 급등하고 있습니다. 우선적인 할당을 받지 못한 중소 공급업체들은 납기 지연 위험에 직면해 있으며, 그 결과 채널 점유율이 대형 경쟁사로 이동할 우려가 있습니다.
부문별 분석
IP 카메라는 2025년에 매출 점유율의 64.35%를 차지할 것으로 예상되며, PoE의 편의성과 소프트웨어 정의 기능성을 바탕으로 도입 대수가 증가하고 있습니다. 동축 인프라와 IP 분석을 연결하는 하이브리드 모델은 비용을 중시하는 사용자들이 기존의 아날로그 장비를 단계적으로 폐지함에 따라 연평균 성장률(CAGR) 11.84%로 성장하고 있습니다. 가치는 렌즈에서 알고리즘으로 이동하고 있으며, 그 결과 소프트웨어 중심의 신규 진출기업들은 기존에 인적 감시에 의존하던 영상 관리 시스템에 AI를 접목함으로써 수익성을 확보하고 있습니다.
현재 시장의 기존 기업들은 침입 감지 센서, 접근 제어, 비즈니스 대시보드를 통합하고 다양한 API를 갖춘 플랫폼을 패키지로 제공합니다. 이러한 서비스 중심의 전환을 통해 벤더들은 카메라를 개별적으로 판매하는 대신 지속적인 분석 서비스의 구독을 통해 수익을 창출할 수 있게 되었으며, 이러한 추세는 감시 카메라 시장 전체의 수익 인식 방식을 재편하고 있습니다.
돔형 카메라는 소매점 매장과 사무실 로비에서 뛰어난 내파괴성과 미적 매력 덕분에 2025년 매출의 31.45%를 계속 차지했습니다. 연평균 성장률(CAGR) 12.88%를 기록한 PTZ 모델은 운영자가 광범위한 범위에서 용의자를 추적할 수 있게 해줄 뿐만 아니라, 단 한 대의 기기로 여러 대의 고정형 카메라와 동등한 기능을 발휘하기 때문에 높은 평균 판매 가격을 뒷받침하고 있습니다. 방향성을 중시하는 억제력이 필수적인 주변 경비 분야에서는 여전히 배럿형이 선호되고 있습니다. 한편, 터렛형이나 멀티센서형과 같은 혁신적인 기술은 어안 렌즈를 통해 왜곡 없는 360° 커버 범위를 원하는 틈새 시장 수요를 충족시키고 있습니다.
각 제조업체들은 PTZ 렌즈의 위치를 실시간으로 조정하는 자동 추적 알고리즘을 탑재하고 있으며, 이로 인해 물류 허브나 교통 터미널에서 PTZ 솔루션 기반 감시 카메라 시장 규모가 고정식 카메라 시장 점유율을 서서히 잠식하고 있습니다. 동시에, 중요한 에너지 자산을 보호하기 위해 연기가 자욱한 환경이나 완전한 암흑 환경에 대응할 수 있도록 열화상 기능을 탑재한 모델이 채택되었습니다.
지역별 분석
아시아는 2025년에 전 세계 매출의 40.60%를 차지해, 중국의 공공 안전 투자와 인도의 스마트시티 입찰로 인해 조달 주기가 가속화되는 가운데 연평균 성장률(CAGR) 10.78%로 성장을 이어가고 있습니다. 싱가포르 지하철에서는 AI를 활용한 군중 분석 시스템으로 업그레이드하여 오경보를 76% 줄이는 동시에 위협 감지 정확도를 94%까지 높였습니다. 각 지역의 제조업체들은 국내 시장 규모를 활용하고, 신속한 개선을 거듭함으로써 유럽 및 미국의 경쟁사들과의 기술 격차를 좁혀가고 있습니다.
북미는 소매 업계에서의 VSaaS 도입과 중요 인프라를 보호하기 위한 연방 정부의 이니셔티브에 힘입어 두 번째로 큰 시장 점유율을 차지하고 있습니다. 현재 사용자의 44%가 적어도 한 곳의 클라우드 연결 사이트를 운영하고 있으며, 이 수치는 여러 지점을 보유한 체인점이 보안 운영을 통합함에 따라 증가하고 있습니다. 캐나다의 개인정보 보호 규제는 익명화 도구에 대한 수요를 촉진하고 있으며, 규정 준수를 중시하는 분석에 중점을 둔 제품 로드맵에 영향을 미치고 있습니다.
유럽 시장은 GDPR(EU 개인정보보호규정) 및 새로 제정되고 있는 AI 법에 의해 형성되고 있으며, 공급업체들은 단말기 내 정보 마스킹과 같은 개인정보 보호 기능을 통합해야 하는 압박을 받고 있습니다. 영국에서는 엣지 AI를 활용해 광범위한 레거시 네트워크의 현대화가 진행되고 있는 반면, 독일에서는 카메라 영상을 품질 관리 시스템에 활용하는 산업 통합이 중시되고 있습니다. 북유럽의 지자체에서는 안전 확보뿐만 아니라 교통 체증 및 환경 지표 관리에도 카메라를 도입하여 그 적용 범위를 확대되고 있습니다.
기타 혜택:
- 엑셀 형식 시장 예측(ME) 시트
- 3개월간의 애널리스트 지원
자주 묻는 질문
목차
제1장 서론
제2장 조사 방법
제3장 주요 요약
제4장 시장 구도
제5장 시장 규모와 성장 예측
제6장 경쟁 구도
제7장 시장 기회와 향후 전망
JHS 26.06.29According to Mordor Intelligence, surveillance camera market size in 2026 is estimated at USD 46.69 billion, growing from 2025 value of USD 42.40 billion with 2031 projections showing USD 75.63 billion, growing at 10.12% CAGR over 2026-2031.
This report is Segmented by Technology (Analog Cameras, IP Cameras, and More), Form Factor (Dome Cameras, Bullet Cameras, and More), Resolution (Non-HD, HD, and More), Connectivity (Wired, Power-Over-Ethernet, and More), Deployment Model (On-Premise, and More), End-User Industry (BFSI, Transportation and Infrastructure, and More), and by Geography. The Market Forecasts are Provided in Terms of Value (USD).
Global Surveillance Camera Market Trends and Insights
5G-edge networks unlock UHD surveillance
Industrial sites adopting 5G achieve sub-10 ms latency, allowing 4K cameras to stream uninterrupted while embedded AI flags anomalies such as equipment defects or safety breaches. Manufacturers report 37% fewer safety incidents and a 42% uptick in quality-control efficiency as edge inference replaces manual inspection.
AI crowd analytics in mega Asian hubs
Transit authorities in Singapore and South Korea deploy analytics that distinguish routine movement from security threats, cutting false alarms by 76% and boosting detection accuracy to 94%. Passenger-flow insights improve staffing decisions, raising peak-hour throughput by 23%.
GPU shortages raise AI-camera costs
Edge-AI cameras face component cost spikes of 18-25% as delivery windows for vision accelerators stretch to 26 weeks. Smaller vendors without preferential allocation risk delays that can shift channel share to larger rivals.
Other drivers and restraints analyzed in the detailed report include:
- Safe-city programs accelerate in GCC capitals
- Cloud-native VSaaS adoption in North-American retail
- Data localization complicates cloud roll-outs
For complete list of drivers and restraints, kindly check the Table Of Contents.
Segment Analysis
IP cameras commanded a 64.35% revenue share in 2025, and their installed base is expanding on the back of PoE simplicity and software-defined functionality. Hybrid models, which bridge coaxial infrastructure to IP analytics, are advancing at a 11.84% CAGR as cost-sensitive users phase out legacy analog gear. Value is migrating from the lens to the algorithm; consequently, software-centric entrants capture margin by embedding AI into video management systems that formerly relied on human monitoring.
Market incumbents now bundle API-rich platforms that integrate intrusion sensors, access control, and business dashboards. This service-oriented pivot positions vendors to monetize recurring analytics subscriptions rather than one-time camera sales, a trend reshaping revenue recognition across the surveillance camera market.
Dome units retained 31.45% of 2025 sales thanks to vandal resistance and aesthetic appeal in retail aisles and office lobbies. PTZ models, with a 12.88% CAGR, allow operators to track suspects across wide areas, making a single device the functional equivalent of multiple fixed cameras and supporting higher average selling prices. Bullet designs remain favored for perimeter defense where directional deterrence is paramount, while turret and multi-sensor innovations answer niche requirements for 360° coverage without fisheye distortion.
Manufacturers are embedding auto-tracking algorithms that reposition PTZ lenses in real time, ensuring that the surveillance camera market size for PTZ solutions captures incremental share from static devices in logistics hubs and transport terminals. At the same time, thermographic options are being specified for smoke-filled or zero-light environments to safeguard critical energy assets.
Geography Analysis
Asia accounted for 40.60% of global revenue in 2025 and continues to expand at an 10.78% CAGR as China's public-safety investments and India's smart-city tenders accelerate procurement cycles. Singapore's metro upgraded to AI crowd analytics that trimmed false alerts by 76% while boosting threat recognition accuracy to 94%. Regional manufacturers capitalize on domestic scale to iterate rapidly, closing technology gaps with Western competitors.
North America holds the second-largest share, underpinned by retail VSaaS adoption and federal initiatives protecting critical infrastructure. Forty-four percent of users now operate at least one cloud-connected site, a figure that grows as multi-location chains consolidate security operations. Privacy mandates in Canada spur demand for anonymization tools, influencing product roadmaps oriented toward compliance-ready analytics.
Europe's market is shaped by GDPR and the emerging AI Act, pushing suppliers to integrate privacy-preserving functions such as on-device redaction. The United Kingdom modernizes an extensive legacy network with edge AI, while Germany emphasizes industrial integration where cameras feed quality-control systems. Nordic municipalities deploy cameras not only for safety but also to manage congestion and environmental metrics, expanding application breadth.
- Hangzhou Hikvision Digital Technology Co., Ltd.
- Zhejiang Dahua Technology Co., Ltd.
- Axis Communications AB
- Bosch Security Systems GmbH
- Honeywell International Inc.
- Panasonic Corporation
- Motorola Solutions, Inc. (Avigilon)
- Genetec Inc.
- Hanwha Vision Co., Ltd. (Hanwha Techwin)
- Cisco Systems Inc.
- CP Plus GmbH and Co. KG
- Teledyne FLIR LLC
- Johnson Controls Intl. plc (Tyco)
- Pelco, Inc.
- Uniview Technologies Co., Ltd.
- Arlo Technologies, Inc.
- Eagle Eye Networks, Inc.
- Swann Communications Pty Ltd.
- Lorex Technology Inc.
- Verkada Inc.
Additional Benefits:
- The market estimate (ME) sheet in Excel format
- 3 months of analyst support
TABLE OF CONTENTS
1 INTRODUCTION
- 1.1 Study Assumptions and Market Definition
- 1.2 Scope of the Study
2 RESEARCH METHODOLOGY
3 EXECUTIVE SUMMARY
4 MARKET LANDSCAPE
- 4.1 Market Overview
- 4.2 Market Drivers
- 4.2.1 Enabling 5G-Edge Networks Unlocking Real-Time UHD Surveillance in Smart Factories
- 4.2.2 Mandates for AI-based Crowd Analytics in Mega Asian Transport Hubs
- 4.2.3 Rapid Roll-out of Safe-City Programs in Middle-East Oil Economies
- 4.2.4 Shift to Cloud-Native VSaaS Among North-American Multi-site Retailers
- 4.2.5 Insurance Incentives for Connected-Home Cameras in Europe's High-Risk Urban Zones
- 4.2.6 Heightened Compliance Requirements for Critical Infrastructure under US TSA Directives
- 4.3 Market Restraints
- 4.3.1 Escalating GPU Shortages Inflating AI-Camera BOM Costs
- 4.3.2 Data-Localization Laws Hindering Cross-Border Video Storage in GCC and ASEAN
- 4.3.3 Privacy-Centric OS Updates Curbing On-Device Face-Recognition in EU
- 4.3.4 Power Constraints in Off-Grid Mining Sites Limiting UHD Adoption
- 4.4 Value / Supply-Chain Analysis
- 4.5 Regulatory or Technological Outlook
- 4.6 Porter's Five Forces
- 4.6.1 Bargaining Power of Suppliers
- 4.6.2 Bargaining Power of Buyers
- 4.6.3 Threat of New Entrants
- 4.6.4 Threat of Substitutes
- 4.6.5 Intensity of Competitive Rivalry
5 MARKET SIZE AND GROWTH FORECASTS (VALUE)
- 5.1 By Technology
- 5.1.1 Analog Cameras
- 5.1.2 IP Cameras
- 5.1.3 Hybrid Cameras
- 5.2 By Form Factor
- 5.2.1 Dome Cameras
- 5.2.2 Bullet Cameras
- 5.2.3 PTZ Cameras
- 5.2.4 Box Cameras
- 5.2.5 Turret Cameras
- 5.2.6 Fisheye Cameras
- 5.2.7 Thermal Cameras
- 5.3 By Resolution
- 5.3.1 Non-HD (<=720p)
- 5.3.2 HD (720p-1080p)
- 5.3.3 Full HD (1080p-2K)
- 5.3.4 Ultra HD / 4K (>=4K)
- 5.4 By Connectivity
- 5.4.1 Wired
- 5.4.2 Power-over-Ethernet (PoE)
- 5.4.3 Wireless (Wi-Fi/Zigbee)
- 5.4.4 Cellular (4G/5G NB-IoT)
- 5.5 By Deployment Model
- 5.5.1 On-Premise
- 5.5.2 Cloud / VSaaS
- 5.5.3 Edge / On-Device Storage
- 5.5.4 Hybrid
- 5.6 By End-User Industry
- 5.6.1 Banking and Financial Institutions (BFSI)
- 5.6.2 Transportation and Infrastructure
- 5.6.3 Government and Defense
- 5.6.4 Healthcare Facilities
- 5.6.5 Industrial and Manufacturing
- 5.6.6 Retail and Hospitality
- 5.6.7 Enterprise and Commercial Offices
- 5.6.8 Residential / Smart Home
- 5.6.9 Logistics and Warehousing
- 5.6.10 Educational Campuses
- 5.6.11 Others
- 5.7 By Geography
- 5.7.1 North America
- 5.7.1.1 United States
- 5.7.1.2 Canada
- 5.7.1.3 Mexico
- 5.7.2 South America
- 5.7.2.1 Brazil
- 5.7.2.2 Argentina
- 5.7.2.3 Chile
- 5.7.2.4 Rest of South America
- 5.7.3 Europe
- 5.7.3.1 United Kingdom
- 5.7.3.2 Germany
- 5.7.3.3 France
- 5.7.3.4 Italy
- 5.7.3.5 Spain
- 5.7.3.6 Nordics
- 5.7.3.7 Rest of Europe
- 5.7.4 APAC
- 5.7.4.1 China
- 5.7.4.2 Japan
- 5.7.4.3 India
- 5.7.4.4 South Korea
- 5.7.4.5 Indonesia
- 5.7.4.6 Australia
- 5.7.4.7 New Zealand
- 5.7.4.8 ASEAN-5
- 5.7.4.9 Rest of APAC
- 5.7.5 Middle East
- 5.7.5.1 Saudi Arabia
- 5.7.5.2 United Arab Emirates
- 5.7.5.3 Qatar
- 5.7.5.4 Kuwait
- 5.7.5.5 Oman
- 5.7.5.6 Bahrain
- 5.7.5.7 Turkey
- 5.7.5.8 Rest of Middle East
- 5.7.6 Africa
- 5.7.6.1 South Africa
- 5.7.6.2 Nigeria
- 5.7.6.3 Kenya
- 5.7.6.4 Rest of Africa
- 5.7.1 North America
6 COMPETITIVE LANDSCAPE
- 6.1 Market Concentration
- 6.2 Strategic Moves
- 6.3 Market Share Analysis
- 6.4 Company Profiles (includes Global-level Overview, Market-level Overview, Core Segments, Financials, Strategic Information, Market Rank/Share, Products and Services, Recent Developments)
- 6.4.1 Hangzhou Hikvision Digital Technology Co., Ltd.
- 6.4.2 Zhejiang Dahua Technology Co., Ltd.
- 6.4.3 Axis Communications AB
- 6.4.4 Bosch Security Systems GmbH
- 6.4.5 Honeywell International Inc.
- 6.4.6 Panasonic Corporation
- 6.4.7 Motorola Solutions, Inc. (Avigilon)
- 6.4.8 Genetec Inc.
- 6.4.9 Hanwha Vision Co., Ltd. (Hanwha Techwin)
- 6.4.10 Cisco Systems Inc.
- 6.4.11 CP Plus GmbH and Co. KG
- 6.4.12 Teledyne FLIR LLC
- 6.4.13 Johnson Controls Intl. plc (Tyco)
- 6.4.14 Pelco, Inc.
- 6.4.15 Uniview Technologies Co., Ltd.
- 6.4.16 Arlo Technologies, Inc.
- 6.4.17 Eagle Eye Networks, Inc.
- 6.4.18 Swann Communications Pty Ltd.
- 6.4.19 Lorex Technology Inc.
- 6.4.20 Verkada Inc.
7 MARKET OPPORTUNITIES AND FUTURE OUTLOOK
- 7.1 White-space and Unmet-Need Assessment

