
|
시장보고서
상품코드
2066394
중국의 전력 시장 : 점유율 분석, 업계 동향과 통계, 성장 예측(2026-2031년)China Power - Market Share Analysis, Industry Trends & Statistics, Growth Forecasts (2026 - 2031) |
||||||
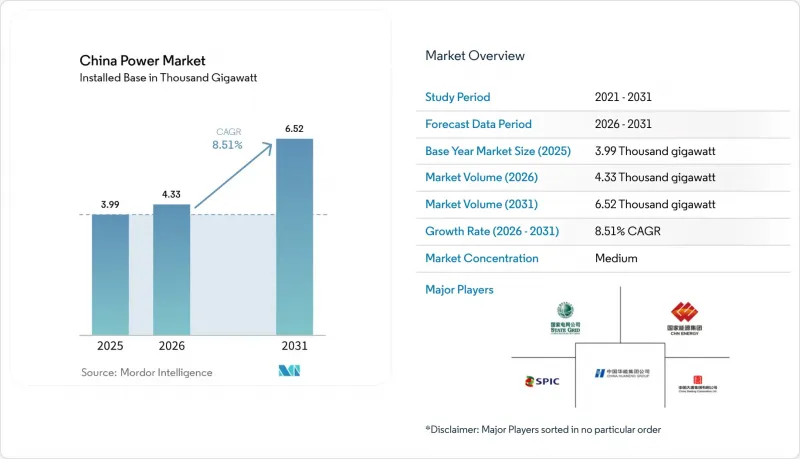
Mordor Intelligence에 의하면, 중국 전력 시장 규모는 2025년 3,990기가와트에서 2026년에는 4,330기가와트로 확대되어 2026년부터 2031년까지 CAGR 8.51%로 성장을 지속하여, 2031년까지 6,520기가와트에 이를 것으로 예측됩니다.
본 보고서는 발전원별(화력, 원자력, 재생에너지) 및 최종 사용자별(유틸리티, 상업 및 산업, 주택)로 분류되어 있습니다. 시장 규모 및 전망은 설비 용량(GW) 단위로 표시되어 있습니다.
중국 전력 시장 동향과 인사이트
그리드 패리티의 가속화에 따른 태양광 발전 입찰이 시장의 변화를 주도하고 있습니다.
2025년부터 경쟁 입찰이 의무화됨에 따라 고정가격 임베디드 제도(FIT)를 대체하게 되었으며, 개발 사업자는 지역별 경매 설계의 유연성을 유지하면서도 전적으로 경제성에 기반한 가격 책정을 해야 하는 상황에 놓이게 되었습니다. 이 정책은 태양광 패널의 과잉 생산을 배경으로 도입되어, 경쟁력이 약한 기업을 시장에서 퇴출시키고 업계 재편을 촉진하고 있습니다. 동시에, 현물 가격 변동 위험에 노출됨에 따라 수익 위험을 분산시키는 에너지 저장 설비를 결합한 프로젝트에 대한 관심이 높아지고 있으며, 중국의 전력 시장은 보다 활발한 상거래가 이루어지는 체제로 전환되고 있습니다.
주 차원의 재생에너지 포트폴리오 기준이 청정 에너지 의무 이행을 철저히 보장합니다.
급성장하는 그린 인증서 시장(2024년 거래액 327% 증가)에 기반을 둔 의무 할당량은 각 부처의 에너지 집약도 목표와 재생에너지 조달을 연계하고 있습니다. 자원이 풍부한 서부 각 성은 수요가 많은 연안 거점에 인증서를 판매함으로써 잉여 전력을 수익화하고 있으며, 이를 통해 지역 간 전력 흐름과 분산형 태양광 발전의 도입이 촉진되고 있습니다.
스트랜드드 자산의 위험이 석탄 의존 지역의 과제로 대두되고 있습니다.
발전소의 조기 폐쇄나 가동 시간 단축은 석탄에 의존하는 주립 발전 사업자와 지역 경제의 재정 건전성을 위협하고 있습니다. 대출 기관들이 탄소 가격이나 가동률 하락을 대출 조건에 반영함에 따라, 재무적 심사가 더욱 엄격해지고 있습니다. 겨울철 난방 공급의 안정성을 확보하기 위해서는 석탄 화력 발전소의 폐지 일정을 대체 자원 도입 계획과 조율하는 것이 여전히 필수적입니다.
부문별 분석
2025년에는 재생에너지가 발전 용량의 53.78%를 차지해, 신규 도입이 연평균 성장률(CAGR) 12.12%로 증가함에 따라 중국 전력 시장 규모에서 재생에너지가 차지하는 비중은 2031년까지 65.7%를 넘어설 것으로 전망됩니다. 태양광 발전 설비 용량은 300 GW가 더 급증한 끝에, 2024년에는 단독으로 842 GW에 달했습니다. 가성비 지표에서 N형 TOPCon 모듈이 PERC형을 앞지르고 있습니다. 장쑤성, 광둥성, 푸젠성의 해상 풍력 발전 용량은 현재 45GW에 달하며, 18 MW급 풍력 터빈은 55% 이상의 설비 가동률을 달성하고, 균등화 발전 비용을 1kWh당 0.30 위안까지 낮췄습니다. 수력 발전은 420 GW라는 생태학적 상한선에 가까워지고 있기 때문에 2030년까지 100 GW를 목표로 하는 양수 발전의 확충이 주요 성장 동력이 되고 있습니다. 바이오매스, 지열, 조력 발전은 원료나 입지 조건의 제약으로 인해 총 발전 용량이 50 GW 미만을 유지하고 있습니다.
화력 발전 용량은 중국 전력 시장 점유율의 39.5%를 차지하고 있지만, 높은 가동률 덕분에 석탄은 여전히 국내 발전량의 60%를 공급하고 있습니다. 천연가스 발전 설비는 현재 총 130GW에 달하며, LNG 가격이 100만 영국 열량 단위(mmBtu)당 12달러를 초과하고 있음에도 불구하고, 피크 수요에 대응하기 위해 연평균 5.84%의 속도로 확대되고 있습니다. 원자력 발전 용량은 2024년에 57 GW에 달할 전망이며, 현재 건설 중인 원자로 24기와 새로 승인된 11기의 건설을 통해 2035년까지 150 GW, 설비 가동률 90% 이상을 달성하기 위한 기반이 마련되어 있습니다. 석유 및 디젤 발전은 여전히 극히 일부에 그치고 있으며, 고립된 송전망이나 백업 역할로만 제한되어 있습니다.
기타 혜택:
- 엑셀 형식 시장 예측(ME) 시트
- 3개월간의 애널리스트 지원
자주 묻는 질문
목차
제1장 서론
제2장 조사 방법
제3장 주요 요약
제4장 시장 구도
제5장 시장 규모와 성장 예측
제6장 경쟁 구도
제7장 시장 기회와 향후 전망
JHS 26.06.29According to Mordor Intelligence, the china power market size is expected to grow from 3.99 Thousand gigawatt in 2025 to 4.33 Thousand gigawatt in 2026 and is forecast to reach 6.52 Thousand gigawatt by 2031 at 8.51% CAGR over 2026-2031.

This report is Segmented by Power Source (Thermal, Nuclear, and Renewables) and End-User (Utilities, Commercial and Industrial, and Residential). The Market Sizes and Forecasts are Provided in Terms of Installed Capacity (GW).
China Power Market Trends and Insights
Accelerated Grid-Parity Solar Auctions Drive Market Transformation
Mandatory competitive bidding from 2025 replaces feed-in tariffs, compelling developers to price entirely on economics while retaining regional flexibility in auction design. The policy arrives amid manufacturing overcapacity in panels, nudging weaker firms out and encouraging consolidation. Simultaneously, spot-price exposure drives interest in storage-coupled projects that flatten revenue risk, positioning the Chinese power market for deeper merchant activity.
Provincial Renewable Portfolio Standards Enforce Clean-Energy Mandates
Mandatory quotas backed by a fast-growing green-certificate market, 327% trading-volume growth in 2024, tie provincial energy-intensity goals to renewable procurement. Resource-rich western provinces monetize excess generation by selling certificates to demand-heavy coastal hubs, stimulating cross-regional flows and distributed solar uptake.
Stranded-Asset Risks Challenge Coal-Dependent Regions
Accelerated retirement and reduced dispatch hours threaten balance-sheet health for state generators and local economies reliant on coal. Financial scrutiny is rising as lenders factor carbon prices and lower capacity factors into credit terms. Coordinating exit schedules with replacement resources remains critical for winter-heating reliability.
Other drivers and restraints analyzed in the detailed report include:
- Carbon-Neutral Roadmap Accelerates Coal-Plant Retirement Schedules
- Industrial Electrification Expands Beyond Traditional Applications
- Renewable Energy Curtailment Constrains Western Development
For complete list of drivers and restraints, kindly check the Table Of Contents.
Segment Analysis
Renewables held 53.78% of the capacity in 2025, and their share of the China power market size is on track to exceed 65.7% by 2031 as additions compound at a 12.12% CAGR. Solar capacity alone climbed to 842 GW in 2024, following another 300 GW surge, with N-type TOPCon modules outpacing PERC variants in cost-performance metrics. Offshore wind in Jiangsu, Guangdong, and Fujian now hosts 45 GW; 18 MW machines deliver capacity factors above 55%, trimming levelized costs to CNY 0.30 per kWh. Hydro sits near its ecological ceiling of 420 GW, so incremental pumped-storage is the primary growth vector, targeting 100 GW by 2030. Biomass, geothermal, and tidal remain below 50 GW combined due to feedstock and site limits.
Thermal capacity accounts for 39.5% of China's power market share, yet coal still supplies 60% of the country's generation, given higher utilization rates. Natural-gas units now total 130 GW, expanding at a rate of 5.84% annually to meet peaking demand, despite LNG prices exceeding USD 12 per million British thermal units (mmBtu). Nuclear, at 57 GW in 2024, benefits from 24 reactors under construction and 11 new approvals, driving a path toward 150 GW by 2035 with a capacity factor of over 90%. Oil and diesel remain marginal, restricted to islanded grids and backup roles.
List of Companies Covered in this Report:
- State Grid Corporation of China
- China Huaneng Group Co. Ltd.
- China Energy Investment Corp (CHN Energy)
- China Huadian Corporation Ltd.
- China Datang Corporation Ltd.
- State Power Investment Corp (SPIC)
- China Three Gorges Corporation
- China General Nuclear Power Group
- China Southern Power Grid Company
- Shanghai Electric Group Co Ltd
- Xinjiang Goldwind Science & Technology Co Ltd
- Longi Green Energy Technology Co Ltd
- JinkoSolar Holding Co Ltd
- MingYang Smart Energy Group Ltd
- TBEA Co Ltd
- Pinggao Group Co Ltd
- Suntech Power Co Ltd
- Envision Energy Ltd
- China Yangtze Power Co Ltd
- China National Electric Engineering Co Ltd
- Sinovel Wind Group Co Ltd
- Datang International Power Generation Co Ltd
Additional Benefits:
- The market estimate (ME) sheet in Excel format
- 3 months of analyst support
TABLE OF CONTENTS
1 Introduction
- 1.1 Study Assumptions & Market Definition
- 1.2 Scope of the Study
2 Research Methodology
3 Executive Summary
4 Market Landscape
- 4.1 Market Overview
- 4.2 Market Drivers
- 4.2.1 Accelerated Grid-Parity Solar Auctions (China Mainland)
- 4.2.2 Provincial Renewable Portfolio Quota (RPS) Compliance
- 4.2.3 Carbon-Neutral 2060 Roadmap Reshaping Capacity Mix
- 4.2.4 Electrification of Transport & Process Heat Boosting Load
- 4.2.5 Spot Market & Capacity-Payment Pilots Improving ROI
- 4.2.6 Green-Bond-Fuelled Low-Cost Project Finance
- 4.3 Market Restraints
- 4.3.1 Stranded-Asset Risk from Coal Retirements
- 4.3.2 Renewables Curtailment in Remote Provinces
- 4.3.3 Land-Use & Ecological Caps on Mega Hydro/Wind
- 4.3.4 Retail-Tariff Ceilings Limiting Cost Pass-Through
- 4.4 Supply-Chain Analysis
- 4.5 Regulatory Landscape
- 4.6 Technological Outlook
- 4.7 Porter's Five Forces
- 4.7.1 Threat of New Entrants
- 4.7.2 Threat of Substitutes
- 4.7.3 Bargaining Power of Buyers
- 4.7.4 Bargaining Power of Suppliers
- 4.7.5 Competitive Rivalry
- 4.8 PESTLE Analysis
5 Market Size & Growth Forecasts
- 5.1 By Power Source
- 5.1.1 Thermal (Coal, Natural Gas, Oil and Diesel)
- 5.1.2 Nuclear
- 5.1.3 Renewables (Solar, Wind, Hydro, Geothermal, Biomass & Waste, Tidal)
- 5.2 By End User
- 5.2.1 Utilities
- 5.2.2 Commercial and Industrial
- 5.2.3 Residential
- 5.3 By T&D Voltage Level (Qualitative Analysis only)
- 5.3.1 High-Voltage Transmission (Above 230 kV)
- 5.3.2 Sub-Transmission (69 to 161 kV)
- 5.3.3 Medium-Voltage Distribution (13.2 to 34.5 kV)
- 5.3.4 Low-Voltage Distribution (Up to 1 kV)
6 Competitive Landscape
- 6.1 Market Concentration
- 6.2 Strategic Moves (M&A, Partnerships, PPAs)
- 6.3 Market Share Analysis (Market Rank/Share for key companies)
- 6.4 Company Profiles (includes Global level Overview, Market level overview, Core Segments, Financials as available, Strategic Information, Products & Services, and Recent Developments)
- 6.4.1 State Grid Corporation of China
- 6.4.2 China Huaneng Group Co. Ltd.
- 6.4.3 China Energy Investment Corp (CHN Energy)
- 6.4.4 China Huadian Corporation Ltd.
- 6.4.5 China Datang Corporation Ltd.
- 6.4.6 State Power Investment Corp (SPIC)
- 6.4.7 China Three Gorges Corporation
- 6.4.8 China General Nuclear Power Group
- 6.4.9 China Southern Power Grid Company
- 6.4.10 Shanghai Electric Group Co Ltd
- 6.4.11 Xinjiang Goldwind Science & Technology Co Ltd
- 6.4.12 Longi Green Energy Technology Co Ltd
- 6.4.13 JinkoSolar Holding Co Ltd
- 6.4.14 MingYang Smart Energy Group Ltd
- 6.4.15 TBEA Co Ltd
- 6.4.16 Pinggao Group Co Ltd
- 6.4.17 Suntech Power Co Ltd
- 6.4.18 Envision Energy Ltd
- 6.4.19 China Yangtze Power Co Ltd
- 6.4.20 China National Electric Engineering Co Ltd
- 6.4.21 Sinovel Wind Group Co Ltd
- 6.4.22 Datang International Power Generation Co Ltd
7 Market Opportunities & Future Outlook
- 7.1 White-Space & Unmet-Need Assessment
