
|
시장보고서
상품코드
2066400
데이터센터 건설 시장 : 점유율 분석, 업계 동향과 통계, 성장 예측(2026-2031년)Data Center Construction - Market Share Analysis, Industry Trends & Statistics, Growth Forecasts (2026 - 2031) |
||||||
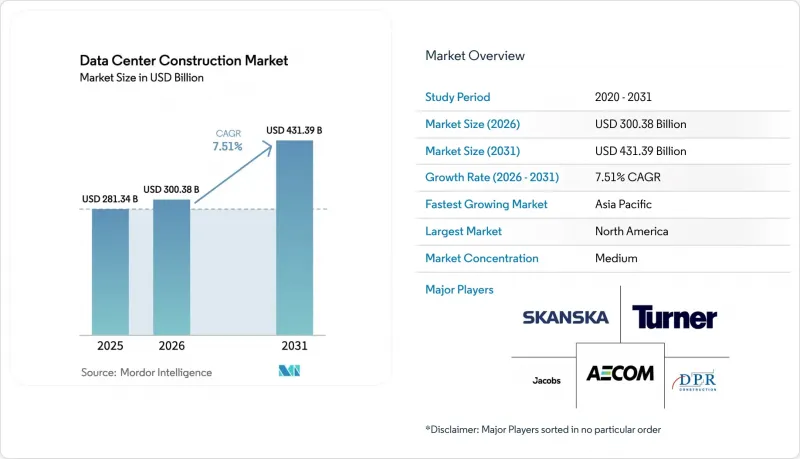
Mordor Intelligence에 의하면, 데이터센터 건설 시장 규모는 2025년 2,813억 4,000만 달러에서 2026년에는 3,003억 8,000만 달러로 확대되어 2026년부터 2031년까지 CAGR 7.51%로 성장을 지속하여, 2031년에는 4,313억 9,000만 달러에 이를 것으로 예측됩니다.

본 보고서는 티어 유형(Tier 1 및 2, Tier 3, Tier 4), 데이터센터 규모(소규모, 중규모, 대규모, 하이퍼스케일), 데이터센터 유형(코로케이션, 하이퍼스케일러/CSP, 엔터프라이즈 및 엣지), 인프라(전기, 기계, 일반 건설, 서비스), 지역(북미, 남미, 유럽, 기타)별로 분류되어 있습니다. 시장 전망은 금액(달러) 기준으로 제시되어 있습니다.
전 세계 데이터센터 건설 시장 동향과 인사이트
송전망의 제약을 피하기 위한 현장형 소형 모듈형 원자로 도입
개발업체들 사이에서는 기가와트 규모의 베이스로드 전력을 경쟁력 있는 일정에 따라 공급할 수 있는 유일한 탄소 제로 대안으로서 소형 모듈형 원자로에 대한 관심이 높아지고 있습니다. 2024년에 체결된 구글과 카이로스 파워 간의 500 MW 계약 덕분에 2030년 이전에 전력을 공급할 수 있게 되어, 7년에 달하는 계통 연계 대기 기간을 피할 수 있습니다. 2025년에는 웨스팅하우스와 Data4가 프랑스 캠퍼스에 AP300 유닛을 설치하는 계획을 추진하여, 송전 손실을 줄이는 동시에 사업자를 변동이 심한 다음 날 전력 시장의 영향으로부터 격리시켰습니다. 연방 정부의 지원도 확대되고 있습니다. 미국 에너지부는 허가 절차의 효율화를 위해 9억 달러를 배정하여, 통상 10년에 달하는 승인 절차의 소요 기간을 단축했습니다. 제약 요인은 연료입니다. 연간 고순도 저농축 우라늄(HALU) 생산 능력은 10기 미만의 상업용 원자로만 공급할 수 있기 때문입니다. 그 결과, 풍부한 자금력과 사내 원자력 팀을 보유한 하이퍼스케일러만이 연료와 원자로를 동시에 조달할 수 있어, 데이터센터 건설 시장에서 우위를 더욱 공고히 하고 있습니다.
확대되는 클라우드 애플리케이션, AI, 빅데이터 워크로드
현재 생성형 AI와 분석 클러스터는 랙당 40kW-100kW의 전력을 필요로 하고 있으며, 이는 기존 열 부하의 4배에 달하는 급격한 증가입니다. 2025년에 발표된 OpenAI의 미시간주 500MW 규모 시설 건설 프로젝트에서는 맞춤형 변전소와 배터리 버퍼를 결합하여 전력망의 변동에 대응하고 있습니다. 마이크로소프트의 800억 달러 규모의 자본 계획 중 60%가 데이터센터 건설에 할당되어 있어, AI 인프라 확보가 전략적 우선 과제임을 여실히 보여주고 있습니다. 대규모 트래픽의 예측 불가능성으로 인해, 통신 사업자들은 2MW 규모의 엣지 포드에서 50MW-200MW 규모의 하이퍼스케일 캠퍼스로 전환하고 있습니다. 이 경우, 예비 여유 용량을 활용하여 지연 시간의 악화를 초래하지 않으면서도 급증하는 추론 처리를 감당할 수 있습니다. 그러나 인력 부족이 우려되고 있습니다. 2025년에는 운영사의 3분의 2가 직접 투 칩(Direct-to-Chip) 및 침지 루프의 시운전을 수행할 수 있는 기술자 채용에 어려움을 겪었습니다. 조기에 냉각 시스템 통합사업자를 확보한 도급업체는 경쟁사보다 최대 1년이나 빨리 시장에 진출할 수 있는 경우가 많으며, 이는 데이터센터 건설 시장에서 결정적인 우위를 점하게 됩니다.
부동산, 설치 및 유지보수 비용의 급등
2023년부터 2025년까지 변압기 납기 기간이 2배로 늘어났고, 구리 가격이 급등하면서 프로젝트 총비용이 15%-25% 상승했습니다. 버지니아주 북부의 토지 가격이 100만-200만 달러까지 치솟자, 개발업자들은 오하이오주와 캐롤라이나주로 눈을 돌리기 시작했습니다. 이 지역들에서는 광섬유 설치 지연이 저렴한 토지 가격의 이점을 상쇄하고 있는 상황입니다. 480V 버스웨이 자격을 보유한 전기 기술자의 연봉은 현재 12만-15만 달러입니다. AI 랙에 필요한 기계 설비의 업그레이드로 인해 kW당 200-400달러의 추가 비용이 발생하여 자본 예산이 늘어나고 있습니다. 인플레이션 이전에 체결된 임대 계약에 묶여 있는 코로케이션 시설 소유주들은 건설 부채 상환에 필요한 25%라는 기준을 밑도는 이익률 하락에 직면해 있습니다.
부문별 분석
2025년에는 Tier 3 시설이 도입 건수의 56.64%를 차지했습니다. 금융 서비스 및 의료 분야의 고객들이 고가용성을 갖춘 운영 시간을 요구하는 가운데, 티어 4 시설 건설은 연평균 성장률(CAGR) 8.12%로 확대되고 있습니다. 2025년 조사에 따르면, 예기치 못한 가동 중단으로 인한 비용은 분당 9,000달러로 추산되며, 이것이 Tier 4의 프리미엄 가격을 정당화하는 근거가 되고 있습니다. 이중 전력 공급원이 필요하기 때문에 적합한 입지는 버지니아주 북부, 프랑크푸르트, 싱가포르 등의 허브 지역으로 한정됩니다. 리모델링 프로젝트에서는 당초 전기 공사만 고려했던 예산에 5,000만-1억 달러가 추가되는 경우가 종종 있습니다. 소규모 공급업체들은 계약상의 허점을 이용해 진정한 내결함성의 부재를 은폐하면서, 여전히 Tier 3 인프라를 판매하고 있습니다.
Tier 4에 대한 관심이 높아지면서 공급망의 역학 관계에 변화가 일어나고 있습니다. 개폐 장치 및 칠러 공급업체들은 내결함성 프로젝트를 위해 즉시 출하 가능한 재고를 우선적으로 확보함으로써 리드 타임을 최대 3개월 단축하고 있습니다. 설계자들은 시운전을 신속하게 진행하기 위해 모듈식 전기실을 지정하는 경향이 강해지고 있는 반면, 소유주들은 Tier 2 사이트를 개조할지, 아니면 완전히 철수할지 검토하고 있습니다.
2025년에는 하이퍼스케일 캠퍼스가 연면적의 58.49%를 차지하며, 연평균 성장률(CAGR) 8.67%로 계속 확대되고 있습니다. 마이크로소프트는 800억 달러 규모의 설비 투자를 계상하고 있으며, 그 대부분은 50MW-200MW 규모의 건설에 투입되고 있습니다. 30MW-50MW 규모의 중규모 프로젝트에서는 리스 계약 진행 상황에 맞추어 자본을 조정하기 위해, 10MW 단위로 전력 공급을 시작하는 ‘셸(골조)’ 형태로 인도되는 사례가 늘고 있습니다.
5MW 미만의 엣지 사이트는 AR/VR 및 트레이딩 워크로드에서 10밀리초 미만의 지연 시간이 필수로 요구되는 도심 근교 지역에서 활발히 확산되고 있습니다. 하이퍼스케일에 따른 조달 수요가 변압기 및 침지 탱크 세계 시장을 주도하고 있어, 지역 프로젝트를 위한 공급이 자주 부족해지는 상황이 발생하고 있습니다. 설비 투자 증가에 직면한 기업들은 On-Premise 인프라를 업그레이드하는 대신 워크로드를 클라우드로 이전하는 것을 선택하는 경우가 점점 더 많아지고 있습니다.
지역별 분석
북미에서는 2025년에 버지니아주, 텍사스주, 오하이오주에서 총 5GW의 용량이 추가되었습니다. 마이크로소프트, 메타, 구글 등 3사는 2027년까지 미국 내 건설을 위해 총 1,500억 달러를 투자하겠다고 약속했습니다. 수력 발전 자원이 풍부한 캐나다의 퀘벡주와 브리티시컬럼비아주는 저탄소 전력을 찾는 하이퍼스케일러 기업들을 끌어들이고 있습니다. 멕시코 몬테레이와 케레타로의 클러스터는 국경을 넘는 광섬유 회선을 통해 확장되고 있지만, 전력망의 신뢰성은 여전히 우려 사항으로 남아 있습니다. 캘리포니아주의 ‘타이틀 24’에서는 PUE 상한선이 1.2로 설정되어 있어, 사실상 공랭식 설계가 금지되어 있습니다.
유럽의 계획은 토지 가격이 1제곱미터당 6,000달러에 달하는 프랑크푸르트, 암스테르담, 런던을 중심으로 전개되고 있습니다. 독일의 ‘재생에너지법’은 개발업체를 대상으로 부지 내 태양광 발전 및 배터리 도입을 장려하고 있습니다. 브렉시트로 인해 데이터 주권이 중요시되면서, 런던과 맨체스터에서는 Tier 4 데이터센터에 대한 수요가 증가하고 있습니다. 프랑스와 스페인은 세제 혜택으로 하이퍼스케일 프로젝트를 유치하고 있지만, 남부 전력망에서는 공급 능력 부족에 직면해 있습니다. 2025년에 시행될 ‘기업 지속가능성 보고 지침’에 따라, 스코프 3 탄소 배출량 공개가 의무화됩니다.
아시아태평양은 가장 빠른 성장세를 보이고 있습니다. 중국의 국영 전력 회사는 AI 칩에 대한 수출 규제가 있음에도 불구하고 2GW 규모의 캠퍼스를 지원하고 있습니다. 인도에서는 데이터 거주 규정을 충족하기 위해 해외 하이퍼스케일 기업들이 현지화를 추진하는 가운데, 두 자릿수의 성장률을 기록하며 시장 규모가 확대되고 있습니다. 싱가포르에서는 토지 부족으로 인해 30 kW 이상의 랙 밀도와 수냉 방식이 표준으로 자리 잡고 있습니다. 한국, 호주, 뉴질랜드는 게임 및 스트리밍용 엣지 노드를 유치하고 있습니다. 일본의 노후화된 송전망으로 인해 계통 연계에 수년 단위의 지연이 발생하고 있으며, 수요가 해외로 이동하고 있습니다.
중동 및 아프리카가 새로운 허브로 부상하고 있습니다. 사우디아라비아의 NEOM은 5,000억 달러 규모의 스마트시티 계획의 일환으로 1 GW 규모의 데이터센터용량을 확보하고 있습니다. 두바이와 아부다비는 대륙 간 콜로케이션을 목적으로 하는 면세 구역과 신속한 허가 절차를 제공합니다. 유럽과 아시아를 연결하는 해저 케이블 덕분에 튀르키예와 이스라엘이 저지연 중계 거점으로 부상하고 있습니다. 남아프리카공화국, 나이지리아, 이집트에서는 5G 구축 및 클라우드 게임과 연계된 엣지 인프라 확충이 진행되고 있습니다.
기타 혜택:
- 엑셀 형식 시장 예측(ME) 시트
- 3개월간의 애널리스트 지원
자주 묻는 질문
목차
제1장 서론
제2장 조사 방법
제3장 주요 요약
제4장 시장 구도
제5장 시장 규모와 성장 예측
제6장 경쟁 구도
제7장 시장 기회와 향후 전망
JHS 26.06.29According to Mordor Intelligence, the data center construction market size is expected to grow from USD 281.34 billion in 2025 to USD 300.38 billion in 2026 and is forecast to reach USD 431.39 billion by 2031 at 7.51% CAGR over 2026-2031.
This report is Segmented by Tier Type (Tier 1 and 2, Tier 3, and Tier 4), Data Center Size (Small, Medium, Large, and Hyperscale), Data Center Type (Colocation, Hyperscalers/CSPs, and Enterprise and Edge), Infrastructure (Electrical, Mechanical, General Construction, and Services), and Geography (North America, South America, Europe, and More). Market Forecasts are Provided in Terms of Value (USD).
Global Data Center Construction Market Trends and Insights
Deployment of On-Site Small Modular Reactors to Bypass Grid Constraints
Developers increasingly view small modular reactors as the only carbon-free option capable of delivering gigawatt-scale baseload within competitive timelines. Google's 500 MW Kairos Power deal signed in 2024 enables delivery before 2030 and circumvents seven-year interconnection queues. In 2025, Westinghouse and Data4 advanced a plan to co-locate AP300 units at French campuses, cutting transmission losses and insulating operators from volatile day-ahead power markets. Federal support is widening; the U.S. Department of Energy earmarked USD 900 million toward streamlined licensing, trimming the typical decade-long approval slog. The constraint is fuel because annual high-assay low-enriched uranium capacity supports fewer than ten commercial reactors. Consequently, only hyperscalers with deep pockets and in-house nuclear teams can underwrite parallel fuel and reactor procurement, reinforcing their edge in the data center construction market.
Growing Cloud Applications, AI and Big Data Workloads
Generative-AI and analytics clusters now demand 40 kW-100 kW per rack, a jump that quadruples traditional thermal loads. OpenAI's 500 MW Michigan build, announced in 2025, pairs custom substations with battery buffers to ride out grid fluctuations. Microsoft's USD 80 billion capital plan channels 60% toward data-center builds, underscoring the strategic priority of owning AI infrastructure. Traffic unpredictability at scale is steering providers away from 2 MW edge pods toward 50 MW-200 MW hyperscale campuses, where spare headroom absorbs inference spikes without latency penalties. Yet talent scarcity looms; two-thirds of operators struggled in 2025 to hire technicians capable of commissioning direct-to-chip and immersion loops. Contractors that secure cooling-system integrators early often beat rivals to market by up to a year, a decisive advantage in the data center construction market.
Escalating Real-Estate, Installation and Maintenance Cost
Transformer lead times doubled and copper prices surged between 2023 and 2025, pushing total project costs up 15%-25%. Northern Virginia acreage climbed to USD 1 million-USD 2 million, redirecting developers to Ohio and the Carolinas where fiber delays offset cheaper land. Electricians qualified for 480-V busways now earn USD 120 000-USD 150 000. Mechanical upgrades required for AI racks add USD 200-USD 400 per kW, inflating capital budgets. Colocation landlords locked into pre-inflation leases face margin compression below the 25% threshold needed to service construction debt.
Other drivers and restraints analyzed in the detailed report include:
- Accelerating Adoption of Hyperscale Facilities
- Emergence of Powered-Land Speculative Campuses Shortening Pre-Lease Timelines
- Utility Take-or-Pay Deposits Locking Up Capital and Deterring Mid-Tier Developers
For complete list of drivers and restraints, kindly check the Table Of Contents.
Segment Analysis
Tier 3 assets commanded 56.64% of installations in 2025. Tier 4 builds are scaling at an 8.12% CAGR as financial-services and healthcare buyers demand fault-tolerant uptime. A 2025 study pegged unplanned-outage costs at USD 9 000 per minute, justifying Tier 4 premiums. Dual utility feeds limit suitable sites to hubs such as Northern Virginia, Frankfurt, and Singapore. Retrofit projects often add USD 50 million to USD 100 million to budgets originally scoped for electrical work alone. Smaller providers continue marketing Tier 3 infrastructure with contractual workarounds that mask the absence of true fault tolerance.
Heightened Tier 4 interest is shifting supply-chain dynamics. Switchgear and chiller vendors prioritize quick-ship inventories for fault-tolerant projects, accelerating lead times by up to three months. Designers increasingly specify modular electrical rooms to speed commissioning, while owners weigh whether to convert Tier 2 sites or exit them entirely.
Hyperscale campuses held 58.49% of floor space in 2025 and are pushing forward at an 8.67% CAGR. Microsoft allocated USD 80 billion for capital expenditures, with the majority aimed at 50 MW-200 MW builds. Medium builds of 30 MW-50 MW are increasingly delivered as shells energized in 10 MW increments to align capital with lease uptake.
Edge sites under 5 MW prosper near city cores where latency under 10 milliseconds is mandatory for AR/VR and trading workloads. Hyperscale procurement drives global pricing for transformers and immersion tanks, frequently squeezing availability for regional projects. Enterprises, facing higher capex, often opt to migrate workloads to the cloud instead of upgrading on-premise footprints.
Geography Analysis
North America added 5 GW of capacity in 2025 across Virginia, Texas, and Ohio. Microsoft, Meta, and Google together committed USD 150 billion toward U.S. builds through 2027. Canada's hydro-rich Quebec and British Columbia attract hyperscalers seeking low-carbon power. Mexico's Monterrey and Queretaro clusters grow on cross-border fiber, though grid reliability remains a concern. California's Title 24 now caps PUE at 1.2, effectively banning air-cooled designs.
Europe's pipeline centers on Frankfurt, Amsterdam, and London where land hits USD 6 000 per m2. Germany's Renewable Energy Sources Act pushes developers toward on-site solar and batteries. Brexit-driven data sovereignty boosts Tier 4 demand in London and Manchester. France and Spain entice hyperscale projects with tax incentives, though southern grids face capacity shortfalls. The Corporate Sustainability Reporting Directive, effective 2025, forces Scope 3 carbon disclosures.
Asia-Pacific posts the fastest growth. Chinese state-owned utilities back 2 GW campuses despite export-control limits on AI chips. India expands at double-digit rates as foreign hyperscalers localize to meet data-residency rules. Singapore's land scarcity drives 30 kW-plus rack densities with liquid cooling standard. South Korea, Australia, and New Zealand attract edge nodes for gaming and streaming. Japan's aging grid imposes multiyear interconnection delays, nudging demand offshore.
The Middle East and Africa emerge as new hubs. Saudi Arabia's NEOM allocates 1 GW data-center capacity within a USD 500 billion smart-city plan. Dubai and Abu Dhabi offer tax-free zones and expedited permits aimed at intercontinental colocation. Submarine cables linking Europe and Asia elevate Turkey and Israel as low-latency transit nodes. South Africa, Nigeria, and Egypt see edge build-outs tied to 5G rollouts and cloud gaming.
- AECOM
- Turner Construction Co.
- DPR Construction
- Jacobs Solutions Inc.
- Skanska AB
- Balfour Beatty plc
- Whiting-Turner Contracting Co.
- Hensel Phelps
- Fortis Construction Inc.
- Goodman Group
- PT Jaya Obayashi
- Hibiya Engineering Ltd.
- Fluor Corporation
- Keppel Data Centres Holding
- NTT Global Data Centers
- Equinix Inc.
- Digital Realty Trust Inc.
- QTS Realty Trust LLC
- China State Construction Engineering Corp.
- Larsen and Toubro Ltd.
- Bouygues Construction SA
- Vinci Energies
- Samsung C and T Corporation
- Collen Construction Ltd.
- Corgan
- Mortenson Construction
Additional Benefits:
- The market estimate (ME) sheet in Excel format
- 3 months of analyst support
TABLE OF CONTENTS
1 INTRODUCTION
- 1.1 Study Assumptions and Market Definition
- 1.2 Scope of the Study
2 RESEARCH METHODOLOGY
3 EXECUTIVE SUMMARY
4 MARKET LANDSCAPE
- 4.1 Market Overview
- 4.2 Market Drivers
- 4.2.1 Growing Cloud Applications, AI and Big Data Workloads
- 4.2.2 Accelerating Adoption of Hyperscale Facilities
- 4.2.3 Rising Edge-Computing Build-Outs Near Population Hubs
- 4.2.4 Renewable-Energy Mandates Shaping Facility Design
- 4.2.5 Deployment of On-Site Small Modular Reactors (SMRs) to Bypass Grid Constraints
- 4.2.6 Emergence of "Powered-Land" Speculative Campuses Shortening Pre-Lease Timelines
- 4.3 Market Restraints
- 4.3.1 Escalating Real-Estate, Installation and Maintenance Cost
- 4.3.2 Stricter Energy-Consumption and Carbon-Compliance Limits
- 4.3.3 Shortage of Skilled Labor for Advanced Liquid Cooling
- 4.3.4 Utility "Take-or-Pay" Deposits Locking Up Capital and Deterring Mid-Tier Developers
- 4.4 Industry Supply-Chain Analysis
- 4.5 Regulatory Landscape
- 4.6 Technological Outlook
- 4.7 Porter's Five Forces Analysis
- 4.7.1 Bargaining Power of Suppliers
- 4.7.2 Bargaining Power of Consumers
- 4.7.3 Threat of New Entrants
- 4.7.4 Threat of Substitutes
- 4.7.5 Intensity of Competitive Rivalry
- 4.8 Key Data Center Statistics
- 4.8.1 Exhaustive Data Center Operators on Regional Level (in MW)
- 4.8.2 List of Major Upcoming Data Center Projects Across Various Regions(2025-2030)
- 4.8.3 CAPEX and OPEX For Data Center Construction
- 4.8.4 Data Center Power Capacity Absorption In MW, Regions, 2023 and 2024
- 4.9 Artificial Intelligence (AI) Inclusion in Data Center Construction Across Various Regions
- 4.10 Regulatory and Compliance Framework
- 4.11 Impact of Macroeconomic Factors on the Market
5 MARKET SIZE AND GROWTH FORECASTS (VALUE)
- 5.1 By Tier Type
- 5.1.1 Tier 1 and 2
- 5.1.2 Tier 3
- 5.1.3 Tier 4
- 5.2 By Data Center Size
- 5.2.1 Small
- 5.2.2 Medium
- 5.2.3 Large
- 5.2.4 Hyperscale
- 5.3 By Data Center Type
- 5.3.1 Colocation Data Center
- 5.3.2 Hyperscalers/Cloud Service Provider (CSPs)
- 5.3.3 Enterprise and Edge Data Center
- 5.4 By Infrastructure
- 5.4.1 Electrical Infrastructure
- 5.4.1.1 Power Distribution Solution
- 5.4.1.2 Power Backup Solutions
- 5.4.2 Mechanical Infrastructure
- 5.4.2.1 Cooling Systems
- 5.4.2.2 Racks and Cabinets
- 5.4.2.3 Servers and Storage
- 5.4.2.4 Other Mechanical Infrastructure
- 5.4.3 General Construction
- 5.4.4 Services - Design and Consulting, Integration, Support and Maintenance
- 5.4.1 Electrical Infrastructure
- 5.5 By Geography
- 5.5.1 North America
- 5.5.1.1 United States
- 5.5.1.2 Canada
- 5.5.1.3 Mexico
- 5.5.2 South America
- 5.5.2.1 Brazil
- 5.5.2.2 Argentina
- 5.5.2.3 Rest of South America
- 5.5.3 Europe
- 5.5.3.1 Germany
- 5.5.3.2 United Kingdom
- 5.5.3.3 France
- 5.5.3.4 Italy
- 5.5.3.5 Spain
- 5.5.3.6 Rest of Europe
- 5.5.4 Asia-Pacific
- 5.5.4.1 China
- 5.5.4.2 Japan
- 5.5.4.3 India
- 5.5.4.4 South Korea
- 5.5.4.5 Australia and New Zealand
- 5.5.4.6 Rest of Asia-Pacific
- 5.5.5 Middle East and Africa
- 5.5.5.1 Middle East
- 5.5.5.1.1 Gulf Cooperation Countries
- 5.5.5.1.2 Turkey
- 5.5.5.1.3 Israel
- 5.5.5.1.4 Rest of Middle East
- 5.5.5.2 Africa
- 5.5.5.2.1 South Africa
- 5.5.5.2.2 Egypt
- 5.5.5.2.3 Nigeria
- 5.5.5.2.4 Rest of Africa
- 5.5.5.1 Middle East
- 5.5.1 North America
6 COMPETITIVE LANDSCAPE
- 6.1 Market Concentration
- 6.2 Strategic Moves
- 6.3 Market Share Analysis
- 6.4 Data Center Infrastructure Investment Based on Megawatt (MW) Capacity, 2024 vs 2030
- 6.5 Data Center Construction Landscape (Key Vendors Listings)
- 6.6 Company Profiles (includes Global Level Overview, Market Level Overview, Core Segments, Financials as Available, Strategic Information, Market Rank/Share for Key Companies, Products and Services, Recent Developments)
- 6.6.1 AECOM
- 6.6.2 Turner Construction Co.
- 6.6.3 DPR Construction
- 6.6.4 Jacobs Solutions Inc.
- 6.6.5 Skanska AB
- 6.6.6 Balfour Beatty plc
- 6.6.7 Whiting-Turner Contracting Co.
- 6.6.8 Hensel Phelps
- 6.6.9 Fortis Construction Inc.
- 6.6.10 Goodman Group
- 6.6.11 PT Jaya Obayashi
- 6.6.12 Hibiya Engineering Ltd.
- 6.6.13 Fluor Corporation
- 6.6.14 Keppel Data Centres Holding
- 6.6.15 NTT Global Data Centers
- 6.6.16 Equinix Inc.
- 6.6.17 Digital Realty Trust Inc.
- 6.6.18 QTS Realty Trust LLC
- 6.6.19 China State Construction Engineering Corp.
- 6.6.20 Larsen and Toubro Ltd.
- 6.6.21 Bouygues Construction SA
- 6.6.22 Vinci Energies
- 6.6.23 Samsung C and T Corporation
- 6.6.24 Collen Construction Ltd.
- 6.6.25 Corgan
- 6.6.26 Mortenson Construction
- 6.7 List of Data Center Construction Companies
7 MARKET OPPORTUNITIES AND FUTURE OUTLOOK
- 7.1 White-Space and Unmet-Need Assessment

