
|
시장보고서
상품코드
2066593
광인터커넥트 시장 : 시장 점유율 분석, 업계 동향 및 통계, 성장 예측(2026-2031년)Optical Interconnect - Market Share Analysis, Industry Trends & Statistics, Growth Forecasts (2026 - 2031) |
||||||
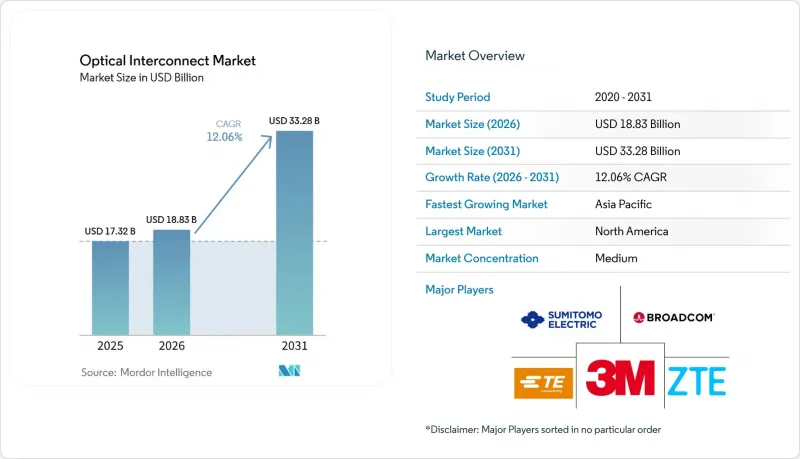
Mordor Intelligence에 의하면, 광인터커넥트 시장 규모는 2025년에 173억 2,000만 달러로 평가되었고, 2026년에 188억 3,000만 달러로 추정되고, 2031년까지 332억 8,000만 달러에 이를 것으로 예측되며, 2026-2031년 CAGR 12.06%로 성장할 전망입니다.

(1)Corning Incorporated, 'AI 지원 데이터센터용 광섬유 연결', corning.com 인공지능 및 고성능 컴퓨팅 워크로드로 인한 대역폭 요구 사항 증가, 구리선에서 포토닉스로의 전환, 그리고 하이퍼스케일러들의 급속한 설비 투자 확대가 이러한 성장 궤도를 뒷받침하고 있습니다. 본 보고서는 제품별(광트랜시버, 케이블 어셈블리 등), 상호 연결 수준별(칩 간, 기판 간/랙 수준 등), 광섬유 모드별(단일 모드 광섬유 및 다중 모드 광섬유), 데이터 전송 속도(40 Gbps 미만, 40-100 Gbps, 기타), 용도(통신 및 데이터 통신), 지역별로 분류되어 있습니다.
세계의 광인터커넥트 시장 동향 및 인사이트
통신 대역폭에 대한 수요 증가
생성형 AI 클러스터에는 기존 클라우드 서비스에 비해 10-100배의 광섬유가 필요하며, 이로 인해 기존의 구리선 상호 연결은 물리적 한계에 다다르고 있어 포토닉스로의 전환이 가속화되고 있습니다. Meta의 내부 아키텍처에서는 이미 랙 경계에서 구리선의 도달 거리에 제약이 나타나고 있어, 스케일아웃 도메인에서 초당 수백 테라비트를 지원하는 광 토폴로지에 대한 투자가 진행되고 있습니다. 고속 이더넷 포트의 출하 대수는 2023년 7,000만 대에서 2026년에는 2억 4,000만 대 이상으로 증가할 것으로 예상되며, 이는 1.6T 인터페이스의 보급 확대를 반영한 것입니다. 최신 GPU 클러스터에서는 동서 방향 대역폭으로 200 Tbps가 규정되어 있으며, 이는 패브릭 링크당 3,000개 이상의 광섬유를 도입해야 함을 의미합니다. 이러한 규모는 고밀도 포토닉 집적 기술을 제공하는 업체에 직접적인 이익을 가져다줍니다. 이러한 지속적인 트래픽 증가 추세는 서버, 스위치 및 장거리 DCI 환경의 광 인터커넥트 부품에 대한 수년에 걸친 수주를 뒷받침하고 있습니다.
데이터센터 간 상호연결에 대한 투자 확대
마이크로소프트만 해도 분산형 클라우드 백본을 강화하기 위해 80억 달러가 넘는 신규 다크 파이버 계약을 체결했습니다. Dell'Oro는 AI 백엔드 네트워크 시장 규모가 2028년까지 200억 달러를 넘어설 것으로 전망하고 있으며, 이는 향후 10년 동안 광 인터커넥트 시장 수요가 일반 서버 지출을 상회할 것임을 시사합니다. 각 하이퍼스케일러 기업들은 현재 독자적인 해저 케이블 건설에 자금을 투입하고 있으며, 2029년까지 해저 케이블에 대한 투자액은 98억 달러에 달할 것으로 예측됩니다. 이러한 움직임에 따라, 코히런트 전송 시스템의 잠재적 시장 규모는 더욱 확대될 것입니다. 지역 교환 지점의 트래픽 증가율은 5년 이내에 6배로 늘어날 것으로 예상되며, 광 인터커넥트 시장은 DCI 및 백본 업그레이드와 같은 안정적인 수요 흐름의 혜택을 받고 있습니다. 각 통신 사업자들이 이미 설치된 광섬유에서 비트당 비용을 극대화하려는 가운데, 800G 및 1.6T 광모듈을 제공할 수 있는 공급업체는 매우 큰 시장 점유율을 확보할 것으로 전망됩니다.
차세대 기술의 상용화 지연
코패키지드 옵틱스는 연구 개발이 눈에 띄게 진전되고 있음에도 불구하고, OIF(Optical Internetworking Forum)를 통한 신뢰성 시험 및 표준화에 예상보다 많은 시간이 소요되고 있어, 본격적인 보급까지는 아직 수년이 더 걸릴 것으로 보입니다. 테라비트급 속도에서 발생하는 열적 제약으로 인해, 엄격한 인증 기준을 충족하는 새로운 패키지 소재와 히트 스프레더가 필요해지면서 시스템 OEM 제조업체의 설계 주기가 길어지고 있습니다. 박막 리튬니오브산 포토닉스는 유망하지만, 여전히 취성 및 수율 문제라는 과제에 직면해 있어, 중국의 소수 시범 공장을 제외한 곳에서는 대량 공급이 지연되고 있습니다. 이러한 상용화 지연은 미래 전망에 대비하는 것과 이미 입증된 신뢰성 사이에서 균형을 맞추어야 하는 통신 사업자들에게 계획상의 위험을 초래하며, 광 인터커넥트 시장에서 최첨단 솔루션의 단기 도입률을 억제하고 있습니다.
부문별 분석
브로드컴에 따르면, 제품별 매출 기준 광 인터커넥트 시장 규모는 트랜시버가 주를 이루었으며, 2025년에는 매출의 36.40%를 차지했습니다. 그러나 ASIC 설계자들이 스위치 섀시 내의 코패키지드 옵틱스 검증을 진행함에 따라, 임베디드형 광 모듈은 연평균 성장률(CAGR) 22.1%로 가장 빠르게 성장하고 있습니다. 기존의 액티브 광케이블은 플러그 앤 플레이 방식의 도입에서 여전히 인기를 끌고 있지만, 통신 사업자들이 더 긴 전송 거리를 지원할 수 있는 분리형 광모듈을 선호하는 경향이 있어 그 성장세는 완만해지고 있습니다. 케이블 어셈블리와 커넥터는 광섬유 시장 전체의 성장과 연동되어 있으며, 집적 포토닉스와 같은 급격한 비용 곡선 없이 안정적인 판매량을 유지하고 있습니다. 브로드컴의 51.2 Tbps CPO 플랫폼은 플러그인형에 비해 에너지 손실이 70% 감소했으며, 이것이 임베디드형 모듈이 계속해서 시장 점유율을 확대하고 있는 이유를 보여줍니다. 인텔의 광 I/O 칩렛은 5 pJ/bit로 4 Tbps의 양방향 처리량을 실현하고 있으며, 이러한 획기적인 전력 효율의 발전으로 인해 패키징 수율이 안정화되면 임베디드 설계가 당연한 후속 기술이 될 것임을 시사하고 있습니다(intel.com). OpenLight 및 Jabil과 같은 제조 제휴사들은 집적 부품 시장 출시 기간을 단축하고 있으며, 이는 광 상호 연결 시장에서 임베디드 광 기술로의 전환이 더욱 광범위하게 진행되고 있음을 보여줍니다.
중기적인 전망에 따르면, 임베디드형 모듈이 플러그인형의 일부 시장을 잠식하는 한편, 열 설계 예산의 제약으로 인해 기존의 폼 팩터를 채택할 수 없는 분야에서 새로운 시장을 개척할 것으로 예측됩니다. 많은 하이퍼스케일러들은 업계 전반의 상호운용성이 성숙해질 때까지 임베디드형과 플러그인형을 병행하여 계속 조달할 것입니다. 이로 인해 성장의 축이 바뀌더라도 무전기 부문의 수익은 유지될 것입니다. 한편, CPO의 다양한 제품군은 1.6T 및 3.2T 패브릭 스위치 로드맵의 핵심을 차지하고 있어, 백플레인용 광 모듈에 상당한 규모의 파이프라인을 보장하고 있습니다. 임베디드 모듈은 전면 패널의 고밀도화에 대한 부담을 줄여주므로, 랙 설계자는 섀시의 깊이를 줄이거나 가속기를 추가하는等方式으로 전반적인 연산 밀도를 향상시킬 수 있습니다. 이러한 제품 카테고리 간의 상호작용은 광 인터커넥트 시장을 역동적으로 유지하며, 하이퍼스케일러로부터 설계 수주를 목표로 하는 벤더에게 폭넓은 제품 포트폴리오가 필수적인 이유를 여실히 보여주고 있습니다.
2025년에는 보드 간 및 랙 수준의 링크가 광 인터커넥트 시장 점유율의 44.20%를 차지한 것으로 평가되었으며, 이는 오늘날의 모듈식 서버 설계를 반영한 것입니다. 실리콘 포토닉스를 통해 PCB 트레이스를 우회하는 온패키지 광 레인이 구현됨에 따라, 칩 간 링크의 연평균 성장률(CAGR)은 26.9%를 나타낼 것으로 전망됩니다. 메트로 및 장거리 DCI 솔루션은 여전히 필수적이지만, 도입 주기의 장기화와 규제상의 장벽으로 인해 성장 속도는 다소 둔화되고 있습니다. 기술적 요건도 다릅니다. 칩 간 광통신은 서브나노초 수준의 지연 시간과 테라비트당 와트 효율을 목표로 하는 반면, DCI 장비는 스펙트럼 효율과 증폭기 캐스케이드를 최적화하고 있습니다.
Marvell이 OFC 2025에서 시연한 광전송 방식의 PCIe Gen 6는 10m 길이의 광섬유를 통해 64GT/s의 트래픽을 전송하며, CPU와 GPU를 분리된 형태로 구성하는 디스어그리게이트형 컴퓨팅 랙을 구현합니다. Ayar Labs의 자금 조달 라운드는 기존의 메모리 및 캐시 계층 구조를 타파할 수 있는 모놀리식 광 I/O에 대한 높은 신뢰도를 입증하고 있습니다. 코패키지드 옵틱스가 프로토타입 단계에서 양산 스위치 단계로 전환됨에 따라, 기판 설계자들은 레이저 광원을 ASIC 근처에 배치하게 되었으며, 이를 통해 삽입 손실이 감소하고 플러그인 방식의 페이스플레이트의 열 밀도도 낮아집니다. 그러나 서비스 제공업체는 하위 호환성을 확보하기 위해 여전히 랙 수준의 링크가 필요하며, 기존 스파인-리프 토폴로지에서 차세대 패브릭으로의 전환을 연결하는 역할을 수행하고 있습니다. 이러한 복합적인 수요 동향은 광 인터커넥트 시장의 모든 인터커넥트 수준에서 점진적인 매출 증가를 뒷받침하고 있습니다.
지역별 분석
북미는 하이퍼스케일러의 집중과 인텔(Intel) 등 기업들의 수십 년에 걸친 실리콘 포토닉스 연구 프로그램 덕분에 2025년에는 33.60%의 점유율을 차지하며 광 인터커넥트 시장을 주도했습니다. 마이크로소프트가 Lumen과 체결한 수십억 달러 규모의 다크 파이버 계약에서 볼 수 있듯이, 독자적인 광섬유 자산에 대한 설비 투자는 여전히 견조하며, 이는 고속 광통신 장비에 대한 단기 수요의 하한선이 견고함을 뒷받침하고 있습니다. AMD의 Enosemi 인수나 노키아의 Infinera에 대한 23억 달러 규모의 인수 등, 해당 지역 내의 합병 및 인수 활동을 통해 미국에 본사를 둔 기업들은 설계 인력과 지적 재산권을 모두 확보하게 되었습니다. 첨단 패키징 및 ‘CHIPS법’에 기반한 포토닉스 보조금에 대한 연방 정부의 지속적인 투자는 특히 인듐 인화물 웨이퍼 및 이종 집적 분야에서 북미 제조업의 회복력을 한층 더 강화하고 있습니다.
아시아태평양은 중국의 국가 포토닉스 전략, 대만의 파운드리 활용, 그리고 엔드투엔드 공급망에 대한 지역 투자의 견인 덕분에 연평균 성장률(CAGR) 13.05%를 기록하며 가장 빠르게 성장하고 있는 지역입니다. TSMC가 주관하는 실리콘 포토닉스 산업 연합에는 30개 이상의 기업이 참여하고 있으며, 표준화된 공정 설계 키트를 제공함으로써 제조 진입 장벽을 낮추고 신규 진출기업의 학습 곡선을 단축하고 있습니다. 중국의 CHIPX 시범 생산 라인에서는 6인치 웨이퍼 위에 리튬니오브산 박막을 제조하고 있으며, 이를 통해 중국 기업들은 차세대 변조기 분야에서 선도적 우위를 확보하고 있습니다. 각 지역 정부는 상업용 워크로드와 국가 연구 모두에 활용되는 AI 컴퓨팅 클러스터에 보조금을 지급하고 있으며, 이를 통해 예측 기간 동안 테라비트급 광통신 장비에 대한 지속적인 수요가 확보되고 있습니다. 대만의 팹과 미국의 클라우드 제공업체 간의 협력은 지역 간 경계를 더욱 모호하게 만들고 있지만, 궁극적으로는 광 인터커넥트 시장에서 아시아태평양의 총 수요를 끌어올리는 결과를 가져올 것입니다.
2024년까지 유럽의 광학 부품 생산 세계 시장 점유율은 8% 미만으로 떨어졌습니다. 이에 따라 유럽집행위원회는 국내 생산 능력 활성화를 목적으로 한 ‘포토닉스 칩 법’을 제안했습니다. 유럽의 포토닉스 기업들은 2024년에 총 120억 유로 이상을 연구개발에 투자했으나, 북미 및 아시아태평양과 비교했을 때 상용화 측면에서의 격차는 여전히 남아 있습니다. ‘Photonics21’의 활동과 독일 및 프랑스의 국가 프로그램에서는 2027년까지 시범 생산 라인의 수를 두 배로 늘리겠다는 목표를 제시하고 있습니다. 기업 동향으로는 ‘Prysmian’이 Channell Commercial Corporation을 9억 5,000만 달러에 인수함에 따라, 해당 그룹은 북미 및 중동의 데이터센터 프로젝트에서 광섬유 연결 사업 기반을 확대하고 있으며, 이는 현실적인 세계화 전략을 반영한 것입니다. 해당 지역은 여전히 기술력을 보유하고 있지만, 광 인터커넥트 시장의 성장은 혁신을 양산 제품으로 확대하기 위한 협력적인 자금 조달과 보다 신속한 기술 이전 체계에 달려 있습니다.
기타 혜택 :
- 엑셀 형식 시장 예측(ME) 시트
- 3개월간의 애널리스트 지원
자주 묻는 질문
목차
제1장 서론
제2장 조사 방법
제3장 주요 요약
제4장 시장 구도
제5장 시장 규모 및 성장 예측
제6장 경쟁 구도
제7장 시장 기회 및 향후 전망
AJY 26.06.30According to Mordor Intelligence, the optical interconnect market size is projected to be USD 17.32 billion in 2025, USD 18.83 billion in 2026, and reach USD 33.28 billion by 2031, growing at a CAGR of 12.06% from 2026 to 2031.
[1] Corning Incorporated, "Fiber Connectivity for AI-Ready Data Centers," corning.com Rising bandwidth requirements from artificial intelligence and high-performance computing workloads, the migration from copper to photonics, and rapidly expanding hyperscaler capital expenditure underpin this growth trajectory. This report is Segmented by Product (Optical Transceivers, Cable Assemblies, and More), Interconnect Level (Chip-To-Chip, Board-To-Board / Rack-Level, and More), Fiber Mode (Single-Mode Fiber and Multi-Mode Fiber), Data-Rate ( Less Than 40 Gbps, 40-100 Gbps, and More), Application (Telecommunication and Data Communication), and Geography.
Global Optical Interconnect Market Trends and Insights
Increasing Demand for Communication Bandwidth
Generative AI clusters require 10-100 times more fiber than traditional cloud services, pushing existing copper interconnects past their physical limits and forcing an accelerated transition to photonics. Meta's internal architectures already show copper reach constraints at the rack boundary, guiding investment toward optical topologies that support hundreds of terabits per second in scale-out domains. High-speed Ethernet port shipments are projected to climb from 70 million in 2023 to more than 240 million in 2026, mirroring the ramp of 1.6 T interfaces. Modern GPU clusters now specify 200 Tbps of east-west bandwidth, translating into installations that exceed 3,000 fibers per fabric link, a scale that directly benefits vendors of dense photonic integration. This persistent traffic curve underpins multi-year orders for optical interconnect components across servers, switches, and long-haul DCI footprints.
Rising Data-Center Interconnect Investments
Microsoft alone has secured more than USD 8 billion in new dark-fiber contracts to reinforce its distributed cloud backbone. Dell'Oro projects AI back-end networks surpassing USD 20 billion by 2028, implying that optical interconnect market demand will outpace general server spending through the decade. Hyperscalers are now funding their own submarine cables, raising subsea investment to USD 9.8 billion by 2029, a move that further widens the addressable base for coherent transport systems. With traffic growth at regional exchange points expected to multiply sixfold within five years, the optical interconnect market benefits from a stable pipeline of DCI and backbone upgrades. Vendors equipped to deliver 800 G and 1.6 T optics stand to capture outsized share as operators seek to maximize cost-per-bit on each installed fiber.
Slow Commercialization of Next-Generation Technologies
Co-packaged optics remains several years away from mass adoption despite visible R&D momentum, as reliability testing and standardization through the Optical Internetworking Forum take longer than anticipated. Thermal constraints at terabit speeds require new packaging materials and heat spreaders that pass strict qualification regimes, extending design cycles for system OEMs. Thin-film lithium-niobate photonics, though promising, still faces brittleness and yield challenges, delaying the high-volume availability of the material outside a few pilot fabs in China. These commercialization lags introduce planning risk for operators that must balance future-proofing with proven reliability, tempering near-term adoption rates for bleeding-edge solutions in the optical interconnect market.
Other drivers and restraints analyzed in the detailed report include:
- Rapid 400 G/800 G Migration
- Commercial Silicon-Photonics Adoption
- High Capital Expenditure Requirements
For complete list of drivers and restraints, kindly check the Table Of Contents.
Segment Analysis
The optical interconnect market size for product-level sales centers on transceivers, which held a 36.40% revenue position in 2025, according to Broadcom. Embedded optical modules, however, are growing fastest at a 22.1% CAGR as ASIC designers validate co-packaged optics inside switch chassis. Traditional active optical cables remain popular for plug-and-play deployments, but their growth moderates as operators favor separate optics that scale to longer reaches. Cable assemblies and connectors track overall fiber growth, providing steady volume without the steep cost curves of integrated photonics. Broadcom's 51.2 Tbps CPO platform shows 70% lower energy dissipation than pluggables, illustrating why embedded modules will keep gaining share. Intel's optical I/O chiplet delivers 4 Tbps bidirectional throughput at 5 pJ/bit, a power milestone that positions embedded designs as the logical successor once packaging yields mature intel.com. Manufacturing alliances such as OpenLight and Jabil shorten time-to-market for integrated parts, signaling a broader pivot toward embedded optics inside the optical interconnect market.
The medium-term outlook suggests that embedded modules will cannibalize a portion of pluggables but also open new sockets where thermal budgets forbid traditional form factors. Many hyperscalers will dual-source embedded and pluggable parts until industry-wide interoperability matures, preserving transceiver revenue even as growth shifts. Meanwhile, CPO variants sit at the center of switch roadmaps for 1.6 T and 3.2 T fabrics, guaranteeing a sizable pipeline for backplane optics. Because embedded modules reduce front-panel density pressures, rack architects can shrink chassis depth or add accelerators, improving overall compute density. The interplay among these product categories keeps the optical interconnect market dynamic and underscores why broad portfolios are critical for vendors courting hyperscaler design wins.
Board-to-board and rack-level links accounted for 44.20% of optical interconnect market share in 2025, reflecting today's modular server designs. Silicon photonics now enables on-package optical lanes that bypass PCB traces, driving chip-to-chip links to a 26.9% CAGR outlook. Metro and long-haul DCI solutions remain essential yet grow at a steadier clip because of longer deployment cycles and regulatory hurdles. The technology needs differ: chip-to-chip optics target sub-nanosecond latency and watt-per-terabit efficiencies, whereas DCI equipment optimizes spectral efficiency and amplifier cascades.
PCIe Gen 6 over optics, demonstrated by Marvell at OFC 2025, sends 64 GT/s traffic across 10 m fibers, enabling disaggregated compute racks that decouple CPUs and GPUs. Ayar Labs' funding round underscores confidence in monolithic optical I/O that can break traditional memory and cache hierarchies. As co-packaged optics migrates from prototypes to volume switches, board designers will place laser sources near ASICs, lowering insertion loss and reducing pluggable face-plate thermal density. However, service providers still require rack-level links for backwards compatibility, bridging the transition from legacy spine-leaf topologies to next-generation fabrics. This hybrid demand profile supports incremental revenue across all interconnect levels in the optical interconnect market.
Geography Analysis
North America led the optical interconnect market with a 33.60% share in 2025 thanks to hyperscaler concentration and decades-long silicon-photonics research programs by firms such as Intel. Capital spending on proprietary fiber assets remains robust, seen in Microsoft's multibillion-dollar dark-fiber contracts with Lumen, underlining a strong near-term demand floor for high-speed optics. Regional merger activity, including AMD's acquisition of Enosemi and Nokia's USD 2.3 billion purchase of Infinera, adds both design talent and intellectual property to domestically headquartered firms. Continued Federal investment in advanced packaging and CHIPS Act photonics grants further strengthens North American manufacturing resilience, particularly for indium-phosphide wafers and heterogeneous integration.
Asia Pacific is the fastest-growing region at a 13.05% CAGR, driven by China's national photonics strategy, Taiwan's foundry leverage, and regional investments in end-to-end supply chains. The Silicon Photonics Industry Alliance organized by TSMC includes over 30 companies and offers unified process design kits, lowering fabrication barriers and shortening learning curves for new entrants. China's CHIPX pilot lines manufacture thin-film lithium-niobate on 6-inch wafers, giving domestic players a head start in next-generation modulators. Regional governments subsidize AI computing clusters that serve both commercial workloads and national research, ensuring sustained demand for terabit-scale optics over the forecast window. Collaboration between Taiwanese fabs and US cloud providers further blurs regional boundaries but ultimately inflates aggregate Asia-Pacific volumes in the optical interconnect market.
Europe's optical production slipped below 8% of global share by 2024, prompting the European Commission to propose a Photonics Chips Act aimed at revitalizing domestic capacity. European photonics firms collectively spent more than EUR 12 billion on R&D in 2024, yet commercialization gaps persist relative to North America and Asia Pacific. Initiatives from Photonics21 and national programs in Germany and France pledge to double the number of pilot lines by 2027. On the corporate front, Prysmian's USD 950 million acquisition of Channell Commercial Corporation expands the group's fiber-connectivity footprint in North American and Middle-East data-center projects, reflecting a pragmatic globalization strategy. While the region remains technologically capable, its optical interconnect market growth depends on coordinated funding and faster technology-transfer pipelines to scale innovations into volume products.
- 3M Company
- Amphenol Corporation
- Broadcom Inc.
- Ciena Corporation
- Cisco Systems Inc.
- Coherent Corp. (formerly II-VI)
- CommScope Holding Co.
- Corning Incorporated
- FIT Hon Teng (Molex) Ltd.
- Go!Foton Inc.
- Huawei Technologies Co. Ltd.
- Infinera Corporation
- Intel Corporation
- Lumentum Holdings Inc.
- NVIDIA Corporation
- Samtec Inc.
- Sumitomo Electric Industries Ltd.
- TE Connectivity Ltd.
- ZTE Corporation
- Others (additional niche photonic start-ups)
Additional Benefits:
- The market estimate (ME) sheet in Excel format
- 3 months of analyst support
TABLE OF CONTENTS
1 INTRODUCTION
- 1.1 Study Assumptions and Market Definition
- 1.2 Scope of the Study
2 RESEARCH METHODOLOGY
3 EXECUTIVE SUMMARY
4 MARKET LANDSCAPE
- 4.1 Market Overview
- 4.2 Market Drivers
- 4.2.1 Increasing demand for communication bandwidth (cloud, AI, HPC)
- 4.2.2 Rising investments in data-center interconnect (DCI) build-outs
- 4.2.3 Rapid 400G/800G migration across hyperscale data centres
- 4.2.4 Commercial adoption of silicon-photonics transceivers
- 4.2.5 Shift toward co-packaged optics (CPO) for switch ASICs
- 4.2.6 Emergence of thin-film lithium-niobate (LNOI) photonics for long-reach links
- 4.3 Market Restraints
- 4.3.1 Slow commercialisation of next-gen optical interconnect tech
- 4.3.2 High capex for 800G/1.6T optics and advanced packaging
- 4.3.3 Thermal-management challenges in CPO and integrated photonics
- 4.3.4 Indium-phosphide wafer and packaging supply bottlenecks
- 4.4 Value / Supply-Chain Analysis
- 4.5 Regulatory Landscape
- 4.6 Technological Outlook
- 4.7 Porter'ss Five Forces
- 4.7.1 Threat of New Entrants
- 4.7.2 Bargaining Power of Buyers/Consumers
- 4.7.3 Bargaining Power of Suppliers
- 4.7.4 Threat of Substitute Products
- 4.7.5 Intensity of Competitive Rivalry
5 MARKET SIZE AND GROWTH FORECASTS (VALUE)
- 5.1 By Product
- 5.1.1 Optical Transceivers
- 5.1.2 Active Optical Cables (AOC)
- 5.1.3 Embedded Optical Modules (EOM)
- 5.1.4 Cable Assemblies
- 5.1.5 Optical Connectors
- 5.2 By Interconnect Level
- 5.2.1 Chip-to-Chip
- 5.2.2 Board-to-Board / Rack-Level
- 5.2.3 Metro and Long-Haul DCI
- 5.3 By Fiber Mode
- 5.3.1 Single-Mode Fiber
- 5.3.2 Multi-Mode Fiber
- 5.4 By Data-Rate
- 5.4.1 less than 40 Gbps
- 5.4.2 40-100 Gbps
- 5.4.3 100-400 Gbps
- 5.4.4 above 400 Gbps
- 5.5 By Application
- 5.5.1 Telecommunication
- 5.5.2 Data Communication
- 5.6 By Geography
- 5.6.1 North America
- 5.6.1.1 United States
- 5.6.1.2 Canada
- 5.6.1.3 Mexico
- 5.6.2 South America
- 5.6.2.1 Brazil
- 5.6.2.2 Argentina
- 5.6.2.3 Rest of South America
- 5.6.3 Europe
- 5.6.3.1 Germany
- 5.6.3.2 United Kingdom
- 5.6.3.3 France
- 5.6.3.4 Rest of Europe
- 5.6.4 Asia Pacific
- 5.6.4.1 China
- 5.6.4.2 India
- 5.6.4.3 Japan
- 5.6.4.4 South Korea
- 5.6.4.5 ASEAN
- 5.6.4.6 Rest of Asia Pacific
- 5.6.5 Middle East
- 5.6.5.1 Saudi Arabia
- 5.6.5.2 UAE
- 5.6.5.3 Turkey
- 5.6.5.4 Rest of Middle East
- 5.6.6 Africa
- 5.6.6.1 South Africa
- 5.6.6.2 Rest of Africa
- 5.6.1 North America
6 COMPETITIVE LANDSCAPE
- 6.1 Market Concentration
- 6.2 Strategic Moves
- 6.3 Market Share Analysis
- 6.4 Company Profiles (includes Global level Overview, Market level overview, Core Segments, Financials, Strategic Information, Market Rank/Share, Products and Services, Recent Developments)
- 6.4.1 3M Company
- 6.4.2 Amphenol Corporation
- 6.4.3 Broadcom Inc.
- 6.4.4 Ciena Corporation
- 6.4.5 Cisco Systems Inc.
- 6.4.6 Coherent Corp. (formerly II-VI)
- 6.4.7 CommScope Holding Co.
- 6.4.8 Corning Incorporated
- 6.4.9 FIT Hon Teng (Molex) Ltd.
- 6.4.10 Go!Foton Inc.
- 6.4.11 Huawei Technologies Co. Ltd.
- 6.4.12 Infinera Corporation
- 6.4.13 Intel Corporation
- 6.4.14 Lumentum Holdings Inc.
- 6.4.15 NVIDIA Corporation
- 6.4.16 Samtec Inc.
- 6.4.17 Sumitomo Electric Industries Ltd.
- 6.4.18 TE Connectivity Ltd.
- 6.4.19 ZTE Corporation
- 6.4.20 Others (additional niche photonic start-ups)
7 MARKET OPPORTUNITIES AND FUTURE OUTLOOK
- 7.1 White-space and Unmet-need Assessment
