
|
시장보고서
상품코드
2066631
오프그리드 태양에너지 : 시장 점유율 분석, 업계 동향 및 통계, 성장 예측(2026-2031년)Off-Grid Solar Energy - Market Share Analysis, Industry Trends & Statistics, Growth Forecasts (2026 - 2031) |
||||||
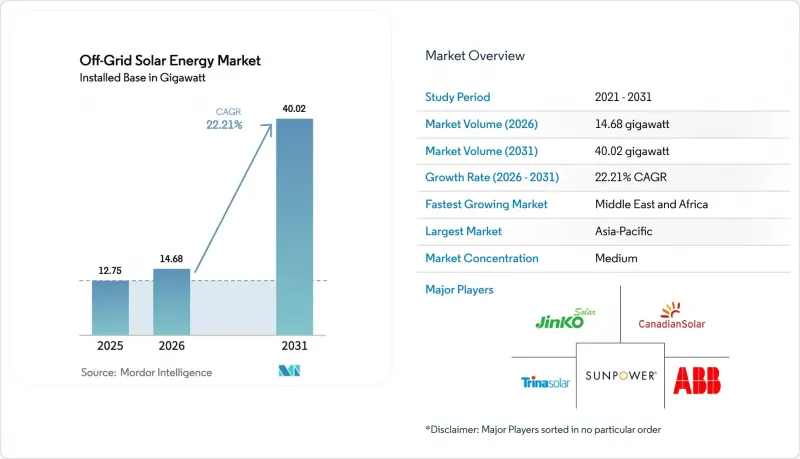
Mordor Intelligence에 의하면, 오프그리드 태양에너지 시장 규모(설치용량 기반)는 2025년 12.75기가와트로 평가되었습니다. 2026년에는 14.68기가와트로 확대되어 2026년부터 2031년에 걸쳐 CAGR 22.21%로 성장을 지속하여, 2031년에는 40.02기가와트에 이를 것으로 예측됩니다.
본 보고서는 기술별(태양광 발전 및 집광형 태양광 발전), 최종 사용자별(대규모 발전, 상업 및 산업용, 주거용), 지역별(북미, 유럽, 아시아태평양, 남미, 중동 및 아프리카)로 분류되어 있습니다. 시장 규모 및 전망은 설치 용량(GW) 기준으로 표시되어 있습니다.
세계의 오프그리드 태양에너지 시장 동향 및 인사이트
태양광 발전 모듈의 가격 하락과 효율 향상
2026년 상반기, 폴리실리콘공급 과잉으로 인해 중국의 FOB 모듈 가격은 1와트당 0.12달러 전후로 형성되었으나, 9%의 수출 부가가치세 환급이 종료되면서 비용은 안정되었고, 은 가격의 급등으로 인해 태양전지 셀의 원자재 비용이 3-4% 상승했습니다. 탠덤 기술의 혁신 덕분에 이러한 역풍은 일부 상쇄되고 있습니다. Oxford PV는 2024년 5월에 효율 27.3%의 모듈 생산을 시작했으며, 2029년까지 7.5GW의 생산 능력을 목표로 하고 있습니다. 한편, LONGi는 2024년 4월 실험실에서 33.9%의 최고 효율을 달성했습니다. 효율 26% 이상의 상용 모듈은 2027년까지 오프그리드 태양에너지 시장에 진출하여 시스템 전체 비용을 최대 20%까지 절감할 가능성이 있습니다. LONGi의 ‘Hi-MO 9’와 같은 양면 수광형 모듈은 이미 알베도가 높은 설치지에서 5-30%의 추가 발전량을 확보하고 있으며, 박막 카드뮴텔루르계 태양전지는 텔루르 공급 부족으로 인해 세계 생산량이 10GW 미만에 그치고 있어, 여전히 틈새 시장 수준에 머물러 있습니다. 그러나 페로브스카이트 태양전지의 내구성과 납 함유량에 관한 과제는 아직 해결되지 않았으며, IEC 61215 규격의 개정에 따라 인증 취득에 12-18개월의 지연이 발생할 가능성이 있습니다.
높아지는 농촌 전기화 목표
‘미션 300’은 나이지리아의 DARES 프로그램만으로도 18억 5,000만 달러를 조달하여, 1,350개의 미니 그리드를 통합해 1,750만 명에게 전력을 공급하고 있습니다. 인도의 PM-KUSUM은 30.8 GW라는 목표를 설정했으나, 2024년 2.8 GW에 그치고 있습니다. 이는 신용도가 낮은 주에서 농가들이 부담해야 하는 본인 부담금이 40-50%에 달하고, 도입이 지체되었기 때문입니다. 국제태양에너지연합(ISA)의 추산에 따르면, 전기 공급을 받지 못하는 3억 9,600만 명 중 59%는 미니 그리드를 통한 전력 공급이 더 적합하며, 자금 조달 격차는 현재 자본 유입액의 49배에 달할 전망입니다. 인도네시아의 전기 공급이 되지 않는 2,500개 마을은 ‘라스트 마일’의 위험성을 여실히 보여주고 있습니다. PLN(인도네시아 전력공사)가 kWh당 0.15달러로 설정한 요금 상한선으로 인해 내부수익률(IRR)이 8% 미만으로 떨어지게 되어, 정부의 지원이 없는 민간 입찰자들을 멀어지게 하고 있습니다.
대규모 시스템에 필요한 막대한 초기 설비 투자(CAPEX)
통신 하이브리드 시스템에는 2만-6만 달러가 필요하지만, 나이지리아의 통신탑의 경우, 리스크 보증을 통해 금리가 300-400 베이시스 포인트 인하되지 않는 한, 현지 통화 표시 부채의 금리가 여전히 12%를 초과하는 상황입니다. 인도에서는 PM-KUSUM 구성 요소 A에 따라 농가들의 40-50%가 공동 출자해야 합니다. 신용 보급률이 30% 미만인 주에서는 비공식적으로 18-24%의 금리를 적용하는 대출에 의존할 수밖에 없으며, 이로 인해 프로젝트의 내부수익률(IRR)이 낮아지고 있습니다. 나이지리아 전역의 미니 그리드 개발업체들은 2025년 초 기준으로 16억 달러 규모의 프로젝트 파이프라인 중 불과 15%에 대해서만 금융 계약을 체결했습니다. 이는 대출 기관이 25%의 자기자본 IRR을 요구하고 있기 때문입니다.
부문별 분석
2025년에는 태양광 발전(PV)이 설비 용량의 100%를 차지하며, 오프그리드 태양에너지 시장 전체 규모 추이를 반영했습니다. 집광형 태양광 발전(CSP)은 최소 10 MW 규모의 설비가 필요하며, 용융염 축열 비용이 1 kWh당 50-80달러에 달하기 때문에 오프그리드 태양에너지 시장이 활기를 띠고 있는 50 kW-5 MW 범위에서는 여전히 수익성을 확보하기 어렵습니다. 예측 기간 동안, 2027년까지 은행 대출 요건을 충족하게 될 페로브스카이트-실리콘 탠덤 셀은 총 설치 비용을 20-30% 절감하고, 미니 그리드 전체의 투자 회수 기간을 단축할 가능성이 있습니다. 양면 수광형 모듈은 이미 발전량을 5-30% 향상시켰으며, 특히 알베도가 높은 사헬 지역에서 오프그리드 태양에너지 시장 내 양면 수광형 모듈의 출하 점유율을 확대되고 있습니다. 그러나 납과 관련된 인증상의 장애물이 페로브스카이트 기술의 도입을 지연시키고, 단기적인 성장을 저해할 가능성이 있습니다.
LFP(리튬인산철) 배터리 가격이 지속적으로 하락하고 있는 것은 모듈 효율 향상과 맞물려, 오프그리드 태양에너지 시장을 가파른 학습 곡선 위에 유지시키고 있습니다. 박막 카드뮴텔루르계 태양전지는 텔루르 공급 제약으로 인해, 결정계 및 탠덤형 태양광 발전이 계속해서 출하량의 대부분을 차지할 것으로 보입니다. 2024년에 Enphase사가 출시한 그리드 형성 기능을 갖춘 에지 오브 그리드형 마이크로 인버터는 단가가 1와트당 0.25달러를 초과했으며, 연결 요건이 농촌 지역의 전력망에 부담을 주기 때문에 Off-grid 표준 사양이라기보다는 그리드 연결형 기능으로 그칠 가능성이 높습니다.
지역별 분석
2025년, 아시아태평양은 오프그리드 태양에너지 시장에서 59.87%의 용량 점유율을 차지하며 시장을 주도했습니다. 그러나 인도의 ‘PM-KUSUM’ 계획은 2024년 중반 시점에서 30.8 GW라는 목표의 불과 9%만 달성한 상태이며, 풍부한 잠재력을 갖추고 있음에도 불구하고 행정 절차의 지연이 두드러집니다. 인도네시아의 2,500개 비전력화 마을의 경우, 정부 보증이 없을 때 내부수익률(IRR)이 8% 미만으로 떨어진다는 사실이 드러나고 있으며, 이로 인해 민간 부문의 건설 확대가 제약을 받고 있습니다. 필리핀은 2027년까지 전 가구의 전기 보급률 100%를 목표로 하고 있으며, 1km당 확장 비용이 1만 달러를 초과하는 지역에서는 미니 그리드에 중점을 두고 있지만, 토지 소유권을 둘러싼 분쟁으로 인해 도입까지 소요되는 기간이 18개월 이상으로 길어지고 있습니다.
중동 및 아프리카은 전 세계 오프그리드 태양에너지 시장을 상회하는 연평균 성장률(CAGR) 26.3%를 나타낼 것으로 전망됩니다. 나이지리아의 DARES는 1,350개의 미니 그리드를 구축하기 위해 18억 5,000만 달러를 조달했으며, 이 중 일부는 부가 서비스 수익을 창출하기 위해 계통 연계형으로 운영되고 있습니다. 케냐의 PAYGo 주요 기업은 2025년까지 100만 개의 시스템을 도입하기 위해 1억 5,600만 달러를 확보한 반면, Amea Power 등 걸프 지역 투자자들은 2027년 가동을 예정하고 있는 코트디부아르의 50MW 발전소에 자금을 지원했습니다. 환율 변동이 여전히 주요 걸림돌로 작용하고 있습니다. 2024년 나이라화 가치가 68% 하락함에 따라, d.light사는 다중 통화 채권을 통해 헤지할 수밖에 없었으며, 이에 따라 발행 스프레드에 150-200 베이시스 포인트가 가산되었습니다.
북미, 유럽, 남미를 합쳐도 거의 전역에 전력망이 구축되어 있기 때문에 오프그리드 태양에너지 시장 규모에서 차지하는 비중은 15% 미만에 그치고 있습니다. 캐나다는 외딴 지역의 원주민 커뮤니티 292곳에서 디젤 발전의 대체 수단을 마련하기 위해 3억 캐나다 달러를 투자했으나, 북극권에 속하는 위도 탓에 태양광 발전의 가동률이 8-12%로 떨어지면서 보급 속도가 둔화되고 있습니다. 브라질에서 2023년 넷미터링 제도가 개정됨에 따라, 2024년 분산형 태양광 발전의 성장률은 40% 감소했습니다. 한편, 아르헨티나에서는 페소화 평가절하로 인해 RenovAr의 파이프라인이 중단되었습니다. 유럽 내의 제한된 수요는 디젤 가격에 따른 차익거래가 이루어지는 섬 지역이나 고지대의 관광 시설에 집중되어 있습니다.
기타 혜택 :
- 엑셀 형식 시장 예측(ME) 시트
- 3개월간의 애널리스트 지원
자주 묻는 질문
목차
제1장 서론
제2장 조사 방법
제3장 주요 요약
제4장 시장 구도
제5장 시장 규모 및 성장 예측
제6장 경쟁 구도
제7장 시장 기회 및 향후 전망
KTH 26.06.29According to Mordor Intelligence, the off-Grid solar energy market size in terms of installed base is expected to grow from 12.75 gigawatt in 2025 to 14.68 gigawatt in 2026 and is forecast to reach 40.02 gigawatt by 2031 at 22.21% CAGR over 2026-2031.

This report is Segmented by Technology (Solar Photovoltaic and Concentrated Solar Power), End-User (Utility-Scale, Commercial and Industrial, and Residential), and Geography (North America, Europe, Asia-Pacific, South America, and Middle East and Africa). The Market Sizes and Forecasts are Provided in Terms of Installed Capacity (GW).
Global Off-Grid Solar Energy Market Trends and Insights
Falling PV Module Prices & Efficiency Gains
Polysilicon oversupply held China FOB module prices near USD 0.12 per watt in 1H 2026, yet costs stabilized when the 9% export VAT rebate ended, and high silver prices added 3-4% to cell inputs PV. Tandem innovation partly offsets these headwinds: Oxford PV started 27.3% modules in May 2024 and targets 7.5 GW capacity by 2029, while LONGi's lab record reached 33.9% in April 2024. Commercial modules topping 26% efficiency could enter the off-grid solar energy market by 2027 and lower balance-of-system spending up to 20%. Bifacial designs such as LONGi's Hi-MO 9 already secure 5-30% extra yield on high-albedo sites, and thin-film cadmium-telluride remains niche because tellurium scarcity caps global output below 10 GW. Yet perovskite durability and lead content are unresolved, with possible IEC 61215 rule changes creating 12-18 months of certification lag.
Rising Rural Electrification Targets
Mission 300 mobilized USD 1.85 billion for Nigeria's DARES program alone, bundling 1,350 mini-grids to serve 17.5 million people. India's PM-KUSUM set a 30.8 GW target but reached only 2.8 GW by mid-2024 because 40-50% farmer co-payments stalled uptake in low-credit states. The International Solar Alliance calculates 59% of the 396 million unelectrified people are better served by mini-grids, yet the financing gap is forty-nine times current capital flows. Indonesia's 2,500 unelectrified villages illustrate last-mile risk: PLN's USD 0.15 per kWh tariff cap drags IRRs below 8%, deterring private bidders without sovereign backing.
High Upfront CAPEX for Large Systems
Telecom hybrid systems need USD 20,000-60,000, and Nigerian towers still face >12% local-currency debt unless risk guarantees cut rates by 300-400 bps. In India, PM-KUSUM Component A obliges 40-50% farmer co-funding; states with <30% credit penetration force reliance on informal 18-24% loans that erode project IRRs. Mini-grid developers across Nigeria secured financial close on only 15% of a USD 1.6 billion pipeline by early 2025 because lenders seek 25% equity IRRs.
Other drivers and restraints analyzed in the detailed report include:
- Declining Li-ion Battery Cost Curve
- Pay-Go Fintech Integration Boosts Affordability
- Intermittent Policy Support / Subsidy Cuts
For complete list of drivers and restraints, kindly check the Table Of Contents.
Segment Analysis
Solar PV accounted for 100% of capacity in 2025, mirroring the overall off-grid solar energy market size trajectory. Concentrated solar power's 10 MW minimum scale and molten-salt storage cost of USD 50-80 per kWh remain uneconomic for the 50 kW-5 MW band, where the off-grid solar energy market thrives. Over the forecast horizon, perovskite-silicon tandems entering bankability by 2027 could pare total installed cost 20-30%, compressing payback periods across mini-grids. Bifacial modules already raise yield 5-30% and expand the off-grid solar energy market share of bifacial shipments, especially in high-albedo Sahel zones. However, lead-related certification hurdles may delay perovskite adoption, tempering near-term upside.
Continuous LFP price declines align with module efficiency gains, keeping the off-grid solar energy market on its steep learning curve. With thin-film cadmium-telluride capped by tellurium supply, crystalline and tandem PV will continue to dominate volume. Edge-of-grid microinverters offering grid-forming capability, launched by Enphase in 2024, will likely remain a grid-connected feature rather than an off-grid standard because unit pricing exceeds USD 0.25 per watt and connectivity requirements strain rural networks.
Geography Analysis
Asia-Pacific dominated the off-grid solar energy market with 59.87% capacity in 2025. Yet India's PM-KUSUM realized only 9% of its 30.8 GW goal by mid-2024, indicating bureaucratic lag amid abundant potential. Indonesia's 2,500 unelectrified villages highlight IRR compression to <8% without sovereign guarantees, constraining private build-out. The Philippines targets 100% household electrification by 2027, focusing on mini-grids where extension costs exceed USD 10,000 per km, but land-title disputes extend lead times past 18 months.
The Middle East and Africa region is forecast to have a 26.3% CAGR, faster than the global off-grid solar energy market. Nigeria's DARES taps USD 1.85 billion to roll out 1,350 mini-grids, some grid-interactive for ancillary-service revenue. Kenyan PAYGo leaders secured USD 156 million in 2025 for 1 million systems, while Gulf investors such as Amea Power financed a 50 MW Ivory Coast plant coming online in 2027. Forex swings remain the key brake; a 68% naira drop in 2024 forced d.light to hedge via multi-currency notes, adding 150-200 bps to issuance spreads.
North America, Europe, and South America combined sit below 15% of the off-grid solar energy market size due to near-universal grid reach. Canada devoted CAD 300 million to replace diesel in 292 remote First Nations communities, but Arctic latitude cuts solar capacity factors to 8-12%, slowing uptake. Brazil's 2023 net-metering revision shrank distributed growth 40% in 2024, while Argentina's peso devaluation froze its RenovAr pipeline. Europe's limited demand centers on island or highland tourism assets where diesel prices supply the arbitrage.
- ABB Ltd.
- Schneider Electric SE
- Canadian Solar Inc.
- JinkoSolar Holding Co. Ltd.
- SunPower Corporation
- Trina Solar Ltd.
- LONGi Green Energy Technology Co. Ltd.
- JA Solar Technology Co. Ltd.
- Sharp Corporation
- Tesla Inc.
- First Solar Inc.
- Sunrun Inc.
- D.Light Design Inc.
- Bboxx Ltd.
- ENGIE Energy Access
- Zola Electric
- SMA Solar Technology AG
- Enphase Energy Inc.
- Fronius International GmbH
- Powerhive Inc.
- Greenlight Planet Inc.
Additional Benefits:
- The market estimate (ME) sheet in Excel format
- 3 months of analyst support
TABLE OF CONTENTS
1 Introduction
- 1.1 Study Assumptions & Market Definition
- 1.2 Scope of the Study
2 Research Methodology
3 Executive Summary
4 Market Landscape
- 4.1 Market Overview
- 4.2 Market Drivers
- 4.2.1 Falling PV module prices & efficiency gains
- 4.2.2 Rising rural electrification targets
- 4.2.3 Declining Li-ion battery cost curve
- 4.2.4 Pay-Go fintech integration boosts affordability
- 4.2.5 ESG-linked debt lowering cost of capital
- 4.2.6 Utility mini-grid tender bundling
- 4.3 Market Restraints
- 4.3.1 High upfront CAPEX for large systems
- 4.3.2 Intermittent policy support/subsidy cuts
- 4.3.3 Saturation of early adopter households
- 4.3.4 Used-panel dumping undermining quality trust
- 4.4 Supply-Chain Analysis
- 4.5 Regulatory Landscape & Government Policies
- 4.6 Technological Outlook (next-gen perovskite, AI-based O&M)
- 4.7 Porter's Five Forces
- 4.7.1 Bargaining Power of Suppliers
- 4.7.2 Bargaining Power of Consumers
- 4.7.3 Threat of New Entrants
- 4.7.4 Threat of Substitute Products & Services
- 4.7.5 Intensity of Competitive Rivalry
5 Market Size & Growth Forecasts
- 5.1 By Technology
- 5.1.1 Solar Photovoltaic (PV)
- 5.1.2 Concentrated Solar Power (CSP)
- 5.2 By End-User
- 5.2.1 Utility-Scale
- 5.2.2 Commercial and Industrial (C&I)
- 5.2.3 Residential
- 5.3 By Component (Qualitative Analysis)
- 5.3.1 Solar Modules/Panels
- 5.3.2 Inverters (String, Central, Micro)
- 5.3.3 Mounting and Tracking Systems
- 5.3.4 Balance-of-System and Electricals
- 5.3.5 Energy Storage and Hybrid Integration
- 5.4 By Geography
- 5.4.1 North America
- 5.4.1.1 United States
- 5.4.1.2 Canada
- 5.4.1.3 Mexico
- 5.4.2 Europe
- 5.4.2.1 United Kingdom
- 5.4.2.2 Germany
- 5.4.2.3 France
- 5.4.2.4 Spain
- 5.4.2.5 Nordic Countries
- 5.4.2.6 Russia
- 5.4.2.7 Rest of Europe
- 5.4.3 Asia-Pacific
- 5.4.3.1 China
- 5.4.3.2 India
- 5.4.3.3 Japan
- 5.4.3.4 South Korea
- 5.4.3.5 Malaysia
- 5.4.3.6 Thailand
- 5.4.3.7 Indonesia
- 5.4.3.8 Vietnam
- 5.4.3.9 Australia
- 5.4.3.10 Rest of Asia-Pacific
- 5.4.4 South America
- 5.4.4.1 Brazil
- 5.4.4.2 Argentina
- 5.4.4.3 Colombia
- 5.4.4.4 Rest of South America
- 5.4.5 Middle East and Africa
- 5.4.5.1 United Arab Emirates
- 5.4.5.2 Saudi Arabia
- 5.4.5.3 South Africa
- 5.4.5.4 Egypt
- 5.4.5.5 Rest of Middle East and Africa
- 5.4.1 North America
6 Competitive Landscape
- 6.1 Market Concentration
- 6.2 Strategic Moves (M&A, Partnerships, PPAs)
- 6.3 Market Share Analysis (Market Rank/Share for key companies)
- 6.4 Company Profiles (includes Global level Overview, Market level overview, Core Segments, Financials as available, Strategic Information, Products & Services, and Recent Developments)
- 6.4.1 ABB Ltd.
- 6.4.2 Schneider Electric SE
- 6.4.3 Canadian Solar Inc.
- 6.4.4 JinkoSolar Holding Co. Ltd.
- 6.4.5 SunPower Corporation
- 6.4.6 Trina Solar Ltd.
- 6.4.7 LONGi Green Energy Technology Co. Ltd.
- 6.4.8 JA Solar Technology Co. Ltd.
- 6.4.9 Sharp Corporation
- 6.4.10 Tesla Inc.
- 6.4.11 First Solar Inc.
- 6.4.12 Sunrun Inc.
- 6.4.13 D.Light Design Inc.
- 6.4.14 Bboxx Ltd.
- 6.4.15 ENGIE Energy Access
- 6.4.16 Zola Electric
- 6.4.17 SMA Solar Technology AG
- 6.4.18 Enphase Energy Inc.
- 6.4.19 Fronius International GmbH
- 6.4.20 Powerhive Inc.
- 6.4.21 Greenlight Planet Inc.
7 Market Opportunities & Future Outlook
- 7.1 White-space & Unmet-Need Assessment

