
|
시장보고서
상품코드
2066702
아시아태평양의 비즈니스 제트 : 시장 점유율 분석, 업계 동향 및 통계, 성장 예측(2026-2031년)Asia-Pacific Business Jet - Market Share Analysis, Industry Trends & Statistics, Growth Forecasts (2026 - 2031) |
||||||
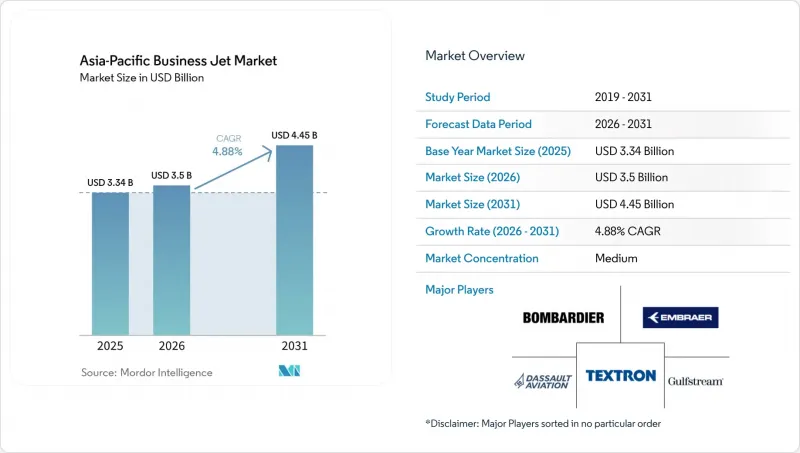
Mordor Intelligence에 의하면, 아시아태평양의 비즈니스 제트 시장 규모는 2025년 33억 4,000만 달러로 평가되었습니다. 2026년에는 35억 달러로 확대되어 2026년부터 2031년에 걸쳐 CAGR 4.88%로 성장을 지속하여, 2031년에는 44억 5,000만 달러에 이를 것으로 예측됩니다.
본 보고서는 기체 유형(대형 제트기, 중형 제트기, 소형/초소형 제트기), 최종 사용자(개인 소유자, 기업·법인, 전세/항공 택시 사업자 등), 소유 형태(신규 기체 구매, 중고 기체 구매 등) 및 지역(중국, 인도, 일본, 싱가포르, 호주, 말레이시아 등)별로 분류되어 있습니다. 시장 전망은 금액(달러) 기준으로 제시되어 있습니다.
아시아태평양의 비즈니스 제트 시장 동향 및 인사이트
아시아태평양의 고자산가(HNWI) 및 기업의 자산 증가
이 지역의 기업 및 개인 고객들의 출장 패턴은 시간 절약과 일정 관리를 중시하는 경향이 점점 더 강해지고 있습니다. 아시아 기업을 대상으로 한 조사에 따르면, 현재 기업 임원의 63%가 업무 출장에 비즈니스 항공을 이용하고 있으며, 사모펀드, 헤지펀드, 패밀리 오피스에서는 그 비율이 69%까지 상승하고 있습니다. 이용자들은 민간 항공기를 이용한 이동에 비해 1회 여정당 2-3시간의 시간 단축 효과를 꼽고 있으며, 이는 항공기 증편이나 전세 항공편 이용을 통한 생산성 향상이라는 이점이 입증된 것입니다. 이러한 행동의 변화는 더 많은 기업 이용자들이 일상적인 여정에 지점 간 이동을 포함시키면서, 아시아태평양의 비즈니스 제트 시장의 예상 성장세와 일치하고 있습니다. 민간 자본과 기업의 재무 부서가 신뢰성을 최우선으로 여기는 가운데, 항공 운항 부서와 전세 항공 서비스 제공업체들은 재량적인 지출 주기에서 통합형 솔루션으로 전환하고 있습니다. 그 결과, 아시아태평양의 비즈니스 제트 시장 전체의 이용률과 갱신을 뒷받침하는 더욱 견고한 수요 기반이 형성되고 있습니다.
코로나19 사태 이후 포인트 투 포인트 전세 수요의 급증
전세 수요는 회복 단계에서 정착 단계로 접어들고 있으며, 각 운영사는 항공사의 허브 공항을 우회하는 단거리 지역 노선 네트워크를 구축하고 있습니다. 싱가포르의 창이 공항과 셀레타 공항에서는 2023년 비즈니스 제트기 출발 편수가 2019년 대비 약 28% 증가했는데, 이는 혼잡한 항공로에서 시간적 제약이 따르는 이동 시 개인 전용기로의 지속적인 전환을 보여줍니다. 디지털 프로그램의 유연성도 높아지고 있으며, 아시아에서는 회원 수가 증가하고 있을 뿐만 아니라, 전 세계에 흩어져 있는 항공기들과 여행객을 연결해 주는 앱 기반 마켓플레이스의 거래량도 증가하고 있습니다. 이러한 변화들이 맞물리면서, 항공사의 공식 스케줄보다 예측 가능성을 더 중요시하는 기업 팀들에게 온디맨드 항공편의 실질적인 유용성이 높아지고 있습니다. 이러한 행동 양식의 변화는 2선 도시 간 네트워크 밀도가 높아짐에 따라, 아시아태평양의 비즈니스 제트 시장의 이용률 향상을 뒷받침하는 광범위한 추세의 기반이 되고 있습니다.
높은 취득·운용 비용과 환율 변동 위험
항공기 구매 비용 및 수명 주기 비용은 주로 달러로 책정되는 반면, 많은 운항사의 수익은 현지 통화로 계상되기 때문에 조달 및 운항 시 재무적 위험이 높아집니다. 보험, 예비 부품, 정비 프로그램도 달러 기준치에 연동되어 있기 때문에 비용의 현지화가 제한되고, 계획 수립이 환율 변동의 영향을 받기 쉬워집니다. 특정 시장에서 부과되는 수입 관세나 사치세 등의 재정 조치가 납입 가격에 가산됨으로써, 중견 기업의 대차대조표상 소유를 저해하는 요인이 되고 있습니다. 이러한 추세를 배경으로, 자본 및 잔존 리스크를 운항사에 전가하는 ‘애셋라이트형’ 접근 모델이 부상하고 있습니다. 또한 중고 장비의 구매도 장려되고 있는데, 이는 낮은 구매 가격이 자산 수명 주기의 후반부에 발생하는 높은 정비 비용을 상쇄할 수 있기 때문입니다. 이러한 역풍이 겹치면서, 아시아태평양의 비즈니스 제트 시장 일부에서는 신형 기체 도입 속도가 둔화되고 있습니다.
부문별 분석
2025년에는 대형 제트기가 47.62%를 차지했습니다. 이는 아시아태평양의 비즈니스 제트 시장에서 기업 및 초고액 자산가 소유주들 사이에서 대륙 간 비행 수요가 지속되고 있음을 반영합니다. 이 플랫폼의 로드맵은 실내 공간, 주행 거리, 연결성을 개선함으로써 경영진의 장거리 이동 시 생산성을 유지하고, 이 부문을 지속적으로 강화하고 있습니다. 국내선이나 단거리 지역 노선이 주를 이루는 시장에서는 구매 및 승무원 비용 측면에서 다양한 접근 방식이 유리합니다.
라이트 제트 및 베리 라이트 제트는 비행 구간 단축과 운영 시간대가 제한된 지방 공항으로의 접근 수요에 힘입어, 2031년까지 연평균 성장률(CAGR) 6.12%로 가장 빠른 성장이 예상됩니다. 차세대 항공전자 장비와 객실 시스템 역시 승무원의 업무 부담을 줄이는 데 기여하고 있으며, 이는 인력 부족이 심각한 시장에서 실질적인 이점이 됩니다. 따라서 아시아태평양의 비즈니스 제트기 업계는 최상위급 성능과 단거리 노선에서의 고빈도 운항 간의 균형을 맞추고 있습니다. 라이트 및 슈퍼 미드사이즈 부문의 차량 교체 주기는 연료 소비량 감소와 정비 빈도 합리화를 통해 이익률 향상을 가져옵니다. 운송사가 이러한 운영 목적에 맞추어 기종을 통일함에 따라, 지방 도시 간 고밀도 노선의 신뢰성과 접근성이 향상되고 있습니다.
라이트 및 슈퍼 미드사이즈 부문의 출시 동향은 편의성과 연결성을 희생하지 않으면서도 경제성 향상을 꾸준히 추구하고 있음을 반영하고 있습니다. OEM 제품 라인업에 대한 단계적인 업그레이드는 운영 비용을 직접 절감하고, 고객의 기대에 부응하는 최신 객실을 제공함으로써 이러한 목표를 뒷받침하고 있습니다. 전세 사업에서는 비행 거리에 따라 최적의 기체 크기를 선택할 수 있게 됨으로써 가격 책정이 개선되고, 대상 고객층이 확대됩니다. 기업의 항공 부문에서는 국내 및 지역 간 항공편의 유연성이 높아짐에 따라 항공사 스케줄에 대한 의존도가 낮아지고, 스케줄 관리가 개선됩니다. 이러한 동향으로 인해 아시아태평양의 비즈니스 제트 시장에서 라이트 제트기와 베리 라이트 제트기의 성장이 가장 빠르게 나타날 것으로 전망됩니다. 동시에, 대륙 횡단 및 태평양 횡단 항공편의 경우, 대형 객실의 수용 능력은 여전히 필수적입니다. 아시아태평양의 비즈니스 제트기 업계에서는 운영사들이 구형 기체를 교체하고 최신 플랫폼 기능을 활용함에 따라 기체 구성의 최적화가 지속적으로 진행될 것입니다.
기타 혜택 :
- 엑셀 형식 시장 예측(ME) 시트
- 3개월간의 애널리스트 지원
자주 묻는 질문
목차
제1장 서론
제2장 조사 방법
제3장 주요 요약
제4장 주요 업계 동향
제5장 시장 구도
제6장 시장 규모 및 성장 예측
제7장 경쟁 구도
제8장 시장 기회 및 향후 전망
KTH 26.06.29According to Mordor Intelligence, the asia-Pacific business jet market size is expected to grow from USD 3.34 billion in 2025 to USD 3.50 billion in 2026 and is forecasted to reach USD 4.45 billion by 2031 at a 4.88% CAGR over 2026-2031.

This report is Segmented by Body Type (Large Jet, Mid-Size Jet, and Light/Very-Light Jet), End User (Individual Owners, Businesses and Corporate Entities, Charter/Air-Taxi Operators, and More), Ownership Model (New Aircraft Purchase, Pre-Owned Purchase, and More), and Geography (China, India, Japan, Singapore, Australia, Malaysia and More). The Market Forecasts are Provided in Terms of Value (USD).
Asia-Pacific Business Jet Market Trends and Insights
Rising HNWI and Corporate Wealth in Asia-Pacific
Corporate and private-client travel patterns across the region are increasingly anchored to time savings and schedule control. A survey of Asian organizations reported that 63% of corporate executives now use business aviation for work trips, rising to 69% among private equity, hedge funds, and family offices. Users cited time savings of 2 to 3 hours per journey compared with commercial travel, reinforcing the productivity case for expanding the fleet and using charters. These behavioral shifts align with the projected growth of the Asia-Pacific business jet market as more enterprise users embed point-to-point access into routine itineraries. As private capital and corporate treasuries prioritize reliability, flight departments and charter providers evolve away from discretionary spending cycles toward embedded solutions. The result is a more resilient demand baseline that supports utilization and renewal across the Asia-Pacific business jet market.
Post-COVID Surge in Point-to-Point Charter Demand
Charter demand has moved from recovery to structure, with operators designing networks for short regional missions that bypass airline hubs. Singapore's Changi and Seletar airports recorded business jet departures nearly 28% higher in 2023 compared with 2019, which signals a durable shift toward private lift for time-critical travel in congested corridors. Digital programs are adding flexibility as well, with membership growth in Asia and higher transaction volumes on app-based marketplaces that connect travelers to globally distributed fleets. Together, these changes have raised the practical utility of on-demand flying for corporate teams that value predictability over published airline schedules. This behavioral pivot underpins a broader trend of increased utilization in the Asia-Pacific business jet market as network density builds across secondary city pairs.
High Acquisition and Operating Costs plus FX Volatility
Aircraft purchase and lifecycle costs are primarily denominated in USD, while many operator revenues accrue in local currencies, which elevates financial exposure during procurement and operations. Insurance, spares, and maintenance programs are also linked to USD benchmarks, which limits the ability to localize costs and makes planning sensitive to currency swings. Fiscal measures, such as import duties and luxury taxes in select markets, add to delivered prices, which can deter balance-sheet ownership among mid-sized enterprises. These dynamics have supported the rise of asset-light access models that shift capital and residual risk to operators. They also encourage pre-owned acquisition, where the lower price point can offset higher maintenance costs later in the asset's life. Taken together, these headwinds moderate the pace of new-aircraft absorption in parts of the Asia-Pacific business jet market.
Other drivers and restraints analyzed in the detailed report include:
- Expansion of FBO and MRO Infrastructure
- Fleet-Modernization Programs of Charter Operators
- Asia-Pacific Pilot-Shortage Bottleneck
For complete list of drivers and restraints, kindly check the Table Of Contents.
Segment Analysis
Large jets accounted for 47.62% in 2025, reflecting sustained intercontinental mission needs among corporates and ultra-high-net-worth owners in the Asia-Pacific business jet market. Platform roadmaps continue to reinforce this segment with cabin, range, and connectivity advances that keep long-haul travel productive for executive teams. Purchase and crewing economics favor a diversified approach in markets where domestic and short regional missions dominate.
Light and very-light jets are projected to grow the fastest at a 6.12% CAGR through 2031, supported by shorter stage lengths and the need to access secondary airports with tighter operating windows. New-generation avionics and cabin systems also help reduce crew workload, which is a practical advantage in a tight labor market. The Asia-Pacific business jet industry is therefore balancing capability at the top of the range with higher-frequency deployments on shorter legs. Refresh cycles in the light and super-midsize categories add margin benefits from lower fuel burn and streamlined maintenance events. As operators harmonize fleets around these missions, reliability and access improve on high-density routes between secondary city pairs.
The adoption profile in light and super-midsize categories reflects a consistent push for better economics without sacrificing comfort or connectivity. Incremental upgrades to OEM portfolios support these goals by reducing direct operating costs and delivering modern cabins that meet client expectations. For charter, the ability to right-size aircraft to mission length improves pricing and expands the addressable client base. For corporate flight departments, flexibility across intra-country and regional trips reduces reliance on airline schedules and improves schedule control. These dynamics underpin the fastest growth outlook for light and very-light jets in the Asia-Pacific business jet market. At the same time, large-cabin capability remains essential for transcontinental and trans-Pacific missions. The Asia-Pacific business jet industry will continue to optimize mixes as operators replace older airframes and leverage the latest platform features.
List of Companies Covered in this Report:
- Airbus SE
- Bombardier Inc.
- Cirrus Design Corporation (Aviation Industry Corporation of China)
- Dassault Aviation S.A.
- Embraer S.A.
- Gulfstream Aerospace Corporation (General Dynamics Corporation)
- Honda Aircraft Company (Honda Motor Co., Ltd.)
- Pilatus Aircraft Ltd.
- Textron Inc.
- The Boeing Company
Additional Benefits:
- The market estimate (ME) sheet in Excel format
- 3 months of analyst support
TABLE OF CONTENTS
1 INTRODUCTION
- 1.1 Study Assumptions and Market Definition
- 1.2 Scope of the Study
2 RESEARCH METHODOLOGY
3 EXECUTIVE SUMMARY
4 KEY INDUSTRY TRENDS
- 4.1 High-Net-Worth Individual (HNWI) Population Trend
5 MARKET LANDSCAPE
- 5.1 Market Overview
- 5.2 Market Drivers
- 5.2.1 Rising HNWI and corporate wealth in Asia-Pacific
- 5.2.2 Post-COVID surge in point-to-point charter demand
- 5.2.3 Expansion of FBO and MRO infrastructure
- 5.2.4 Fleet-modernization programs of charter operators
- 5.2.5 Liberalization of secondary-airport night slots (ASEAN)
- 5.2.6 Time-critical cross-border e-commerce executive travel
- 5.3 Market Restraints
- 5.3.1 High acquisition and operating costs plus FX volatility
- 5.3.2 Asia-Pacific pilot-shortage bottleneck
- 5.3.3 Import duties and luxury taxes in emerging Asia-Pacific markets
- 5.3.4 Environmental opposition and potential slot curbs
- 5.4 Value Chain Analysis
- 5.5 Regulatory Landscape
- 5.6 Technological Outlook
- 5.7 Porter's Five Forces Analysis
- 5.7.1 Threat of New Entrants
- 5.7.2 Bargaining Power of Suppliers
- 5.7.3 Bargaining Power of Buyers
- 5.7.4 Threat of Substitutes
- 5.7.5 Intensity of Competitive Rivalry
6 MARKET SIZE AND GROWTH FORECASTS (VALUE)
- 6.1 By Body Type
- 6.1.1 Large Jet
- 6.1.2 Mid-Size Jet
- 6.1.3 Light/Very-Light Jet
- 6.2 By End User
- 6.2.1 Individual Owners
- 6.2.2 Businesses and Corporate Entities
- 6.2.3 Charter/Air-Taxi Operators
- 6.2.4 Training and Academic Institutions
- 6.2.5 Government and Special-Mission Operators
- 6.3 By Ownership Model
- 6.3.1 New Aircraft Purchase
- 6.3.2 Pre-Owned Purchase
- 6.3.3 Fractional Ownership
- 6.3.4 Jet Cards/Membership
- 6.4 By Geography
- 6.4.1 China
- 6.4.2 Japan
- 6.4.3 India
- 6.4.4 Singapore
- 6.4.5 Australia
- 6.4.6 Malaysia
- 6.4.7 South Korea
- 6.4.8 Indonesia
- 6.4.9 Thailand
- 6.4.10 Philippines
- 6.4.11 Rest of Asia-Pacific
7 COMPETITIVE LANDSCAPE
- 7.1 Market Concentration
- 7.2 Strategic Moves
- 7.3 Market Share Analysis
- 7.4 Company Profiles (includes Global level Overview, Market level overview, Core Segments, Financials as available, Strategic Information, Market Rank/Share for key companies, Products and Services, and Recent Developments)
- 7.4.1 Airbus SE
- 7.4.2 Bombardier Inc.
- 7.4.3 Cirrus Design Corporation (Aviation Industry Corporation of China)
- 7.4.4 Dassault Aviation S.A.
- 7.4.5 Embraer S.A.
- 7.4.6 Gulfstream Aerospace Corporation (General Dynamics Corporation)
- 7.4.7 Honda Aircraft Company (Honda Motor Co., Ltd.)
- 7.4.8 Pilatus Aircraft Ltd.
- 7.4.9 Textron Inc.
- 7.4.10 The Boeing Company
8 MARKET OPPORTUNITIES AND FUTURE OUTLOOK
- 8.1 White-space and Unmet-Need Assessment
