
|
시장보고서
상품코드
2066741
전기 버스 배터리 팩 : 시장 점유율 분석, 업계 동향 및 통계, 성장 예측(2026-2031년)Electric Bus Battery Pack - Market Share Analysis, Industry Trends & Statistics, Growth Forecasts (2026 - 2031) |
||||||
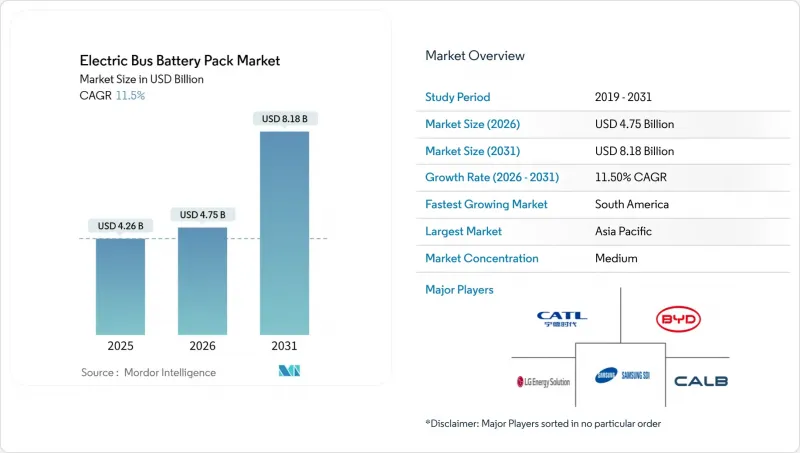
Mordor Intelligence에 의하면, 전기 버스 배터리 팩 시장 규모는 2025년 42억 6,000만 달러로 평가되었습니다. 2026년에는 47억 5,000만 달러로 확대되어 2031년까지 81억 8,000만 달러에 이를 것으로 예상되며 2026년부터 2031년에 걸쳐 CAGR 11.50%로 성장할 전망입니다.
본 보고서는 차종별(미니/마이크로버스(8m 미만), 미디(8-10.5m), 기타), 구동 방식(배터리식 전기자동차(BEV), PHEV), 배터리 화학 조성(LFP, LMFP, 기타), 용량, 배터리 형상, 전압 등급, 모듈 아키텍처, 구성 부품 및 지역별로 분류되어 있습니다. 시장 전망은 금액(달러) 및 수량(대)으로 제시되어 있습니다.
세계의 전기 버스 배터리 팩 시장 동향 및 분석
제로 배출 버스에 관한 규제(미국, EU, 중국)
캘리포니아주의 ‘혁신적 청정 교통 규정(Innovative Clean Transit rule)’에 따르면, 2029년까지 대중교통 기관의 신규 버스 구매를 100% 무공해 차량으로 전환해야 합니다. 한편, EU의 ‘청정 차량 지침(Clean Vehicles Directive)’에서는 시간이 지남에 따라 점차 강화되는 법적 구속력을 지닌 전기 버스 조달 할당량이 설정되어 있습니다. 베이징을 비롯한 중국의 1급 도시에서는 디젤차 구매에 벌금을 부과하고, 배터리식 전기자동차 도입을 장려하는 병행형 이중 크레딧 제도가 적용되고 있습니다. 이러한 규제들이 복합적으로 작용하여 입찰 물량이 증가함에 따라, 교통 기관의 초점은 예산 최적화에서 납기 확실성으로 옮겨가고 있습니다. 규제 당국이 상호 운용성에 대해 입장을 조율하는 가운데, 800V를 초과하는 배터리 팩에 대한 인증을 획득하고 표준화된 CCS 또는 MCS 커넥터와 통합이 가능한 공급업체가 우선적으로 선정됩니다. 이러한 정책의 추진력에 힘입어 수주량의 집약이 가속화되면서, 전 세계의 설계는 규제 요건을 충족하는 구성으로 나아가고 있습니다.
LFP 및 LMFP 화학계 배터리의 kWh당 단가 하락
2025년에는 LFP 배터리 팩의 평균 가격이 하락하고 LMFP 가격도 떨어지면서, 니켈·망간·코발트(NMC) 계열 대체 제품과의 기존 가격 차이가 좁혀졌습니다. 향후 몇 년 동안 두 화학 계열 모두 비용 경쟁력이 더욱 높아질 것으로 예상에 따라, 대중교통은 대부분의 운행 주기에서 디젤 차량과의 수명 주기 비용 균형을 달성할 수 있는 체제가 점차 갖춰지고 있습니다. LFP에 비해 에너지 밀도가 높은 LMFP는 열폭주 위험 없이 연절 버스의 주행 거리 목표를 달성할 수 있게 해주며, 이는 고온 기후에서 운행하는 사업자에게 결정적인 요소가 됩니다. 저비용과 고밀도의 조합 덕분에, 입찰에서는 코발트를 포함하지 않는 화학 성분이 우위를 점하고 있어, 변동이 심한 업스트림 금속 가격에 미치는 영향이 완화되고 있습니다. 일찍부터 망간 공급 계약을 확보한 제조업체들은 현재, 비용 안정성을 입찰에서의 강점으로 활용하고 있습니다.
업스트림 지역의 주요 광물 공급 변동
2025년, 탄산리튬 가격은 큰 변동을 보였으며, 코발트와 니켈도 지정학적 긴장의 영향을 받아 비슷한 변동성을 나타냈습니다. 이러한 가격 급등은 공공기관이 선호하는 고정가격 조달 계약을 복잡하게 만들고 있습니다. 이에 대응하여 각 제조업체들은 코발트가 포함되지 않은 LFP 및 LMFP 화학계 배터리로의 전환을 추진하고 있으나, 망간 및 인산염의 물류 측면에서는 여전히 공급 능력의 제약에 직면해 있습니다. 현물 시장의 불안정성은 배터리 제조업체의 운전 자금 수요를 증가시켜, 때때로 버스 납품 지연을 초래하고 있습니다. 아르헨티나와 호주의 장기적인 광산 확장으로 인해 향후 몇 년 동안 공급 부족 현상은 완화될 가능성이 있지만, 단기적인 헤지 비용은 여전히 남아 있습니다.
부문별 분석
2025년, 표준형(12m) 차량은 다양한 운행 밀도에 대응할 수 있고 성숙한 공급망의 혜택을 누리고 있어, 전기 버스 배터리 팩 시장 점유율의 48.25%를 차지했습니다. 한편, 연결형(18m)은 좌석당 비용을 절감하면서도 승객 수송 능력을 향상시키는 것을 목표로 하는 버스 고속 수송 시스템(BRT) 노선의 성장에 힘입어, 2031년까지 연평균 성장률(CAGR) 13.64%를 나타낼 것으로 전망됩니다. 각 도시가 기후 변화 대응 자금을 운송 능력 확충에 투입함에 따라, 연결형 전기버스 배터리 팩 시장은 2031년까지 크게 확대될 것으로 전망됩니다.
대형 플랫폼에 대한 수요로 인해 배터리 팩의 평균 용량이 200kWh를 넘어서는 추세이며, 각 제조업체는 열적 핫스팟을 완화하기 위해 액체 냉각 시스템과 견고한 배터리 관리 시스템의 도입을 추진하고 있습니다. 배리어프리 규제의 관점에서도 양쪽에 문을 갖추고, 널찍한 저상 구역을 제공하는 연결형 설계가 유리합니다. 도시 계획 담당자들이 도로변 공간의 효율화를 우선시하는 가운데, 장축 차량을 도입함으로써 차량 대수를 줄일 수 있어 인건비와 유지보수 비용을 절감할 수 있습니다. 그 결과, 모듈식 고전압 솔루션에 주력하는 배터리 공급업체들은 이 하위 부문에서 부가가치를 창출할 수 있을 것으로 보입니다.
2025년에는 배터리식 전기자동차(BEV)가 총 출하 대수의 89.33%를 차지하며, 기존 플러그인 하이브리드차의 틈새 시장을 사실상 흡수했습니다. BEV와 관련된 전기 버스 배터리 팩 시장은 2031년까지 연평균 성장률(CAGR) 12.58%를 기록하며 크게 성장할 전망입니다.
PHEV는 산악 노선이나 전력망 접근성이 제한되어 완전한 전기화가 어려운 지역에서 여전히 이용되고 있지만, 배터리의 고밀도화와 충전 인프라 확충으로 인해 이러한 장벽은 빠르게 해소되고 있습니다. 전전기식 구동계의 단순성은 부품 재고 및 정비사 재교육 비용을 절감해 주어, 자원이 제한적인 기관들로부터 지지를 얻고 있습니다. 제로 배기 가스 배출 요건을 둘러싼 규제가 강화됨에 따라, PHEV의 보조금 수혜 자격은 낮아지고 있으며, 시장 점유율은 더욱 위축되고 있습니다. 그 결과, 전지 제조업체들은 BEV의 가동 주기에 특화된 화학 조성 및 형태를 지속적으로 개발하며, 그 경쟁 우위를 더욱 공고히 하고 있습니다.
LFP는 비용 면에서의 우위와 열적 안정성을 바탕으로 2025년에도 57.02%의 시장 점유율을 유지했으나, LMFP는 연평균 성장률(CAGR) 13.97%를 기록하며 가장 빠르게 성장하는 대체 기술로서의 입지를 확고히 하고 있습니다. 현재의 추세가 지속된다면, 2031년까지 전기 버스 배터리 팩 시장에서 LMFP의 점유율은 더욱 확대될 가능성이 있습니다.
LMFP는 망간을 첨가함으로써 코발트가 포함되지 않은 특성을 유지하면서 에너지 밀도를 높였으며, 가연성 용매를 사용하지 않고도 장거리 주행이 필요한 연결형 버스에 적합합니다. 한랭지에서의 내한성도 뛰어나, 북유럽과 캐나다에서의 보급을 더욱 촉진하고 있습니다. 한편, NMC 및 NCA 계열 배터리는 금속 가격 변동을 배경으로 틈새 시장인 고출력 용도로 그 영역이 축소되고 있습니다. 이중 화학 성분 생산 라인에 투자하는 공급업체들은 수요 변화에 대비하여 안정적인 가동률을 확보하고 있습니다.
지역별 분석
아시아태평양은 중국의 규모의 경제, 인도의 FAME II 인센티브, 그리고 한국의 선진적인 셀 제조 기술 덕분에 2025년 세계 생산량의 63.22%를 계속 차지했습니다. 각 지역 정부는 버스 발주에 현지 조달 규정을 반영함으로써 수요를 국내 공장으로 유도하고 리드타임을 단축하고 있습니다. 쓰촨성에서의 리튬 가공부터 광둥성에서의 배터리 팩 조립에 이르는 통합 공급망을 통해 단가가 절감되어, 지역 공급업체들에게 결정적인 가격 경쟁력을 부여하고 있습니다. 또한, 인도네시아와 태국의 대도시에서 진행 중인 시범 프로그램에서는 지하철 환승역에 설치된 급속 충전소가 도입되어, 동남아시아 전역으로의 도입 확대가 촉진되고 있습니다.
브라질, 콜롬비아, 칠레가 친환경 대중교통을 위해 기후 변화 대응 자금을 배정하고 있는 만큼, 남미는 2031년까지 15.12%라는 가장 높은 연평균 성장률(CAGR)을 보일 것으로 전망됩니다. BYD와 Yutong은 수입 관세를 피하기 위해 노크다운 키트 공장을 설립한 반면, 아르헨티나의 국내 리튬 매장량은 양극재 정제 업체들의 관심을 끌고 있습니다. 다자간 은행이 충전 인프라에 대한 대출을 담당함으로써, 국가 신용 위험을 완화하는 동시에 저금리의 설비 대출을 실현하고 있습니다. 배터리 팩의 비용이 낮아짐에 따라 메데진과 같은 중규모 도시조차도 버스 전 차량의 전환에 착수하고 있으며, 이는 수도권 이외의 지역에서도 두 번째 도입 물결이 도래하고 있음을 보여줍니다.
유럽과 북미에서는 도입 곡선이 성숙 단계에 접어든 가운데, 1세대 버스가 배터리 교체 시기를 맞이함에 따라 안정적인 교체 수요가 지속되고 있습니다. EU의 ‘그린 딜’에서는 지역 통합 기금이 차고 개보수 비용으로 사용되고 있으며, 미국에서는 연방 정부의 보조금을 통해 저소득 지역의 버스 구입 비용이 지원되고 있습니다. 이러한 지역에서는 V2G(차량에서 전력망으로의 전력 공급) 기능이나 충돌 안전성을 갖춘 배터리 팩 케이스 등 첨단 기능이 우선시되고 있어, 평균 판매 가격이 상승하고 있습니다. 그렇긴 하지만, 국내 조달률에 관한 규정에 따라 합작 기업에 의한 배터리 팩의 현지 생산이 촉진되면서 공급 체제가 재구축되고 있습니다.
기타 혜택 :
- 엑셀 형식 시장 예측(ME) 시트
- 3개월간의 애널리스트 지원
자주 묻는 질문
목차
제1장 서론
제2장 조사 방법
제3장 주요 요약
제4장 시장 구도
제5장 시장 규모 및 성장 예측
제6장 경쟁 구도
제7장 시장 기회 및 향후 전망
제8장 EV 배터리 팩 기업 CEO를 향한 중요 전략적 과제
제9장 누가 누구에게 공급하고 있을까(OEM·Tier별 맵)
제10장 로컬라이즈와 비용 구성
제11장 생산능력·가동률 트래커
제12장 무역 흐름과 수입 의존도
제13장 재활용과 세컨드 라이프 에코시스템
KTH 26.06.29According to Mordor Intelligence, the electric bus battery pack market size is expected to increase from USD 4.26 billion in 2025 to USD 4.75 billion in 2026 and reach USD 8.18 billion by 2031, advancing at an 11.50% CAGR over 2026-2031.

This report is Segmented by Type (Mini/Microbus (Below 8 M), Midi (8-10. 5 M), and More), Propulsion Type (Battery Electric Vehicle (BEV), Plug-In Hybrid Electric Vehicle (PHEV)), Battery Chemistry (LFP, LMFP, and More), Capacity, Battery Form, Voltage Class, Module Architecture, Component, and Geography. The Market Forecasts are Provided in Terms of Value (USD) and Volume (Units).
Global Electric Bus Battery Pack Market Trends and Insights
Zero-Emission-Bus Mandates (United States, EU, China)
California's Innovative Clean Transit rule requires 100% zero-emission transit agency new bus purchases by 2029, while the EU Clean Vehicles Directive sets binding electric-bus procurement quotas that tighten over time. Beijing and other tier-one Chinese cities apply parallel dual-credit incentives that penalize diesel procurement and reward the uptake of battery electric vehicles. Together, these mandates increase tender volumes, shifting agency focus from budgetary optimization to delivery-schedule certainty. Suppliers able to certify packs above 800 V and to integrate with standardized CCS or MCS connectors gain preference as regulators align on interoperability. The policy momentum thus accelerates volume aggregation and steers global designs toward compliance-ready configurations.
Declining USD/kWh for LFP + LMFP Chemistries
In 2025, average pricing for LFP packs declined, while LMFP prices also decreased, narrowing the historical gap with nickel-manganese-cobalt (NMC) alternatives. As both chemistries are expected to become more cost-competitive in the coming years, transit agencies stand poised to achieve lifetime cost parity with diesel across the majority of duty cycles. LMFP's energy-density uplift over LFP unlocks articulated bus range targets without thermal-runaway risk, which is decisive for operators in hot climates. The combination of lower cost and higher density tilts tenders toward cobalt-free chemistries, softening exposure to volatile upstream metal prices. Manufacturers that secured manganese supply contracts early now leverage cost stability as a bidding advantage.
Upstream Critical-Mineral Supply Volatility
In 2025, lithium carbonate prices experienced significant fluctuations, with cobalt and nickel showing similar volatility, influenced by geopolitical tensions. Such spikes complicate fixed-price procurement contracts that public agencies favor. In response, manufacturers are pivoting toward cobalt-free LFP and LMFP chemistries, yet manganese and phosphate logistics still face capacity constraints. Spot-market instability raises working-capital needs for cell makers, occasionally delaying bus deliveries. Long-term mining expansions in Argentina and Australia may ease shortages in the coming years, but near-term hedging costs persist.
Other drivers and restraints analyzed in the detailed report include:
- Battery-Leasing and As-A-Service Models Scaling in Asia-Pacific
- Fleet-Telematics-Driven TCO Analytics Adoption
- High-Voltage (Above 800 V) Safety Certification Bottlenecks
For complete list of drivers and restraints, kindly check the Table Of Contents.
Segment Analysis
Standard (12 m) vehicles captured 48.25% of the electric bus battery pack market share in 2025, as they suit diverse route densities and benefit from mature supply chains. However, articulated (18 m) formats post a 13.64% CAGR through 2031, driven by Bus Rapid Transit corridors seeking higher passenger throughput at lower per-seat cost . The electric bus battery pack market for articulated units is forecast to expand significantly by 2031 as cities allocate climate funding toward capacity upgrades.
Demand for larger platforms is driving average pack capacity beyond 200 kWh, prompting manufacturers to integrate liquid cooling and robust battery management to mitigate thermal hotspots. Accessibility regulations favor articulated designs that offer dual doorways and spacious, low-floor areas. As urban planners prioritize curbspace, long vehicles reduce fleet counts, lowering labor and maintenance overhead. Consequently, battery suppliers focusing on modular, higher-voltage solutions stand to capture incremental value in this sub-segment.
Battery electric vehicles (BEVs) controlled 89.33% of total shipments in 2025, essentially absorbing former plug-in hybrid niches. The electric bus battery pack market tied to BEVs is set to grow significantly by 2031, with a 12.58% CAGR.
PHEVs linger where mountainous routes or limited grid access complicate full electrification, yet battery density and charging build-outs are eroding these barriers rapidly. The simplicity of all-electric drivetrains cuts parts inventory and technician retraining costs, which resonates with resource-constrained agencies. As regulatory language tightens around zero-tailpipe-emissions requirements, PHEV eligibility for subsidies declines, further squeezing market share. Consequently, cell makers increasingly tailor chemistries and form factors exclusively for BEV duty cycles, reinforcing their dominance.
LFP retained a 57.02% share in 2025, given its cost leadership and thermal stability, yet LMFP's 13.97% CAGR positions it as the fastest-rising alternative. The electric bus battery pack market size attributable to LMFP could exceed further by 2031 if current trajectories persist.
LMFP's manganese doping increases energy density while retaining cobalt-free status, making it suitable for articulated buses that need range without flammable solvents. Cold-weather resilience furthers penetration in Northern Europe and Canada. Meanwhile, NMC and NCA chemistries retreat to niche high-power applications amid volatility in metal prices. Suppliers investing in dual-chemistry production lines hedge demand shifts and ensure stable utilization rates.
Geography Analysis
Asia-Pacific preserved 63.22% of global volume in 2025 due to China's scale economics, India's FAME II incentives, and South Korea's advanced cell manufacturing. Regional governments bundle bus orders with local-content rules, channeling demand to domestic factories and shortening lead times. Integrated supply chains spanning lithium processing in Sichuan to pack assembly in Guangdong compress unit costs, granting regional suppliers a decisive pricing edge. Furthermore, large-city pilot programs in Indonesia and Thailand showcase fast-charge depots co-located with metro hubs, encouraging replication across Southeast Asia.
South America logs the fastest 15.12% CAGR through 2031 as Brazil, Colombia, and Chile earmark climate-finance funds for clean transit. BYD and Yutong establish knock-down kit plants to bypass import tariffs, while local lithium reserves in Argentina attract cathode refiners. Multilateral banks underwrite charging infrastructure, mitigating sovereign risk, and unlocking low-interest equipment loans. As pack costs slide, even mid-sized cities like Medellin initiate full fleet conversions, signaling a second adoption wave beyond capital metros.
Europe and North America exhibit mature adoption curves yet sustain steady replenishment demand as first-generation buses approach mid-life battery swaps. The EU Green Deal funnels cohesion funds into depot upgrades, and the United States federal grants subsidize bus prices for low-income jurisdictions. These regions prioritize advanced features such as vehicle-to-grid capability and collision-safe pack enclosures, raising average selling prices. Nevertheless, domestic content stipulations encourage joint ventures to localize pack manufacturing, reshaping supply footprints.
- BYD Company Ltd.
- Contemporary Amperex Technology Co., Limited (CATL)
- LG Energy Solution, Ltd.
- Samsung SDI Co., Ltd.
- CALB Group Co., Ltd.
- Gotion High-tech Co., Ltd.
- Farasis Energy (Ganzhou) Co. Ltd.
- BMZ Holding GmbH
- Leclanche SA
- Toshiba Corporation
- EVE Energy Co. Ltd.
- SK On Co. Ltd.
- A123 Systems LLC
- Microvast Holdings, Inc.
- Forsee Power S.A.
Additional Benefits:
- The market estimate (ME) sheet in Excel format
- 3 months of analyst support
TABLE OF CONTENTS
1 Introduction
- 1.1 Study Assumptions & Market Definition
- 1.2 Scope of the Study
2 Research Methodology
3 Executive Summary
4 Market Landscape
- 4.1 Market Overview
- 4.2 Key Industry Trends & Metrics
- 4.2.1 Electric Vehicle Sales
- 4.2.2 Electric Vehicle Sales by OEMs
- 4.2.3 Best-selling EV Models
- 4.2.4 OEMs with Preferable Battery Chemistry
- 4.2.5 Battery Pack Price
- 4.2.6 Battery Material Cost
- 4.2.7 Battery Chemistry Price Comparison
- 4.2.8 EV Battery Capacity and Efficiency
- 4.2.9 Upcoming EV Models
- 4.2.10 Cell & Pack Capacity vs Utilization
- 4.3 Market Drivers
- 4.3.1 Zero-Emission-Bus Mandates (United States, EU, China)
- 4.3.2 Declining USD/kWh for LFP + LMFP Chemistries
- 4.3.3 Battery-Leasing and As-A-Service Models Scaling in Asia-Pacific
- 4.3.4 Fleet-Telematics-Driven TCO Analytics Adoption
- 4.3.5 On-Route Megawatt Charging Pilots (EU and United States)
- 4.3.6 Solid-State Prototype Milestones Boost Pack Energy Density
- 4.4 Market Restraints
- 4.4.1 Upstream Critical-Mineral Supply Volatility
- 4.4.2 High-Voltage (Above 800 V) Safety Certification Bottlenecks
- 4.4.3 Urban Grid Constraints on Depot MW-Scale Charging Infrastructure
- 4.4.4 Residual-Value Uncertainty for Second-Life Bus Packs
- 4.5 Value / Supply-Chain Analysis
- 4.6 Regulatory Framework
- 4.6.1 Type Approval & Pack Safety Standards
- 4.6.2 Market Access: Incentives, Local Content & Trade
- 4.6.3 End-of-Life: EPR, Second-Life & Recycling Mandates
- 4.7 Porter's Five Forces
- 4.7.1 Threat of New Entrants
- 4.7.2 Bargaining Power of Suppliers
- 4.7.3 Bargaining Power of Buyers
- 4.7.4 Threat of Substitutes
- 4.7.5 Competitive Rivalry
- 4.8 Technological Outlook
5 Market Size & Growth Forecasts (Value (USD) and Volume (Units))
- 5.1 By Type
- 5.1.1 Mini / Microbus (Below 8 m)
- 5.1.2 Midi (8-10.5 m)
- 5.1.3 Standard (12 m)
- 5.1.4 Articulated (18 m)
- 5.2 By Propulsion Type
- 5.2.1 Battery Electric Vehicle (BEV)
- 5.2.2 Plug-in Hybrid Electric Vehicle (PHEV)
- 5.3 By Battery Chemistry
- 5.3.1 LFP
- 5.3.2 LMFP
- 5.3.3 NMC (111/523/622/712/811)
- 5.3.4 NCA
- 5.3.5 LTO
- 5.3.6 Others
- 5.4 By Capacity
- 5.4.1 Below 15 kWh
- 5.4.2 15-40 kWh
- 5.4.3 40-60 kWh
- 5.4.4 60-80 kWh
- 5.4.5 80-100 kWh
- 5.4.6 100-150 kWh
- 5.4.7 Above 150 kWh
- 5.5 By Battery Form
- 5.5.1 Cylindrical
- 5.5.2 Pouch
- 5.5.3 Prismatic
- 5.6 By Voltage Class
- 5.6.1 Below 400 V (48-350 V)
- 5.6.2 400-600 V
- 5.6.3 600-800 V
- 5.6.4 Above 800 V
- 5.7 By Module Architecture
- 5.7.1 Cell-to-Module (CTM)
- 5.7.2 Cell-to-Pack (CTP)
- 5.7.3 Module-to-Pack (MTP)
- 5.8 By Component
- 5.8.1 Anode
- 5.8.2 Cathode
- 5.8.3 Electrolyte
- 5.8.4 Separator
- 5.9 By Geography
- 5.9.1 North America
- 5.9.1.1 United States
- 5.9.1.2 Canada
- 5.9.1.3 Rest of North America
- 5.9.2 South America
- 5.9.2.1 Brazil
- 5.9.2.2 Colombia
- 5.9.2.3 Chile
- 5.9.2.4 Argentina
- 5.9.2.5 Rest of South America
- 5.9.3 Europe
- 5.9.3.1 Germany
- 5.9.3.2 France
- 5.9.3.3 United Kingdom
- 5.9.3.4 Poland
- 5.9.3.5 Italy
- 5.9.3.6 Sweden
- 5.9.3.7 Hungary
- 5.9.3.8 Spain
- 5.9.3.9 Netherlands
- 5.9.3.10 Russia
- 5.9.3.11 Rest of Europe
- 5.9.4 Asia-Pacific
- 5.9.4.1 China
- 5.9.4.2 India
- 5.9.4.3 Japan
- 5.9.4.4 South Korea
- 5.9.4.5 Thailand
- 5.9.4.6 Indonesia
- 5.9.4.7 Vietnam
- 5.9.4.8 Australia
- 5.9.4.9 Rest of Asia-Pacific
- 5.9.5 Middle East and Africa
- 5.9.5.1 United Arab Emirates
- 5.9.5.2 Saudi Arabia
- 5.9.5.3 Turkey
- 5.9.5.4 South Africa
- 5.9.5.5 Egypt
- 5.9.5.6 Rest of the Middle East and Africa
- 5.9.1 North America
6 Competitive Landscape
- 6.1 Market Concentration
- 6.2 Strategic Moves
- 6.3 Market Share Analysis
- 6.4 Company Profiles (includes Global Level Overview, Market Level Overview, Core Segments, Financials as Available, Strategic Information, Market Rank/Share for Key Companies, Products and Services, SWOT Analysis, and Recent Developments)
- 6.4.1 BYD Company Ltd.
- 6.4.2 Contemporary Amperex Technology Co., Limited (CATL)
- 6.4.3 LG Energy Solution, Ltd.
- 6.4.4 Samsung SDI Co., Ltd.
- 6.4.5 CALB Group Co., Ltd.
- 6.4.6 Gotion High-tech Co., Ltd.
- 6.4.7 Farasis Energy (Ganzhou) Co. Ltd.
- 6.4.8 BMZ Holding GmbH
- 6.4.9 Leclanche SA
- 6.4.10 Toshiba Corporation
- 6.4.11 EVE Energy Co. Ltd.
- 6.4.12 SK On Co. Ltd.
- 6.4.13 A123 Systems LLC
- 6.4.14 Microvast Holdings, Inc.
- 6.4.15 Forsee Power S.A.
7 Market Opportunities & Future Outlook
8 Key Strategic Questions for EV Battery Pack CEOs
9 Who Supplies Whom (OEM-Tier Map)
10 Localization & Cost Stack
- 10.1 BoM Split (USD/kWh)
- 10.2 Local vs Imported Content
- 10.3 Tariff/Subsidy Pass-Through
11 Capacity & Utilization Tracker
- 11.1 Cell GWh (Installed/Under-Build)
- 11.2 Utilization & Bottlenecks
- 11.3 New Plant Pipeline

