
|
시장보고서
상품코드
2066755
섬유 재활용 : 시장 점유율 분석, 업계 동향 및 통계, 성장 예측(2026-2031년)Textile Recycling - Market Share Analysis, Industry Trends & Statistics, Growth Forecasts (2026 - 2031) |
||||||
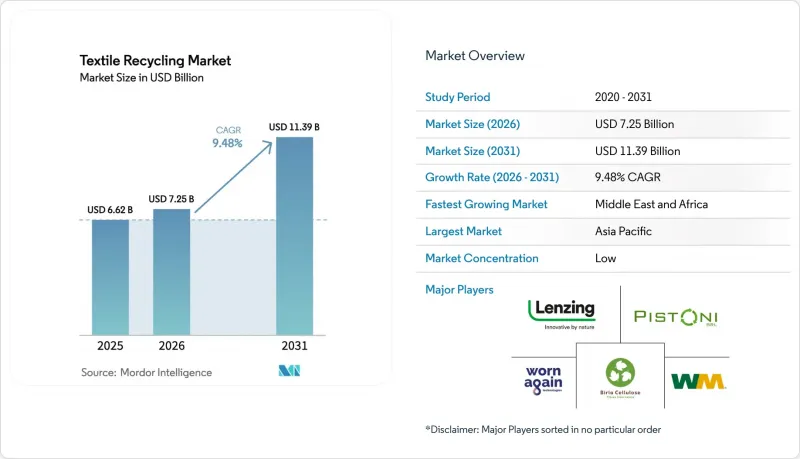
Mordor Intelligence에 의하면, 섬유 재활용 시장 규모는 2025년에 66억 2,000만 달러로 평가되었습니다. 2026년 72억 5,000만 달러에서 2031년까지 113억 9,000만 달러에 이를 것으로 예상되며, 예측 기간(2026-2031년) CAGR은 9.48%를 나타낼 전망입니다.
본 보고서는 소재별(면, 폴리에스터 및 폴리에스터 섬유, 기타), 폐기물 발생원별(생산 전 폐기물 및 소비 후 폐기물), 최종 사용자용도별(의류 및 패션, 산업용, 기타), 재활용 공정별(기계적, 화학적, 기타), 지역별(북미, 남미, 유럽, 아시아태평양, 기타)로 분류되어 있습니다. 시장 전망은 금액(달러) 기준으로 제시되어 있습니다.
세계의 섬유 재활용 시장 동향 및 인사이트
EU의 ‘그린 딜’ 주도로 확대된 생산자 책임(EPR) 도입
2025년 1월부터 EU 전역에서 섬유 제품의 분리 수거가 의무화되었으며, 친환경 요금 제도를 통해 폐기 비용이 생산자에게 전가됩니다. 프랑스에서는 이미 이 제도를 통해 연간 약 1억 유로가 24만 톤의 폐기물을 처리하는 수거 인프라에 투입되고 있습니다. 네덜란드 등 조기에 도입한 국가들은 EU의 목표보다 2년 앞서 재활용률 50%를 달성함으로써, 이 모델의 확장성을 입증하고 있습니다. 캘리포니아주의 SB 707 법안은 이러한 모델을 반영하여, 규제를 회피하는 거래를 방지하고 재활용에 대한 최소 기준을 표준화하고 있습니다. 예측 가능한 수수료 수입 덕분에 프로젝트 리스크가 줄어들면서, 지역 처리 허브의 구축이 가속화되고 있습니다.
2026년까지 재생 섬유 사용률을 50% 이상으로 높이기 위한 패스트 패션 브랜드의 노력
H&M 그룹이 Syre사와 체결한 7년간 6억 달러 규모의 임베디드 계약은 임베디드 보증이 화학 재활용에 대한 투자 위험을 얼마나 완화하고 있는지를 여실히 보여주고 있습니다. Gap Inc.와 Carter’s도 유사한 공급망 목표를 제시하고 있으며, 계약에 따른 총 수요는 20억 달러를 초과합니다. 현재 재생 폴리에스터는 버진 소재에 비해 15-20%의 가격 프리미엄이 붙어 있어, 공급업체의 수익 전망이 밝아지고 있습니다. 장기 계약은 고객 확보 비용을 절감하며, 특히 브랜드가 생산 거점을 집중하고 있는 아시아와 유럽에서 차입금을 통한 시설 건설을 지원합니다.
막대한 설비 투자와 에너지 집약형 화학 플랜트가 상용화를 저해하고 있습니다.
일반적인 플랜트 건설에는 2억-5억 달러가 소요되며, 에너지 수요는 1톤당 15-25GJ에 달하고, 기계적 처리 방식에 비해 5배 규모에 이릅니다. Renewcell사의 2024년 파산은 브랜드와의 제휴가 있었음에도 불구하고 자금 조달의 취약성을 여실히 드러냈습니다. 이스트만사가 수령하고 있던(현재는 취소된) 미국 에너지부의 보조금 등은 정책 지원에 대한 의존도가 높음을 보여줍니다. 자본 집약도가 높기 때문에 프로젝트는 OECD 지역에 집중되는 경향이 있으며, 원자재가 풍부한 신흥 시장에서는 충분한 공급이 이루어지지 않고 있습니다.
부문별 분석
2025년, 폴리에스터는 확립된 PET 공급망과 소비자들의 친숙함을 바탕으로 섬유 재활용 시장의 44.30%를 차지했습니다. 기계적 공정은 투명한 원료 흐름을 효율적으로 처리하는 한편, 화학적 탈중합은 품질 저하 문제를 해결하여 고급 의류 분야에서의 활용을 확대되고 있습니다. 나일론 부문은 높은 인장 강도가 요구되는 자동차용 및 스포츠웨어용 혼방 소재에 힘입어 연평균 성장률(CAGR) 9.41%로 성장하고 있습니다. ECONYL과 같은 기술은 폐쇄형 순환 체계를 촉진하고 있으며, 상용화 준비가 완료되었음을 보여주고 있습니다. 면은 중국에서 정책상의 제약을 받고 있지만, REFIBRA와 같은 혼방 회수 기술을 통해 새로운 틈새 시장이 열리고 있습니다. 울, 실크, 아크릴과 같은 소규모 카테고리도 파일럿 라인을 통해 기술적 실현 가능성이 입증됨에 따라, 브랜드가 원자재 전략을 다각화해 나가면서 진전을 보이고 있습니다.
2025년 기준으로, 사용 후 섬유(포스트컨슈머)는 섬유 재활용 시장의 60.40%를 차지했으며, 이는 매립 처분 금지 의무화와 확립된 자선 단체의 수거 네트워크를 반영한 것입니다. 그러나 공장에서 나오는 잔재물은 성분이 균일하고 회수율이 높으며, 20-30%의 가치 프리미엄이 예상에 따라, 생산 전 폐기물(프리컨슈머) 시장은 연평균 성장률(CAGR) 8.52%로 확대될 것으로 전망됩니다. 2025년에 시행된 EU의 분리수거 규정에 따라, 2030년까지 해당 지역의 사용 후 섬유 폐기물 처리량은 2배로 증가할 것으로 예상되며, 자동 선별 기술이 개선되지 않는 한 이익률은 압박을 받게 될 것입니다. 디지털 여권과 색상별 선별 로봇은 식별 정확도를 높임으로써 잠재적 가치를 이끌어낼 수 있는 새로운 해결책으로 부상하고 있습니다.
지역별 분석
아시아태평양은 2025년에 46.10%의 점유율을 차지하며 섬유 재활용 시장을 주도했습니다. 이는 막대한 섬유 생산량과 대량의 잔여 원단을 배출하는 수출 지향적인 의류 거점에 힘입은 결과입니다. 중국의 2,600만 톤에 달하는 폐기물 발생량은 세계 다른 지역을 압도하고 있지만, 재활용 소재 함유율에 관한 규제로 인해 생산량의 상당 부분이 해외로 유출되면서 국내 수요는 억제되고 있습니다. 베트남은 정책상의 우대 조치와 제조 클러스터와의 근접성 덕분에 기가 스케일 공장 건설지로 주목받고 있습니다. 인도는 인프라 면에서 뒤처져 있어 폐기물 재활용률이 고작 13%에 그치고 있지만, 중앙 정부의 이니셔티브와 민간과의 파트너십이 탄력을 받고 있습니다.
중동 및 아프리카는 연평균 성장률(CAGR) 8.74%를 기록하며, 섬유 재활용 시장에서 가장 빠르게 성장하고 있는 지역입니다. Circulife 등 UAE의 프로그램들은 소매점에서의 수거 활동과 처리 능력을 결합하여, 걸프 지역을 지역 재활용 허브로 자리매김하고 있습니다. 튀르키예는 EU와의 관세동맹 지위를 활용하여 유럽에서 사용된 섬유 베일을 수입한 뒤, 비용 효율적으로 가공하여 실로 재수출함으로써, 두 대규모 소비 지역 사이에 위치해 있으면서도 그동안 충분히 활용되지 못했던 인접 시장을 개척하고 있습니다.
유럽은 섬유 재활용 시장의 규제 측면에서 지표 역할을 하고 있습니다. 2025년부터 시행된 확대 생산자 책임(EPR) 제도의 도입으로 인해, 2030년까지 회수량은 450만-720만 톤에 달할 것으로 예측됩니다. 북미에서는 캘리포니아주의 SB 707과 같은 주 차원의 규제와 연방 정부의 조정 노력이 진행되고 있어, 15억 달러 규모의 ‘파이버 투 파이버’ 시장 기회가 창출될 가능성이 있습니다. 남미에서는 브라질과 칠레에서 막 시작된 프로젝트가, 특히 정부가 재활용을 일자리 창출의 수단으로 여기는 지역에서 높은 관심을 받고 있습니다.
기타 혜택 :
- 엑셀 형식 시장 예측(ME) 시트
- 3개월간의 애널리스트 지원
자주 묻는 질문
목차
제1장 서론
제2장 조사 방법
제3장 주요 요약
제4장 시장 구도
제5장 시장 규모 및 성장 예측
제6장 경쟁 구도
제7장 시장 기회 및 향후 전망
KTH 26.06.29According to Mordor Intelligence, the textile recycling market size was valued at USD 6.62 billion in 2025 and is estimated to grow from USD 7.25 billion in 2026 to reach USD 11.39 billion by 2031, at a CAGR of 9.48% during the forecast period (2026-2031).

This report is Segmented by Material (Cotton, Polyester & Polyester Fiber, and Others), by Waste Source (Pre-Consumer and Post-Consumer), by End-User Application (Apparel & Fashion, Industrial, and Others), by Recycling Process (Mechanical, Chemical, and Others), and by Geography (North America, South America, Europe, Asia-Pacific, and Others). The Market Forecasts are Provided in Terms of Value (USD).
Global Textile Recycling Market Trends and Insights
Green Deal-driven Extended Producer Responsibility Rollout in the EU
Mandatory separate textile collection begins across the bloc in January 2025, shifting disposal costs to producers through eco-modulated fees. France already channels about EUR 100 million a year from its scheme into collection infrastructure that processes 240,000 tons of waste. Early adopters such as the Netherlands hit 50% recycling rates two years ahead of the EU target, demonstrating scalability. California's SB 707 mirrors the model, preventing regulatory arbitrage and standardising minimum recycling thresholds. Predictable fee income lowers project risk, accelerating deployments of regional processing hubs.
Fast-fashion Brand Commitments to >=50% Recycled Fiber by 2026
H&M Group's seven-year USD 600 million offtake deal with Syre underscores how purchase guarantees are derisking chemical-recycling investments. Gap Inc. and Carter's share comparable supply-chain goals, pushing aggregate contracted demand above USD 2 billion. Recycled polyester currently commands 15-20% price premiums over virgin equivalents, strengthening revenue visibility for suppliers. Long-term contracts reduce customer acquisition cost and support debt-financed facility builds, especially in Asia and Europe, where brands maintain production clusters.
High CAPEX & Energy-intensive Chemical Lines Limiting Commercialisation
Typical units require USD 200-500 million, and energy demand ranges from 15-25 GJ per ton, fivefold the mechanical alternative. Renewcell's 2024 bankruptcy illustrated financing fragility despite brand partnerships. Subsidies such as Eastman's now-revoked Department of Energy grant highlight reliance on policy support. Capital intensity often localises projects in OECD regions, leaving feedstock-rich emerging markets underserved.
Other drivers and restraints analyzed in the detailed report include:
- Chemical depolymerisation scale-ups unlocking closed-loop polyester
- China Landfill and Incineration Quotas Forcing Domestic Mill Recycling Investments
- Fiber-blend Contamination Complicating Automated Sorting & Yield
For complete list of drivers and restraints, kindly check the Table Of Contents.
Segment Analysis
Polyester accounted for 44.30% of the textile recycling market in 2025 on the back of established PET supply chains and consumer familiarity. Mechanical processes handle clear streams efficiently, while chemical depolymerisation eliminates quality drop-offs, widening usage in high-end apparel. The nylon segment is expanding at 9.41% CAGR, buoyed by automotive and sportswear blends that demand high tensile strength. Technologies such as ECONYL feed closed-loop loops, signalling commercial readiness. Cotton encounters policy limits in China, but blend-recovery chemistries like REFIBRA open incremental niches. Smaller categories, wool, silk, and acrylic advance as pilot lines prove technical feasibility, and brands diversify raw-material strategies.
Post-consumer streams held a 60.40% share of the textile recycling market in 2025, reflecting landfill diversion mandates and established charity-collection networks. Yet pre-consumer waste is projected to expand at 8.52% CAGR as factory off-cuts deliver uniform composition, higher yields, and 20-30% value premiums. The EU separate-collection rule, effective in 2025, will double regional post-consumer volumes by 2030, squeezing margins unless automated sorting improves. Digital passports and colour-sort robotics are emerging fixes that can unlock latent value by boosting identification accuracy.
Geography Analysis
Asia-Pacific led the textile recycling market with a 46.10% share in 2025, anchored by massive fiber production and export-oriented apparel hubs that generate sizeable scrap volumes. China's 26 million-ton waste stream dwarfs global peers, yet recycled-content restrictions funnel much of the output abroad, muting domestic demand. Vietnam emerges as a preferred build site for gigascale plants because of policy incentives and proximity to manufacturing clusters. India lags on infrastructure: only 13% of waste is reused, but central-government initiatives and private partnerships are gaining traction.
The Middle East and Africa is the fastest-growing region in the textile recycling market at an 8.74% CAGR. UAE programs such as Circulife pair retail-collection drives with processing capacity, positioning the Gulf as a regional recycling hub. Turkey leverages its customs-union status with the EU to import European post-consumer bales, process them cost-effectively and re-export yarns, tapping an under-served adjacency between two large consumption zones.
Europe acts as the regulatory bellwether in the textile recycling market; EPR implementation starting 2025 is projected to lift collected volumes to 4.5-7.2 million tons by 2030. North America follows with state-level mandates like California's SB 707 and federal coordination efforts that could unlock a USD 1.5 billion fiber-to-fiber opportunity. South America's incipient projects in Brazil and Chile illustrate growing interest, especially where governments view recycling as a job-creation lever.
- Lenzing AG
- Birla Cellulose (Aditya Birla)
- Unifi Inc.
- Renewcell AB
- Worn Again Technologies
- Waste Management Inc.
- American Textile Recycling Service
- Boer Group Recycling Solutions
- I:Collect GmbH (I:CO)
- Infinited Fiber Co.
- Eastman Chemical Co. (Naia(TM) Renew)
- Circ LLC
- Carbios SA
- Loop Industries Inc.
- Soex Group
- Textile Recycling International
- Evrnu SPC
- Pistoni SRL
- Gemini Corporation NV
- The Woolmark Company*
Additional Benefits:
- The market estimate (ME) sheet in Excel format
- 3 months of analyst support
TABLE OF CONTENTS
1 Introduction
- 1.1 Study Assumptions & Market Definition
- 1.2 Scope of the Study
2 Research Methodology
3 Executive Summary
4 Market Landscape
- 4.1 Market Overview
- 4.2 Market Drivers
- 4.2.1 Green Deal-Driven Extended Producer Responsibility (EPR) Roll-out in the EU
- 4.2.2 Fast-Fashion Brand Commitments to >=50 % Recycled Fiber by 2026
- 4.2.3 Chemical Depolymerisation Scale-ups Unlocking Closed-Loop Polyester
- 4.2.4 China's Landfill/Incineration Quotas Forcing Domestic Mill Recycling Investments
- 4.2.5 Block-Chain Traceability Platforms (e.g., TextileGenesis) Boosting Brand Acceptance
- 4.2.6 Automotive NVH Demand for Recycled Non-wovens in North America
- 4.3 Market Restraints
- 4.3.1 High-CAPEX & Energy-Intensive Chemical Lines Limiting Commercialisation
- 4.3.2 Fiber-Blend Contamination Complicating Automated Sorting & Yield
- 4.3.3 Absence of Bale-Grade Pricing Benchmarks Dampening Investor Confidence
- 4.3.4 Fragmented Collection Infrastructure in US & Emerging Asia
- 4.4 Value / Supply-Chain Analysis
- 4.5 Regulatory Outlook
- 4.6 Technological Outlook
- 4.7 Industry Attractiveness - Porter's Five Forces
- 4.7.1 Bargaining Power of Suppliers
- 4.7.2 Bargaining Power of Buyers
- 4.7.3 Threat of New Entrants
- 4.7.4 Threat of Substitutes
- 4.7.5 Intensity of Competitive Rivalry
5 Market Size & Growth Forecasts (Value, USD Billion)
- 5.1 By Material
- 5.1.1 Cotton
- 5.1.2 Polyester & Polyester Fiber
- 5.1.3 Wool
- 5.1.4 Nylon & Nylon Fiber
- 5.1.5 Others (Silk, Acrylic, Blends)
- 5.2 By Waste Source
- 5.2.1 Pre-consumer (Factory off-cuts, Yarn waste)
- 5.2.2 Post-consumer (Discarded Garments & Household Textiles)
- 5.3 By Application End-user
- 5.3.1 Apparel & Fashion
- 5.3.2 Industrial (Wipes, Filtration, Safety Gear)
- 5.3.3 Home Furnishings & Carpets
- 5.3.4 Automotive & Transportation
- 5.3.5 Building & Construction
- 5.3.6 Others (Retail/Consumer Products, etc.)
- 5.4 By Recycling Process
- 5.4.1 Mechanical Recycling
- 5.4.2 Chemical Recycling (Depolymerisation, Dissolution)
- 5.4.3 Thermal/Energy Recovery
- 5.5 By Geography
- 5.5.1 North America
- 5.5.1.1 United States
- 5.5.1.2 Canada
- 5.5.1.3 Mexico
- 5.5.2 South America
- 5.5.2.1 Brazil
- 5.5.2.2 Argentina
- 5.5.2.3 Chile
- 5.5.2.4 Rest of South America
- 5.5.3 Europe
- 5.5.3.1 Germany
- 5.5.3.2 United Kingdom
- 5.5.3.3 France
- 5.5.3.4 Italy
- 5.5.3.5 Spain
- 5.5.3.6 BENELUX (Belgium, Netherlands, and Luxembourg)
- 5.5.3.7 NORDICS (Denmark, Finland, Iceland, Norway, and Sweden)
- 5.5.3.8 Rest of Europe
- 5.5.4 Asia-Pacific
- 5.5.4.1 China
- 5.5.4.2 India
- 5.5.4.3 Japan
- 5.5.4.4 South Korea
- 5.5.4.5 ASEAN (Indonesia, Thailand, Philippines, Malaysia, Vietnam)
- 5.5.4.6 Rest of Asia-Pacific
- 5.5.5 Middle East and Africa
- 5.5.5.1 Saudi Arabia
- 5.5.5.2 United Arab Emirates
- 5.5.5.3 Turkey
- 5.5.5.4 South Africa
- 5.5.5.5 Nigeria
- 5.5.5.6 Egypt
- 5.5.5.7 Rest of Middle East and Africa
- 5.5.1 North America
6 Competitive Landscape
- 6.1 Market Concentration
- 6.2 Strategic Moves (M&A, Capacity Adds, Brand Off-take Deals)
- 6.3 Market Share Analysis
- 6.4 Company Profiles {(includes Global level Overview, Market level overview, Core Segments, Financials as available, Strategic Information, Products & Services, and Recent Developments)}
- 6.4.1 Lenzing AG
- 6.4.2 Birla Cellulose (Aditya Birla)
- 6.4.3 Unifi Inc.
- 6.4.4 Renewcell AB
- 6.4.5 Worn Again Technologies
- 6.4.6 Waste Management Inc.
- 6.4.7 American Textile Recycling Service
- 6.4.8 Boer Group Recycling Solutions
- 6.4.9 I:Collect GmbH (I:CO)
- 6.4.10 Infinited Fiber Co.
- 6.4.11 Eastman Chemical Co. (Naia(TM) Renew)
- 6.4.12 Circ LLC
- 6.4.13 Carbios SA
- 6.4.14 Loop Industries Inc.
- 6.4.15 Soex Group
- 6.4.16 Textile Recycling International
- 6.4.17 Evrnu SPC
- 6.4.18 Pistoni SRL
- 6.4.19 Gemini Corporation NV
- 6.4.20 The Woolmark Company*
7 Market Opportunities & Future Outlook
- 7.1 White-space & Unmet-Need Assessment
