
|
시장보고서
상품코드
2066768
운영 기술(OT) 보안 시장 : 시장 점유율 분석, 업계 동향 및 통계, 성장 예측(2026-2031년)Operational Technology (OT) Security - Market Share Analysis, Industry Trends & Statistics, Growth Forecasts (2026 - 2031) |
||||||
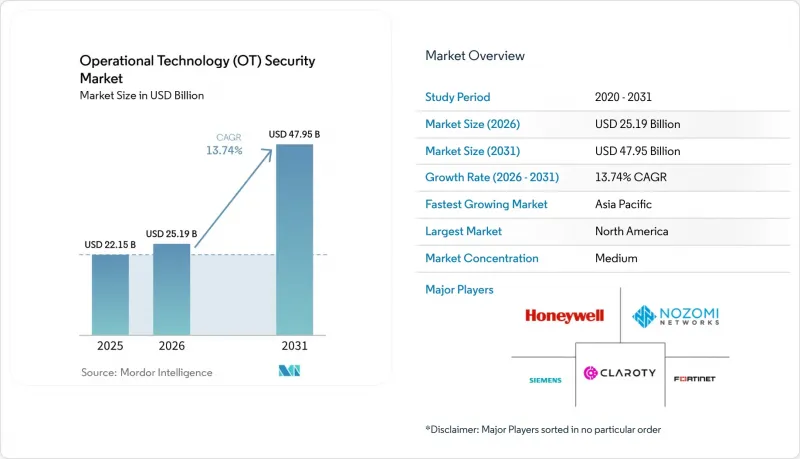
Mordor Intelligence에 의하면, 운영 기술(OT) 보안 시장 규모는 2025년 221억 5,000만 달러로 평가되었고, 2026년에는 251억 9,000만 달러로 추정되고, 2026-2031년 CAGR 13.74%로 성장을 지속할 전망이며, 2031년에는 479억 5,000만 달러에 이를 것으로 예측됩니다.
본 보고서는 구성 요소별(솔루션 및 서비스), 배포 방식별(온프레미스 및 클라우드), 최종 사용자 산업별(제조, 석유 및 가스, 전력, 운송 및 물류, 화학, 기타), 보안 계층별(네트워크 모니터링 및 이상 감지, 엔드포인트/기기 보안, 기타) 및 지역별로 분류되어 있습니다. 시장 전망은 금액(달러) 기준으로 제시되어 있습니다.
세계의 운영 기술(OT) 보안 시장 동향 및 인사이트
중요 인프라를 겨냥한 사이버 공격의 급증
2025년 중반, 한 수도 유틸리티자가 400건의 노출된 웹 인터페이스를 공개한 사실은 보안 대책이 미흡한 산업용 자산의 규모를 여실히 보여주고 있습니다. IOCONTROL과 같은 고도로 정교한 악성코드는 프로그래머블 로직 컨트롤러(PLC)를 표적으로 삼아, 공정 변수를 은밀하게 조작할 수 있게 했습니다. 규칙 기반 시스템에서는 지금까지 본 적 없는 동작을 인식하기 어려웠기 때문에 AI를 활용한 이상 감지 도구의 도입이 확대되었습니다. 가동 중단에 더해, 이러한 공격은 연쇄적인 공급망 혼란을 초래하여 화학 및 운송 등 관련 분야에도 영향을 미쳤습니다.
IT 네트워크와 OT 네트워크의 융합으로 공격 대상 영역이 확대됨
2024년에 기업의 IT 리소스와 공장 네트워크를 통합한 후, 제조업체의 80%에서 보안 사고가 증가했습니다. 클라우드 분석 및 예측 유지보수 워크로드는 생산성을 향상시켰지만, 동시에 인증 기능이 없는 레거시 프로토콜의 취약점을 드러내고 말았습니다. IT와 OT의 전문 지식을 융합한 하이브리드형 보안 운영 센터는 전략적으로 필수적인 요소가 되었으며, 컨트롤러, 센서, 게이트웨이의 실시간 인벤토리를 유지하는 네트워크 세분화 및 자산 감지 엔진에 의해 뒷받침되고 있습니다.
OT 보안 플랫폼의 높은 도입 및 수명 주기 비용
종합적인 OT 보안 프로그램을 운영하려면 하드웨어 센서, 라이선스 비용, 다년간의 유지보수 계약 등 수백만 달러 규모의 지출이 필요합니다. 소규모 전력 사업자들은 도입 비용을 충당하기 위해 2억 5,000만 달러 규모의 ‘농촌 및 지자체 대상 첨단 사이버 보안 보조금’에 의존했습니다. 맞춤형 통합 및 장기간에 걸친 공장 인수 테스트로 인해 총 소유 비용이 증가함에 따라 단계적인 도입이 진행되었으나, 그 과정에서 전환 기간 동안 중요한 자산이 보호받지 못할 우려가 있습니다.
부문별 분석
2025년에는 솔루션이 매출의 62.34%를 차지했습니다. 이는 자산 감지 엔진, 침입 감지 어플라이언스, 세분화 게이트웨이가 모든 OT 보안 시장 프로그램의 기반을 형성하고 있기 때문입니다. 그러나 기업들이 사이버 보안 인력 부족을 메우기 위해 관리형 감지, 사고 대응, 규정 준수 감사에 점점 더 의존하게 됨에 따라, 서비스 부문은 2031년까지 연평균 성장률(CAGR) 17.92%로 확대되고 있습니다. 각 벤더사는 현재 감지까지의 평균 시간(MTD)에 대한 기준을 보장하고, 24시간 SOC 모니터링을 지원하는 성과 기반 계약을 패키지로 제공합니다.
산업 기업들은 사이버 복원력을 자본 프로젝트가 아닌 운영상의 핵심 성과 지표(KPI)로 간주하는 경향이 강해지고 있습니다. 매니지드 OT SOC 서비스는 인력을 증원하지 않고도 확장 가능한 전문 지식을 제공하는 한편, 프로페셔널 서비스 팀은 지멘스, ABB, 에머슨 등 다양한 제조업체의 컨트롤러를 아우르는 제로 트러스트 아키텍처를 맞춤형으로 구축하고 있습니다. 이러한 변화는 플랫폼의 이용 유지율을 뒷받침하는 요인이 되고 있습니다. 지속적인 서비스를 통해 벤더 직원이 공장 내에 상주하게 됨으로써 기술 전환이 억제되고, OT 보안 시장에서 지속적인 수익이 안정화되기 때문입니다.
지연에 대한 민감성과 데이터 주권 관련 규제로 인해 초기 도입 단계에서는 온프레미스 구축이 주류를 이루었으며, 2025년에는 운영 기술(OT) 보안 시장의 70.42%를 차지했습니다. 그러나 각 하이퍼스케일러 기업들이 IEC 62443 및 ISO 27001 인증을 획득함에 따라, 클라우드를 통해 제공되는 분석 및 구성 관리 서비스는 연평균 성장률(CAGR) 20.85%로 확대되고 있습니다. 중소규모 제조업체들은 사용량에 따른 과금 체계를 활용하여 설비 투자를 피하면서도, 첨단 AI 위협 상관관계 분석 엔진을 이용하고 있습니다.
하이브리드 아키텍처가 주류를 이루고 있으며, 기밀성이 높은 공정 변수는 플랜트의 DMZ 내에 보관되는 반면, 암호화된 텔레메트리 데이터는 장기적인 추세 분석, 위협 인텔리전스 강화 및 포렌식 검색을 위해 클라우드 SOC로 행동 지표로 전송됩니다. 신뢰성이 높아짐에 따라 사업자들은 히스토리안 백업, 펌웨어 저장소 및 취약점 스캔 워크로드를 클라우드로 이전하고 있으며, 이러한 추세로 인해 SaaS 플랫폼에 기인한 OT 보안 시장 규모가 확대될 것으로 예측됩니다.
지역별 분석
파이프라인, 식품 가공업체, 지방 상수도국을 대상으로 한 주목할 만한 공격을 계기로, 중요 인프라 방어를 위한 초당파적인 투자가 촉진된 결과, 북미는 2025년 OT(운영 기술) 보안 시장 매출의 38.15%를 차지했으며, 계속해서 주도적인 위치를 유지했습니다. TSA(교통안전청)의 지침에 따라, 에너지 파이프라인 사업자는 SCADA 트래픽을 지속적으로 모니터링하고, 이상 징후가 발생할 경우 12시간 이내에 보고해야 할 의무가 있습니다. 캐나다는 수력 발전 댐을 위한 사이버 보안 프레임워크에 투자한 반면, 멕시코의 자동차 산업 회랑에서는 SOC(보안 운영 센터) 아웃소싱 계약이 증가했습니다.
아시아태평양은 가장 높은 성장세를 보일 것으로 예상되며, 2026-2031년 운영 기술(OT) 보안 시장 규모는 연평균 성장률(CAGR) 19.75%로 성장할 전망입니다. 중국은 5G 연결 센서를 활용해 석유화학 및 철도 시스템을 현대화했으며, 인도는 발전소 및 스마트시티 프로젝트에 대해 CERT-In에 사고 보고를 의무화했고, 일본은 지정학적 혼란에 대비해 원자력 발전소의 제어 시스템을 강화했습니다. 아세안(ASEAN) 국가들은 외국인 직접 투자를 활용하고, 프로젝트 초기 단계부터 IEC 62443에 기반한 평가를 도입함으로써 기존 시스템 개조에 수반되는 과제를 피할 수 있었습니다.
유럽에서는 NIS2 지침에 따라 규정 준수 대상 범위가 수천 개의 중견 산업 기업으로 확대됨에 따라 꾸준한 성장세가 유지되었습니다. 독일에서는 ‘보안 설계(Secure by Design)’ 방식의 PLC를 도입하는 중소 기계 제조업체를 대상으로 국가 차원의 보조금이 마련되었으며, 영국의 중요 국가 인프라 센터(CNIC)는 보안이 확보된 원격 접속 게이트웨이 조달 체크리스트를 공개했고, 이탈리아는 재생에너지 통합을 가속화하며, 보안성이 확보된 인버터의 원격 측정(텔레메트리)을 의무화했습니다. 동유럽의 전력 회사들은 구형 변전소의 세분화을 우선시함으로써, 운영 기술(OT) 보안 시장의 지역적 수요를 끌어올렸습니다.
기타 혜택 :
- 엑셀 형식 시장 예측(ME) 시트
- 3개월간의 애널리스트 지원
자주 묻는 질문
목차
제1장 서론
제2장 조사 방법
제3장 주요 요약
제4장 시장 구도
제5장 시장 규모 및 성장 예측
제6장 경쟁 구도
제7장 시장 기회 및 향후 전망
AJY 26.06.30According to Mordor Intelligence, the operational technology (OT) security market size is expected to grow from USD 22.15 billion in 2025 to USD 25.19 billion in 2026 and is forecast to reach USD 47.95 billion by 2031 at 13.74% CAGR over 2026-2031.

This report is Segmented by Component (Solutions, and Services), Deployment Mode (On-Premise, and Cloud), End-User Industry (Manufacturing, Oil and Gas, Power Utilities, Transportation and Logistics, Chemicals, and More), Security Layer (Network Monitoring and Anomaly Detection, Endpoint/Device Security, and More), and Geography. The Market Forecasts are Provided in Terms of Value (USD).
Global Operational Technology (OT) Security Market Trends and Insights
Surge in Cyber-Attacks on Critical Infrastructure
Water utilities disclosed 400 exposed web interfaces in mid-2025, illustrating the scale of unsecured industrial assets. Sophisticated malware such as IOCONTROL targeted programmable logic controllers to enable covert manipulation of process variables. AI-driven anomaly-detection tools gained traction because rule-based systems struggled to recognize previously unseen behaviours. Beyond operational downtime, attacks produced cascading supply-chain disruption that affected adjacent sectors such as chemicals and transport.
Convergence of IT and OT Networks Expanding Attack Surface
Eighty percent of manufacturers experienced more security incidents after integrating enterprise IT resources with plant networks in 2024. Cloud analytics and predictive-maintenance workloads improved productivity but simultaneously exposed legacy protocols lacking authentication. Hybrid security operations centres that fuse IT and OT expertise became a strategic imperative, supported by network segmentation and asset-discovery engines that maintain real-time inventories of controllers, sensors, and gateways.
High Implementation and Lifecycle Cost of OT Security Platforms
Comprehensive OT security programs require multi-million-dollar outlays spanning hardware sensors, license fees, and multi-year maintenance contracts. Smaller electric utilities relied on the USD 250 million Rural and Municipal Advanced Cybersecurity Grant to offset adoption costs. Custom integration and prolonged factory-acceptance testing inflated the total cost of ownership, encouraging phased rollouts that can leave critical assets unprotected during transition.
Other drivers and restraints analyzed in the detailed report include:
- Stricter Global/Regional Regulations and Standards
- Rapid Industry 4.0 / IIoT Adoption in Process Industries
- Legacy System and Protocol Compatibility Limitations
For complete list of drivers and restraints, kindly check the Table Of Contents.
Segment Analysis
Solutions accounted for 62.34% revenue in 2025 because asset-discovery engines, intrusion-detection appliances, and segmentation gateways form the backbone of any operational technology security market program. However, services are rising at an 17.92% CAGR through 2031 as operators lean on managed detection, incident response, and compliance audits to offset the cyber-talent gap. Vendors now bundle outcome-based contracts that guarantee mean-time-to-detect thresholds and support around-the-clock SOC monitoring.
Industrial firms increasingly treat cyber resilience as an operational key-performance indicator rather than a capital project. Managed OT SOC offerings deliver scalable expertise without inflating headcount, while professional-services teams customize zero-trust architectures across heterogeneous controllers from Siemens, ABB, and Emerson. This shift underpins platform stickiness because continuous services embed vendor staff inside plants, discouraging technology swaps and stabilizing recurring revenue within the operational technology (OT) security market.
On-premises deployments dominated early rollouts due to latency sensitivities and data-sovereignty rules, capturing 70.42% share of the operational technology (OT) security market in 2025. Yet cloud-delivered analytics and configuration management are expanding at a 20.85% CAGR as hyperscalers achieve IEC 62443 and ISO 27001 certifications. Smaller manufacturers leverage consumption-based pricing to avoid capital expenditure while accessing advanced AI threat-correlation engines.
Hybrid architectures prevail, sensitive process variables remain inside the plant DMZ, whereas encrypted telemetry feeds behavioural indicators to cloud SOCs for long-term trending, threat-intelligence enrichment, and forensic search. As confidence grows, operators migrate historian backups, firmware repositories, and vulnerability-scanning workloads to the cloud, a trend expected to raise the operational technology security market size attributable to SaaS platforms.
Geography Analysis
North America retained leadership with 38.15% share of the operational technology (OT) security market's 2025 revenue after headline attacks on pipelines, food processors, and local water districts drove bipartisan investment in critical-infrastructure defense. TSA directives obligate energy-pipeline operators to continuously monitor SCADA traffic and report anomalies within 12 hours. Canada invested in cybersecurity frameworks for hydroelectric dams, while Mexican automotive corridors boosted SOC outsourcing agreements.
Asia-Pacific delivered the highest growth trajectory, with the operational technology security market size expanding at a 19.75% CAGR between 2026-2031. China modernized its petrochemical and rail systems with 5 G-connected sensors, India mandated CERT-In incident reporting for power plants and smart-city projects, and Japan reinforced its nuclear-plant control systems against geopolitical disruption. ASEAN countries leveraged foreign direct investment to incorporate IEC 62443 assessments from project inception, sidestepping legacy-retrofit challenges.
Europe maintained steady momentum as the NIS2 Directive widened compliance scope to thousands of medium-sized industrial firms. Germany established state subsidies for SME machine-builders adopting secure-by-design PLCs, the UK's Critical National Infrastructure Centre published procurement checklists for secure remote-access gateways, and Italy accelerated renewables integration, demanding secure inverter telemetry. Eastern European utilities prioritized the segmentation of legacy substations, lifting regional demand within the operational technology security market.
- Fortinet, Inc.
- Nozomi Networks Inc.
- Claroty Ltd.
- Honeywell International Inc.
- Siemens Aktiengesellschaft (Siemens AG)
- Schneider Electric SE
- Rockwell Automation, Inc.
- GE Vernova LLC
- Darktrace Holdings Limited
- Palo Alto Networks, Inc.
- Cisco Systems, Inc.
- International Business Machines Corporation
- Dragos, Inc.
- Tenable, Inc.
- Armis Security Ltd.
- Forescout Technologies, Inc.
- Check Point Software Technologies Ltd.
- Microsoft Corporation
- Waterfall Security Solutions Ltd.
- OPSWAT, Inc.
- Radiflow Ltd.
- Indegy Ltd. (now part of Tenable, Inc.)
- BAE Systems plc
- Tripwire, Inc.
- AO Kaspersky Lab
Additional Benefits:
- The market estimate (ME) sheet in Excel format
- 3 months of analyst support
TABLE OF CONTENTS
1 INTRODUCTION
- 1.1 Study Assumptions and Market Definition
- 1.2 Scope of the Study
2 RESEARCH METHODOLOGY
3 EXECUTIVE SUMMARY
4 MARKET LANDSCAPE
- 4.1 Market Overview
- 4.2 Market Drivers
- 4.2.1 Surge in cyber-attacks on critical infrastructure
- 4.2.2 Convergence of IT and OT networks expanding attack surface
- 4.2.3 Stricter global/regional regulations and standards (e.g., NIS2, TSA SD02C)
- 4.2.4 Rapid Industry 4.0 / IIoT adoption in process industries
- 4.2.5 Insurance underwriting requirements linking premiums to OT-security posture
- 4.2.6 Emergence of plant-level zero-trust reference architectures
- 4.3 Market Restraints
- 4.3.1 High implementation and lifecycle cost of OT security platforms
- 4.3.2 Legacy system and protocol compatibility limitations
- 4.3.3 Budget deprioritisation at small / mid-size industrial sites
- 4.3.4 Shortage of OT-specific cyber-talent and field engineers
- 4.4 Value Chain Analysis
- 4.5 Regulatory Landscape (IEC 62443, NIS2, TSA, CISA, ISA/IEC-99)
- 4.6 Technological Outlook (AI-driven anomaly detection, 5G campus networks, TSN)
- 4.7 Porter's Five Forces Analysis
- 4.7.1 Threat of New Entrants
- 4.7.2 Bargaining Power of Buyers
- 4.7.3 Bargaining Power of Suppliers
- 4.7.4 Threat of Substitutes
- 4.7.5 Intensity of Competitive Rivalry
- 4.8 Macroeconomic Impact Assessment
5 MARKET SIZE AND GROWTH FORECASTS (VALUE)
- 5.1 By Component
- 5.1.1 Solutions
- 5.1.2 Services
- 5.2 By Deployment Mode
- 5.2.1 On-Premises
- 5.2.2 Cloud
- 5.3 By End-User Industry
- 5.3.1 Manufacturing
- 5.3.2 Oil and Gas
- 5.3.3 Power Utilities
- 5.3.4 Transportation and Logistics
- 5.3.5 Chemicals and Pharma
- 5.3.6 Mining and Metals
- 5.4 By Security Layer
- 5.4.1 Network Monitoring and Anomaly Detection
- 5.4.2 Endpoint / Device Security
- 5.4.3 Identity and Access Management
- 5.4.4 Secure Remote Access and Segmentation Gateways
- 5.4.5 Governance, Risk and Compliance Platforms
- 5.5 By Geography
- 5.5.1 North America
- 5.5.1.1 United States
- 5.5.1.2 Canada
- 5.5.1.3 Mexico
- 5.5.2 South America
- 5.5.2.1 Brazil
- 5.5.2.2 Argentina
- 5.5.2.3 Rest of South America
- 5.5.3 Europe
- 5.5.3.1 Germany
- 5.5.3.2 United Kingdom
- 5.5.3.3 France
- 5.5.3.4 Italy
- 5.5.3.5 Spain
- 5.5.3.6 Nordics
- 5.5.3.7 Benelux
- 5.5.3.8 Russia
- 5.5.3.9 Rest of Europe
- 5.5.4 Asia-Pacific
- 5.5.4.1 China
- 5.5.4.2 Japan
- 5.5.4.3 India
- 5.5.4.4 South Korea
- 5.5.4.5 ASEAN
- 5.5.4.6 Rest of Asia-Pacific
- 5.5.5 Middle East and Africa
- 5.5.5.1 Middle East
- 5.5.5.1.1 GCC
- 5.5.5.1.2 Turkey
- 5.5.5.1.3 Israel
- 5.5.5.1.4 Rest of Middle East
- 5.5.5.2 Africa
- 5.5.5.2.1 South Africa
- 5.5.5.2.2 Rest of Africa
- 5.5.5.1 Middle East
- 5.5.1 North America
6 COMPETITIVE LANDSCAPE
- 6.1 Market Concentration Analysis
- 6.2 Strategic Moves and Funding Landscape
- 6.3 Market Share Analysis
- 6.4 Company Profiles (includes Global-level Overview, Market-level Overview, Core Segments, Financials as available, Strategic Information, Market Rank/Share for key companies, Products and Services, and Recent Developments)
- 6.4.1 Fortinet, Inc.
- 6.4.2 Nozomi Networks Inc.
- 6.4.3 Claroty Ltd.
- 6.4.4 Honeywell International Inc.
- 6.4.5 Siemens Aktiengesellschaft (Siemens AG)
- 6.4.6 Schneider Electric SE
- 6.4.7 Rockwell Automation, Inc.
- 6.4.8 GE Vernova LLC
- 6.4.9 Darktrace Holdings Limited
- 6.4.10 Palo Alto Networks, Inc.
- 6.4.11 Cisco Systems, Inc.
- 6.4.12 International Business Machines Corporation
- 6.4.13 Dragos, Inc.
- 6.4.14 Tenable, Inc.
- 6.4.15 Armis Security Ltd.
- 6.4.16 Forescout Technologies, Inc.
- 6.4.17 Check Point Software Technologies Ltd.
- 6.4.18 Microsoft Corporation
- 6.4.19 Waterfall Security Solutions Ltd.
- 6.4.20 OPSWAT, Inc.
- 6.4.21 Radiflow Ltd.
- 6.4.22 Indegy Ltd. (now part of Tenable, Inc.)
- 6.4.23 BAE Systems plc
- 6.4.24 Tripwire, Inc.
- 6.4.25 AO Kaspersky Lab
7 MARKET OPPORTUNITIES AND FUTURE OUTLOOK
- 7.1 White-space and Unmet-need Assessment

