
|
시장보고서
상품코드
2066769
건설 및 해체 폐기물 관리 시장 : 시장 점유율 분석, 업계 동향 및 통계, 성장 예측(2026-2031년)Construction And Demolition Waste Management - Market Share Analysis, Industry Trends & Statistics, Growth Forecasts (2026 - 2031) |
||||||
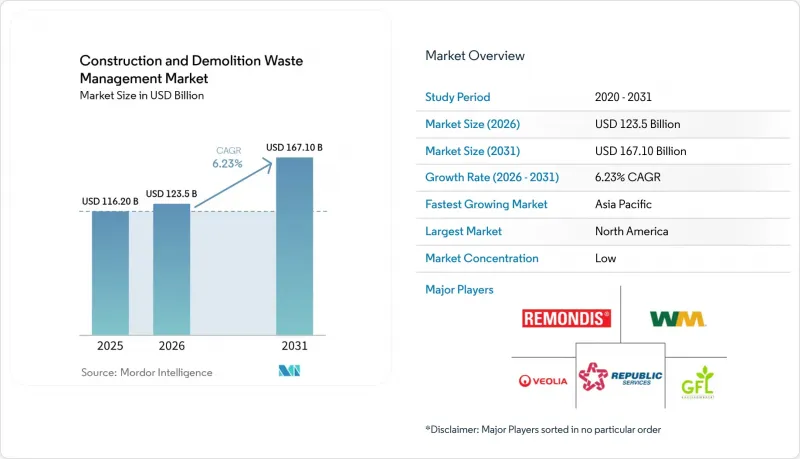
Mordor Intelligence에 의하면, 건설 및 해체 폐기물 관리 시장 규모는 2025년에 1,162억 달러로 평가되었고, 2026년 1,235억 달러로 추정되고, 2031년까지 1,671억 달러에 이를 것으로 추정되며, 예측 기간(2026-2031년) CAGR은 6.23%를 나타낼 전망입니다.
본 보고서는 폐기물 유형별(비유해 폐기물, 유해 폐기물), 소재별(콘크리트·벽돌, 아스팔트, 금속, 목재, 흙·모래, 석고, 기타), 서비스별(수집·운반, 선별·분리, 재활용, 매립), 지역별(북미, 남미, 유럽, 아시아태평양, 중동 및 아프리카)로 분류되어 있습니다. 시장 전망치는 금액(달러) 단위로 제시되어 있습니다.
세계의 건설 및 철거 폐기물 관리 시장 동향과 인사이트
폐기물 선별, 처리 및 재활용 장비 분야의 기술적 진보
자동화와 AI는 광물 성분과 비광물 성분의 식별 정확도, 순도 및 일관성을 향상시킴으로써, 혼합 건설 및 해체 폐기물 회수 분야의 경제성을 재정의하고 있습니다. Terex사의 ZenRobotics 4세대 시스템은 식별 능력을 500개 이상의 폐기물 범주로 확대하고, 분당 최대 80회의 피킹을 실현했습니다. 이를 통해 플라스틱과 목재의 유동을 대규모로, 그리고 더욱 깨끗하게 분리할 수 있게 되었습니다. 아알토 대학교의 조사에 따르면, 근로자의 연간 임금이 2만 980유로를 초과하는 경우, 컴퓨터 비전을 활용한 자동 선별을 통해 비교 비용을 27% 절감할 수 있으며, 기존 생산 라인에 비해 필요한 인력을 91.7% 줄일 수 있는 것으로 밝혀져, 시설 차원의 수익성이 향상되었습니다. 디지털화는 고부하 용도에서의 처리 능력도 향상시키고 있으며, HAZEMAG사의 ‘Recycling Plant 4.0’은 시간당 300톤에 달하며, 최종 시장의 품질 요건을 충족하기 위해 레시피 관리 및 벨트 계량 등의 분석 기능을 탑재하고 있습니다. 부적절하게 관리된 폐기물 흐름으로 인한 전 세계적 외부성 비용이 막대하기 때문에 오염 문제에 대처하는 것은 매우 중요합니다. 현재 로봇 센서는 목재 표면의 도료와 같은 미묘한 특징을 식별하여 재사용 과정을 개선하고 있습니다.
폐기물 감축 및 재활용에 관한 엄격한 정부 규제 및 정책
2024-2026년 규제 당국이 폐기물 재활용 목표를 허가 및 공공 조달 과정에서 내재된 탄소 배출량 보고 및 추적성 요건과 연계함에 따라 정책 환경은 한층 더 엄격해졌습니다. EU의 개정 건설제품규정에서는 탄소 지표를 포함한 환경제품선언(EPD)을 의무화하고 있으며, 해당 지역의 경쟁력 향상 계획에서는 순환형 자재 사용률을 2024년 12.2%에서 2030년까지 24%로 두 배로 늘리는 것을 목표로 하고 있습니다. 가맹국들은 골재, 콘크리트, 소성 점토 벽돌, 석고 등 잠재력이 높은 폐기물 흐름에 대해 폐기물 처리 기준의 조화를 도모하고, 2차 자재에 대한 신뢰를 구축하고자 하고 있습니다. 미국에서는 SWIFR 보조금 수혜자가 건설·해체 폐기물(C&D)의 수거량, 재활용량, 관리량을 재료 유형별로 보고할 의무가 있으며, 이를 통해 회수 성과 측정과 설명 책임이 강화되고 있습니다. 중국의 ‘순환 경제에 관한 제14차 5개년 계획’에서는 재활용 비철금속에 대한 목표가 설정되어 있으며, 2025년까지 자원 재활용 산업의 규모를 5조 위안(6,944억 달러)으로 확대하겠다는 목표가 제시되어 있습니다. 이는 인프라 사업 분야에서 회수 자재에 대한 지속적인 수요가 있을 것임을 시사하는 것입니다.
폐기물 관리 인프라 및 설비에 대한 막대한 초기 투자
건설 및 해체 폐기물의 수거, 이송, 선별, 처리에 드는 자본 집약도는 많은 지역, 특히 매립 처리 비용이 낮고 상품 스프레드가 좁은 지역에서 여전히 가장 큰 장벽으로 남아 있습니다. 최근의 공적 자금 지원 프로그램은 보조금이나 성과 연계형 교부금을 통해 초기 비용의 장벽을 낮추도록 설계되어 있지만, 수년에 걸친 자금 출자 약속이나 보고 의무는 지방 자치단체와 민간 사업자에게 복잡성을 가중시키는 요인이 되고 있습니다. 현재 인도네시아의 30개 지방 자치단체에서 시행되고 있는 성과 연계형 보조금 방식은 실행 능력에 차이가 있음에도 불구하고 자본을 발생원별 분류 및 비용 회수와 어떻게 연계할 수 있는지를 보여주고 있습니다. 라오스 인민민주공화국의 국가 프로그램 역시 설비, 이송 시설, 매립지의 개보수와 비정규직 근로자에 대한 교육을 병행하고 있습니다. 이는 도입에 필수적이지만, 가동 시작까지의 리드타임을 연장하게 됩니다. 선진 시장에서는 AI 선별기나 처리 능력이 높은 생산 라인에 막대한 자본이 필요하지만, 디지털화를 통한 학습 곡선과 운영 비용 절감으로 인해 실현 가능성의 격차는 서서히 좁혀지고 있습니다.
부문별 분석
2025년에는 비유해성 폐기물이 97.67%를 차지했으나, 유해성 폐기물은 2.33%에 그쳤음에도 불구하고 2031년까지의 연평균 성장률(CAGR)은 7.21%로 가장 높은 성장세를 기록할 전망입니다. 이는 노후화된 건물이나 인프라에 사용된 과거의 자재에 대한 관심이 높아지고 있음을 반영하고 있습니다. 이러한 구조로 인해 건설 및 해체 폐기물 관리 시장은 여전히 대량의 광물 분리 작업에 중점을 두고 있는 반면, 규정 준수 체제의 강화로 인해 철거 작업 시 석면, 납, PCB에 대한 감시가 더욱 엄격해지고 있습니다. 지역별 허가 제도나 매립지 수용 규정에 따라 인증, 신고, 전문적인 처리, 일정 관리에 대한 요구가 점점 더 높아지고 있으며, 이러한 조치들은 유해 물질의 안전한 운송 경로 확보와 서류 작성을 지원하고 있습니다. 예약제 운영이나 포장 기준과 같은 군 차원의 조치 역시 유해 폐기물 흐름에 관한 운영상의 안전 대책을 반영하고 있습니다. 연방 정부의 프로젝트 명세서에서는 유해 폐기물의 혼입을 유발할 가능성이 있는 현장 활동을 제한하도록 규정하고 있으며, 이에 따라 건설 및 해체 폐기물 관리 업계 전반에 걸쳐 재활용률 산정 및 도급업체의 보고에 대한 기준이 강화되고 있습니다.
비유해 폐기물 분야에서는 기술과 공정의 개선을 통해 생산물의 품질과 시장성이 향상되고 있습니다. 수성 밀도 선별 및 지깅 시스템을 통해 고순도의 광물 분획이 실현되어, 도로 노반 및 구조물 용도로 사용하는 최종 사용자에게 중요한 성능 지표가 향상되고 있습니다. 선택적 해체 및 품질 보증(QA)에 관한 기준과 프로토콜은 재활용 자재에 대한 신뢰를 조성하고 있으며, 이를 통해 건설 및 해체 폐기물 관리 시장에서 부가가치가 더 높은 재사용이 촉진되고, 다운사이클링의 위험이 줄어들고 있습니다. 디지털 보고 프레임워크를 통해 오염 관리가 강화되어, 본래 재활용이 가능한 광물 흐름에 유해 성분이 혼입되지 않도록 보장되고 있습니다. 이러한 조치들이 종합적으로 작용하여 이 부문의 견고한 기반을 유지하는 동시에, 규제 압력과 표적화된 인프라 확충을 통해 낮은 기준선에서 더욱 급속한 성장이 예상되는 소규모 유해 폐기물 부문에 대한 투자를 유도하고 있습니다.
지역별 분석
2025년 현재 북미는 34.12%의 점유율을 차지했으며, 이는 성숙한 허가·인가 제도, 지역별 폐기물 재활용 의무, 그리고 프로젝트 수행 시 디지털 규정 준수 도구의 활용 확대가 복합적으로 작용한 결과입니다. 연방 및 주 정부의 지침에서는 자본 보조금을 측정 가능한 폐기물 재활용 실적과 연계하고 있으며, 이를 통해 보고 절차가 효율화되고, 여전히 과제가 남아 있는 지역에서의 설비 도입이 확대되고 있습니다. 군 및 시 차원의 프로그램에서는 환불 가능한 보증금 제도, 제3자에 의한 시설 인증, 그리고 계획 승인이 도입되어 있으며, 이러한 조치들은 현장의 실행력을 향상시키고 하류 시설에 대한 신뢰도를 높이고 있습니다. 지역 차원에서는 각 협회가 서비스 범위를 확대하고, 자재 흐름을 내부화하기 위한 새로운 MRF(재활용 선별 시설) 및 중계 시설에 대한 투자를 강조하고 있습니다. 이러한 요소들이 복합적으로 작용하여, 북미의 건설 및 철거 폐기물 관리 시장 전반에 걸쳐 자원 회수 인프라와 분석 체계가 강화되고 있습니다.
아시아태평양은 대규모 건설 활동, 급속한 도시화, 주요 국가들의 정책 체계 확충에 힘입어 연평균 성장률(CAGR) 7.82%를 나타낼 것으로 전망되며, 가장 빠르게 성장하고 있는 지역입니다. 중국에서는 2024년에 24억 1,000만 톤의 건설 폐기물이 발생했으며, 이는 도시 고형 폐기물의 25.9%를 차지하고 있어, 국가 및 도시 차원의 프로그램이 수거를 지원해야 할 만큼 그 규모가 크다는 것을 보여줍니다. 정책적 동향으로는 ‘제14차 5개년 계획’에서 자원 재활용 산업 시장 규모를 5조 위안(6,944억 달러)으로 설정하는 목표가 제시되어 있으며, 도시 차원의 실적 범위를 살펴보면 이용 효율을 더욱 높일 여지가 있는 것으로 나타났습니다. 일본의 ‘건설자재 재활용법’에 따른 콘크리트 재활용률 97%나 싱가포르의 ‘그린마크’에서 규정하는 재활용 소재 함유율 크레딧은 사양과 평가 기준이 순환형 자재공급과 프로젝트 목표를 어떻게 조화시키고 있는지를 보여줍니다. 동남아시아에서 세계은행이 지원하는 프로그램에서는 분리수거 및 폐기물 재활용을 지원하는 성과 연계형 보조금과 비용 회수 조치를 통해 도시 차원의 서비스를 확대되고 있습니다.
유럽의 체계는 높은 회수율과 폐기물 종결 기준, 그리고 환경 제품 선언(EPD)에 관한 기준의 조화가 점차 진전되고 있는 데 힘입어, 이로 인해 이차 원료에 대한 국경을 초월한 신뢰가 높아지고 있습니다. 이 지역은 2024년 12.2%에서 2030년까지 순환형 자재 사용률을 24%로 높이는 것을 목표로 하고 있으며, 해당 대상 범위 내에서 건설 및 해체 폐기물이 가장 큰 비중을 차지하고 있습니다. 현재 진행 중인 ‘폐기물 종결 기준’ 관련 노력에서는 골재, 콘크리트, 벽돌, 석고가 우선순위로 다루어지고 있으며, 이는 유럽의 건설 및 해체 폐기물 관리 시장 규모를 주도하는 광물 성분과 일치합니다. EU가 자금을 지원한 시범 사업에서는 BIM, 비파괴 검사, AI 평가를 연계하는 구조적 요소와 디지털 도구가 검증되었으며, 사양 수립자 및 건축 기준 담당자에게 중요한 품질 보증(QA) 기법이 발전하고 있습니다. 정책 및 기준의 동향은 매립보다는 고부가가치 재활용을 지속적으로 지지하고 있으며, 회원국들은 재활용 자재의 사용을 장려하기 위해 세제 및 조달 정책을 조정하고 있습니다.
기타 혜택 :
- 엑셀 형식 시장 예측(ME) 시트
- 3개월간의 애널리스트 지원
자주 묻는 질문
목차
제1장 서론
제2장 조사 방법
제3장 주요 요약
제4장 시장 구도
제5장 시장 규모 및 성장 예측(금액 기준, 수량 데이터가 있는 경우는 병기)
제6장 경쟁 구도
제7장 시장 기회 및 향후 전망
AJY 26.06.30According to Mordor Intelligence, the construction and demolition waste management market size was valued at USD 116.20 billion in 2025 and is estimated to grow from USD 123.5 billion in 2026 to reach USD 167.10 billion by 2031, at a CAGR of 6.23% during the forecast period (2026-2031).

This report is Segmented by Waste Type (Non-Hazardous, Hazardous), by Material (Concrete & Bricks, Asphalt, Metal, Timber, Soil & Sand, Gypsum, Others), by Service (Collection & Transportation, Sorting & Segregation, Recycling, Landfilling), and by Geography (North America, South America, Europe, Asia Pacific, Middle East and Africa). Market Forecasts are Provided in Value (USD).
Global Construction And Demolition Waste Management Market Trends and Insights
Technological Advancements in Waste Sorting, Processing, and Recycling Equipment
Automation and AI are redefining the economics of mixed C&D recovery by improving recognition, purity, and consistency across mineral and non-mineral fractions. Terex's ZenRobotics fourth-generation systems raised identification capabilities to more than 500 waste categories and achieved up to 80 picks per minute, which enables cleaner separation of plastics and wood streams at scale. Aalto University research found that computer vision-enabled automated sorting cut comparative costs by 27% when labor wages exceeded EUR 20,980 annually and reduced workforce requirements by 91.7% versus conventional lines, improving facility-level viability. Digitalization is also raising throughput in heavy-duty applications, with HAZEMAG's Recycling Plant 4.0 reaching 300 tonnes per hour and embedding analytics such as recipe management and belt weighing to match end-market quality needs. Addressing contamination is critical because the global externality cost of mismanaged waste flows has been significant, and robotic sensors now distinguish nuanced features like paint on wood to improve reuse pathways.
Stringent Government Regulations and Policies for Waste Reduction and Recycling
The policy environment intensified in 2024-2026 as regulators linked diversion targets to embodied carbon reporting and traceability requirements in permits and public procurement. The EU's revised Construction Products Regulation mandates Environmental Product Declarations with carbon indicators, while the region's competitiveness agenda targets doubling the circular material use rate to 24% by 2030 from 12.2% in 2024. Member States are working toward harmonized end-of-waste criteria for high-potential streams such as aggregates, concrete, fired clay bricks, and gypsum to build confidence in secondary materials. In the United States, SWIFR grants require grantees to report C&D tonnages collected, recycled, and managed by material type, which strengthens measurement and accountability for recovery outcomes. China's 14th Five-Year Plan on Circular Economy sets targets for recycled non-ferrous metals and a resource recycling industry valued at RMB 5 trillion (USD 694.4 billion) by 2025, signaling sustained demand for recovered materials in infrastructure programs.
High Initial Capital Investment for Waste Management Infrastructure and Equipment
Capital intensity for C&D collection, transfer, sorting, and processing remains the largest headwind in many regions, particularly where tip fees are low, and commodity spreads are thin. Recent public finance programs are designed to reduce upfront cost barriers through grants and performance-based transfers, but multi-year funding commitments and reporting obligations add complexity for local governments and private operators. Indonesia's performance-based grants approach, now rolling out across 30 local governments, shows how capital can be linked to source separation and cost recovery, although execution capacity varies. Lao PDR's national program similarly pairs equipment, transfer facilities, and landfill upgrades with training for informal workers, which is essential for uptake but adds lead time to commissioning. In advanced markets, AI sorters and high-throughput lines require significant capital, though learning curves and operating savings from digitalization are gradually closing feasibility gaps.
Other drivers and restraints analyzed in the detailed report include:
- Growing Demand for Recycled Construction Materials Due to Resource Scarcity
- Rising Adoption of Circular Economy Principles in the Construction Industry
- Contamination of Waste Streams Reducing Recyclability and Material Quality
For complete list of drivers and restraints, kindly check the Table Of Contents.
Segment Analysis
Non-hazardous waste commanded 97.67% in 2025, while hazardous waste, at 2.33%, recorded the fastest 7.21% CAGR through 2031, reflecting heightened attention to legacy materials in aging buildings and infrastructure. This mix keeps the construction and demolition waste management market focused on mineral fractions in large volumes while compliance systems strengthen oversight of asbestos, lead, and PCBs in demolition workflows. Local permitting and landfill acceptance rules increasingly require certifications, notification, specialized handling, and scheduling, which support safe routing and documentation for hazardous materials. County-level practices, such as appointment-only acceptance and packaging standards, also reflect the operational safeguards around hazardous streams. Federal project specifications now restrict on-site activities that could create hazardous waste crossover, which raises the bar for diversion counting and contractor reporting across the construction and demolition waste management industry.
On the non-hazardous side, technology and process improvements are enhancing the quality and marketability of outputs. Water-based density separation and jigging systems have demonstrated high-purity mineral fractions, improving performance metrics that matter to end users in road base and structural applications. Standards and protocols for selective demolition and QA are fostering trust in recycled materials, which supports higher-value reuse and reduces downcycling risk in the construction and demolition waste management market. Digital reporting frameworks are tightening contamination controls and assuring that hazardous constituents are not co-mingled into otherwise recyclable mineral streams. Together, these measures help maintain the segment's strong base while channeling investment into the smaller hazardous category, which is expected to grow faster from a low base due to regulatory pressure and targeted infrastructure.
Geography Analysis
North America held 34.12% in 2025, reflecting a combination of mature permitting, local diversion mandates, and a growing use of digital compliance tools in project delivery. Federal and state guidance is linking capital grants to measured diversion outcomes, which streamlines reporting and scaling equipment deployments where gaps persist. County and city programs are adding refundable deposits, third-party facility certifications, and plan approvals that improve execution on job sites and raise confidence in downstream facilities. At the regional level, associations highlight new MRF and transfer investments that extend service coverage and internalize material flows. Together, these elements are strengthening diversion infrastructure and analytics across the construction and demolition waste management market in North America.
Asia-Pacific is the fastest-growing region with a 7.82% CAGR outlook, driven by large-scale construction activity, rapid urbanization, and an expanding policy framework in key countries. China generated 2.41 billion tonnes of construction waste in 2024, representing 25.9% of municipal solid waste, which demonstrates the scale at which national and city programs must support recovery. Policy signals include targets under the 14th Five-Year Plan for a resource recycling industry valued at RMB 5 trillion (USD 694.4 billion), and city-level performance ranges indicate room to raise utilization efficiency. Japan's 97% concrete recycling under its Construction Materials Recycling Law and Singapore's Green Mark recycled-content credits illustrate how specifications and scoring align the supply of circular materials with project goals. World Bank-backed programs in Southeast Asia are scaling city-level services with performance-based grants and cost recovery measures that support segregation and diversion.
Europe's framework is anchored by high recovery rates and increasingly harmonized standards for end-of-waste criteria and EPDs, which expand cross-border confidence in secondary materials. The region targets a 24% circular material use rate by 2030, up from 12.2% in 2024, with C&D waste as the largest stream in scope. Ongoing work on end-of-waste criteria prioritizes aggregates, concrete, bricks, and gypsum, which align with the mineral fractions that dominate the construction and demolition waste management market size in Europe. EU-funded pilots have validated structural elements and digital tools that link BIM, non-destructive testing, and AI assessments, advancing QA methods that will matter to specifiers and code officials. The policy and standards trajectory continues to support high-value recycling over backfilling, with Member States adjusting tax and procurement levers to reward secondary material uptake.
- Veolia
- WM (Waste Management)
- Republic Services
- REMONDIS
- GFL Environmental
- FCC Environment
- Biffa
- Cleanaway Waste Management
- Bingo Industries
- Urbaser
- Dulsco
- Averda
- BEEAH Group
- Geocycle (Holcim)
- Holcim (ECOCycle/Aggregate Industries)
- Heidelberg Materials (ReConcrete/evoBuild)
- Sims Metal
- Waste Connections
- RE Sustainability (Ramky Enviro)
- Ragn-Sells
- SUEZ
Additional Benefits:
- The market estimate (ME) sheet in Excel format
- 3 months of analyst support
TABLE OF CONTENTS
1 Introduction
- 1.1 Study Assumptions & Market Definition
- 1.2 Scope of the Study
2 Research Methodology
3 Executive Summary
4 Market Landscape
- 4.1 Market Overview
- 4.2 Market Drivers
- 4.2.1 Stringent Government Regulations and Policies for Waste Reduction and Recycling
- 4.2.2 Growing Urbanization and Infrastructure Development Activities Worldwide
- 4.2.3 Rising Adoption of Circular Economy Principles in Construction Industry
- 4.2.4 Increasing Awareness About Environmental Sustainability and Carbon Footprint Reduction
- 4.2.5 Technological Advancements in Waste Sorting, Processing, and Recycling Equipment
- 4.2.6 Growing Demand for Recycled Construction Materials Due to Resource Scarcity
- 4.3 Market Restraints
- 4.3.1 High Initial Capital Investment for Waste Management Infrastructure and Equipment
- 4.3.2 Lack of Awareness and Inadequate Training Among Construction Workforce
- 4.3.3 Contamination of Waste Streams Reducing Recyclability and Material Quality
- 4.3.4 Limited Availability of Advanced Recycling Facilities in Developing Regions
- 4.4 Value / Supply-Chain Analysis
- 4.5 Regulatory Landscape
- 4.6 Technological Outlook
- 4.7 Porter's Five Forces
- 4.7.1 Threat of New Entrants
- 4.7.2 Bargaining Power of Suppliers
- 4.7.3 Bargaining Power of Buyers
- 4.7.4 Threat of Substitutes
- 4.7.5 Industry Rivalry
- 4.8 Circular Economy & Material Flow Analysis
- 4.9 Environmental & Life-Cycle Assessment Considerations
5 Market Size & Growth Forecasts (value; with volume where available)
- 5.1 By Waste Type
- 5.1.1 Non-Hazardous Waste
- 5.1.2 Hazardous Waste
- 5.2 By Material
- 5.2.1 Concrete & Bricks
- 5.2.2 Asphalt
- 5.2.3 Metal
- 5.2.4 Timber
- 5.2.5 Soil and Sand
- 5.2.6 Gypsum & Drywall
- 5.2.7 Others (Plastic, Glass)
- 5.3 By Service
- 5.3.1 Collection & Transportation
- 5.3.2 Sorting & Segregation
- 5.3.3 Recycling & Material Recovery
- 5.3.4 Landfilling & Disposal
- 5.4 By Geography
- 5.4.1 North America
- 5.4.1.1 United States
- 5.4.1.2 Canada
- 5.4.1.3 Mexico
- 5.4.2 South America
- 5.4.2.1 Brazil
- 5.4.2.2 Argentina
- 5.4.2.3 Chile
- 5.4.2.4 Colombia
- 5.4.3 Europe
- 5.4.3.1 Germany
- 5.4.3.2 United Kingdom
- 5.4.3.3 France
- 5.4.3.4 Italy
- 5.4.3.5 Spain
- 5.4.3.6 Netherlands
- 5.4.3.7 Russia
- 5.4.4 Asia Pacific
- 5.4.4.1 China
- 5.4.4.2 India
- 5.4.4.3 Japan
- 5.4.4.4 South Korea
- 5.4.4.5 Australia
- 5.4.4.6 Southeast Asia (Indonesia, Vietnam, Thailand, Malaysia, Philippines)
- 5.4.5 Middle East
- 5.4.5.1 United Arab Emirates
- 5.4.5.2 Saudi Arabia
- 5.4.5.3 South Africa
- 5.4.5.4 Nigeria
- 5.4.5.5 Rest of Middle East And Africa
- 5.4.1 North America
6 Competitive Landscape
- 6.1 Market Concentration
- 6.2 Strategic Moves
- 6.3 Market Share Analysis
- 6.4 Company Profiles {(includes Global level Overview, Market level overview, Core Segments, Financials as available, Strategic Information, Market Rank/Share for key companies, Products & Services, and Recent Developments)}
- 6.4.1 Veolia
- 6.4.2 WM (Waste Management)
- 6.4.3 Republic Services
- 6.4.4 REMONDIS
- 6.4.5 GFL Environmental
- 6.4.6 FCC Environment
- 6.4.7 Biffa
- 6.4.8 Cleanaway Waste Management
- 6.4.9 Bingo Industries
- 6.4.10 Urbaser
- 6.4.11 Dulsco
- 6.4.12 Averda
- 6.4.13 BEEAH Group
- 6.4.14 Geocycle (Holcim)
- 6.4.15 Holcim (ECOCycle/Aggregate Industries)
- 6.4.16 Heidelberg Materials (ReConcrete/evoBuild)
- 6.4.17 Sims Metal
- 6.4.18 Waste Connections
- 6.4.19 RE Sustainability (Ramky Enviro)
- 6.4.20 Ragn-Sells
- 6.4.21 SUEZ
7 Market Opportunities & Future Outlook
- 7.1 White-space & unmet-need assessment
