
|
시장보고서
상품코드
2072489
전기 추진 시스템 : 시장 점유율 분석, 업계 동향 및 통계, 성장 예측(2026-2031년)Electric Propulsion Systems - Market Share Analysis, Industry Trends & Statistics, Growth Forecasts (2026 - 2031) |
||||||
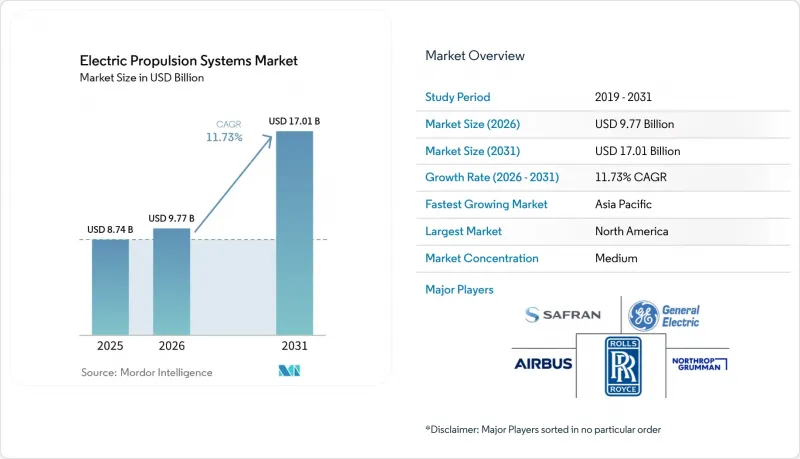
Mordor Intelligence에 의하면, 전기 추진 시스템 시장 규모는 2025년 87억 4,000만 달러로 평가되었습니다. 2026년에는 97억 7,000만 달러로 확대되어 2026년부터 2031년에 걸쳐 CAGR 11.73%로 성장을 지속하여, 2031년에는 170억 1,000만 달러에 이를 것으로 예측됩니다.

본 보고서는 유형별(하이브리드 및 순수 전기식), 용도별(항공, 육상, 선박, 우주), 최종 사용자별(정부·국방, 민간 기업, OEM/시스템 통합사업자), 지역별(북미, 유럽, 아시아태평양, 남미, 중동 및 아프리카)로 분류되어 있습니다. 시장 전망은 금액(달러) 기준으로 제시되어 있습니다.
세계의 전기 추진 시스템 시장 동향 및 인사이트
선단 차원의 탈탄소화 의무(IMO CII, ICAO LTAG)
IMO가 개정된 탄소강도지표(CII)에 따르면, 연간 효율 개선률을 2027년의 13.625%에서 2030년까지 21.500%로 높여야 하며, 이에 따라 운항 사업자들은 항만 이용 제한이나 보험상의 불이익 대상이 되는 D 및 E 등급 선박을 피하기 위해 전기 및 하이브리드 선박으로의 개조를 가속화할 수밖에 없는 상황입니다. 마찬가지로, ICAO의 장기 목표(LTAG) 역시 2050년 항공 업계의 탄소 중립 달성을 위한 로드맵에 전력 및 수소를 포함하고 있습니다. EU 배출권 거래 제도(ETS) 및 향후 도입이 예정된 ICAO의 연료 과세 제도에 따른 탄소 가격 리스크로 인해 설비 투자가 전기 추진 시스템으로 전환되고 있으며, 수주량은 기존 파워트레인의 교체율을 크게 상회하고 있습니다.
뉴스페이스 콘스텔레이션용 홀 효과 추진기의 급속한 소형화
100W 미만의 홀 효과 추진기를 통해 3U 큐브샛으로도 궤도 상승 및 궤도 유지가 가능해졌으며, 광대역 통신 및 지구관측을 위한 고밀도 위성 군집이 실현되고 있습니다. Busek사의 BIT-3 RF 이온 추진기는 3U 크기의 공간 내에서 150만 mN의 추력을 발생시켜 고압 크세논 탱크가 필요 없게 합니다. Exotrail사의 exoMG(TM) 시리즈는 최대 1,500 W까지 확장 가능하며, 2020년부터 2023년에 걸쳐 크세논 가격이 40% 이상 상승한 상황에서도 운영자에게 추진제 선택의 유연성을 제공합니다. 단가가 5만 달러 미만으로 하락함에 따라, 발사 횟수가 증가했음에도 불구하고 콘스텔레이션의 경제성을 유지하고 있습니다.
대규모 배터리 공급 부족
자동차 제조업체들이 리튬 이온 배터리 셀 생산량의 대부분을 확보하고 있기 때문에 항공우주 시스템 통합사업자들은 400 Wh/kg을 초과하고 엄격한 RTCA DO-311A 내충격 시험을 통과해야 하는 소수의 고전압 배터리 팩을 확보하기 위해 대기열에 서야만 하는 실정입니다. 셀 공급업체들은 1억 달러 이상의 기가팩토리 업그레이드 없이는 소량 생산용 항공기 사양으로 생산 라인을 전환하는 데 소극적이며, 이로 인해 리드타임이 3년 이상으로 늘어날 가능성이 있습니다. 전고체 배터리 분야의 선구자인 QuantumScape사와 Factorial Energy사는 항공기 제조업체와 개발 관련 양해각서(MoU)를 체결했습니다. 그러나 양사의 상용 제품 라인은 여전히 시범 운영 단계에 머물러 있으며, eVTOL 및 단거리 하이브리드 항공기의 운항은 2027년부터 2028년경이 될 전망입니다. 또한, 이러한 병목 현상은 인증 비용 증가로 이어지고 있습니다. 화학 성분이 변경될 때마다 열 폭주 시험이나 전자기 호환성 시험의 새로운 주기가 필요하기 때문입니다. 항공우주 등급 제품의 병행 생산이 본격화되기 전까지는 추진 시스템 개발 프로그램에서 공기역학적 준비 상황보다는 배터리 확보 가능성에 따라 인증 단계별 목표를 우선시하게 될 것입니다.
부문별 분석
2025년, 하이브리드 시스템은 가치 점유율의 55.34%를 차지했습니다. 이는 항속 거리, 적재량, 그리고 무공해 성능 간의 균형을 맞추기 위해, 운항 사업자들이 가스터빈이나 디젤 발전기와 배터리 및 전기 모터를 결합한 시스템을 선호하고 있음을 반영한 것입니다. NASA의 “'전동 파워트레인 비행 실증기'는 메가와트급 구성으로 이 개념을 구현하고 있으며, 단일 통로형 항공기에서 30%의 연료 절감 목표를 세우고 있습니다. 해운 사업자들도 비슷한 경향을 보이고 있습니다. 포난트사의 ““르 코망당 샤르코”이 선박은 극지에서의 저소음 운항에는 배터리를, 항해에는 LNG 엔진을 사용하고 있어, 하이브리드 방식이 항속 거리와 배기가스 감축이라는 두 가지 목표를 어떻게 모두 충족시키고 있는지 보여주고 있습니다.
완전 전기화의 도입 규모는 작지만, 도심항공모빌리티(UAM), 근해 페리, 그리고 임무 특성이 배터리의 에너지 밀도와 부합하거나 인프라를 통해 지속적인 전력 공급이 가능한 우주 플랫폼 덕분에 연평균 성장률(CAGR) 12.65%로 성장하고 있습니다. 지멘스의 지역 열차 ‘ '미레오 플러스 B' 역에 정차할 때 충전을 하며, 광산 회사에서는 지하 환기 비용을 절감하기 위해 배터리식 운반 트럭을 도입하고 있습니다. 궤도 상에서 홀 효과 추진기나 이온 추진기는 본질적으로 전기식이며, 소형화가 진전됨에 따라 3U 큐브샛에서도 과거에는 더 큰 섀시에서만 가능했던 기동 조작이 가능해졌습니다. 배터리 비용의 하락과 제로 배출 규제의 강화에 따라, 완전 전기식 솔루션인 전기 추진 시스템 시장 규모는 가속화될 것으로 예측됩니다.
지역별 분석
북미는 FAA(연방항공청)의 인증 절차와 미 해군의 IFEP(통합 전기 추진 계획) 로드맵에 힘입어 2025년 시장 가치의 39.27%를 차지했습니다. 그러나 배터리 공급 부족과 eVTOL의 EMI(전자기 호환성) 규제 대응 지연으로 인해 단기적인 납품이 제한되고 있습니다. 캐나다 해안경비대의 쇄빙선은 극지에서의 연료 소비를 최대 15%까지 줄여주는 Azipod 추진 시스템을 채택하고 있습니다. 멕시코의 철도 프로젝트와 새로운 배터리 공장이 해당 지역 수요를 다각화하고 있습니다.
아시아태평양은 2031년까지 연평균 성장률(CAGR) 12.38%로 성장할 것으로 전망됩니다. 중국은 세계 최대 규모의 전철망을 운영하고 있으며, 인도는 2030년까지 광궤 노선의 100% 전철화를 목표로 하고 있고, 일본은 선박용 전기 추진 시스템의 연구 개발을 추진하고 있습니다. 한국의 조선소들은 LNG 운반선의 전기화에 투자하고 있지만, 엔지니어들이 반도체 산업으로 유출되면서 인력 부족에 직면해 있습니다.
유럽에서는 “'그린 딜'에 따른 인센티브, 북극해 항로의 확대, 페리의 전기화가 맞물려 진전을 보이고 있습니다. 노르웨이의 배터리 구동 페리는 항해당 연료비를 대폭 절감하고 있으며, 프랑스의 PA-NG 운반선과 에어버스의 ‘"CityAirbus NextGen"이는 부문 간 경계를 넘어선 전동화의 대표적인 사례입니다. 남미, 중동 및 아프리카은 여전히 규모는 작지만, 광업 및 해양 지원 분야에서 성장세를 보이고 있으며, 디젤 연료 가격의 변동으로 인해 경제성 측면에서 전기 구동으로의 전환이 진행되고 있습니다.
기타 혜택 :
- 엑셀 형식 시장 예측(ME) 시트
- 3개월간의 애널리스트 지원
자주 묻는 질문
목차
제1장 서론
제2장 조사 방법
제3장 주요 요약
제4장 시장 구도
제5장 시장 규모 및 성장 예측
제6장 경쟁 구도
제7장 시장 기회 및 향후 전망
KTHAccording to Mordor Intelligence, the electric propulsion systems market size is expected to grow from USD 8.74 billion in 2025 to USD 9.77 billion in 2026 and is forecast to reach USD 17.01 billion by 2031, at a 11.73% CAGR over 2026-2031.
This report is Segmented by Type (Hybrid and Full-Electric), Application (Airborne, Terrestrial, Marine, and Space), End-User (Government and Defense, Commercial Operators, and OEM/System Integrators) and Geography (North America, Europe, Asia-Pacific, South America, and the Middle East and Africa). The Market Forecasts are Provided in Terms of Value (USD).
Global Electric Propulsion Systems Market Trends and Insights
Fleet-Level Decarbonization Mandates (IMO CII, ICAO LTAG)
The IMO's revised Carbon Intensity Indicator requires annual efficiency gains to rise from 13.625% in 2027 to 21.500% by 2030, forcing operators to accelerate electric and hybrid retrofits to avoid D- and E-rated vessels, which face port restrictions and insurance penalties. ICAO's Long-Term Aspirational Goals likewise embed electricity and hydrogen into aviation's 2050 net-zero pathway. Carbon-price exposure under the EU Emissions Trading System and prospective ICAO fuel-levy schemes is redirecting capex toward electric propulsion, raising order volumes well above replacement rates for legacy powertrains.
Rapid Miniaturization of Hall-Effect Thrusters for New-Space Constellations
Sub-100 W Hall-effect thrusters now enable 3U CubeSats to perform orbit raising and station-keeping, enabling high-density constellations for broadband and Earth observation. Busek's BIT-3 RF ion thruster produces 1.5 mN within a 3U footprint and removes high-pressure xenon tanks. Exotrail's exoMG(TM) line scales to 1,500 W, providing operators with propellant flexibility as xenon prices rose by more than 40% during 2020-2023. Lower unit costs, now under USD 50,000, maintain constellation economics despite a rising launch cadence.
Grid-Scale Battery Supply Crunch
Automotive manufacturers secure the majority of lithium-ion cell output, forcing aerospace integrators to queue for limited high-voltage packs that must exceed 400 Wh/kg and pass stringent RTCA DO-311A abuse tests. Cell suppliers are reluctant to retool for low-volume aviation formats without USD 100 million-plus gigafactory upgrades, which can extend lead times to three years or more. Solid-state pioneers QuantumScape and Factorial Energy have signed development MoUs with airframers. Yet, their commercial lines remain at pilot scale, keeping eVTOL and short-haul hybrids on a 2027-2028 service horizon. The bottleneck also inflates qualification costs, as every chemistry change triggers fresh thermal-runaway and electromagnetic-compatibility testing cycles. Until parallel aerospace-grade production ramps up, propulsion programs will prioritize certification milestones based on battery availability rather than aerodynamic readiness.
Other drivers and restraints analyzed in the detailed report include:
- Naval IFEP Retrofits Unlocking Lifetime OPEX Savings Which are Greater Than 15 %
- Megawatt-Class Hybrid-Electric Demonstrators Entering Flight Tests
- Xenon Price Volatility Threatens Satellite Propulsion Economics
For complete list of drivers and restraints, kindly check the Table Of Contents.
Segment Analysis
Hybrid systems held 55.34% value share in 2025, reflecting operator preference for gas-turbine or diesel generators coupled with batteries and electric motors to balance range, payload, and zero-emission capability. NASA's Electrified Powertrain Flight Demonstrator exemplifies the concept with a megawatt-class configuration, targeting 30% fuel savings on single-aisle aircraft. Marine operators echo the pattern: Ponant's Le Commandant Charcot uses batteries for silent polar maneuvering and LNG engines for transits, illustrating how hybrids meet both endurance and emissions goals.
Full-electric adoption, although smaller, is growing at a 12.65% CAGR, thanks to urban air mobility, short-sea ferries, and space platforms where mission profiles align with battery density or where infrastructure provides continuous power. Siemens' Mireo Plus B regional train recharges at station stops, while mining firms deploy battery haul trucks to cut underground ventilation costs. In orbit, Hall-effect and ion thrusters remain inherently electric, and miniaturization now allows 3U CubeSats to perform maneuvers once reserved for larger buses. The electric propulsion systems market size for full-electric solutions is expected to accelerate as battery costs decline and zero-emission regulations become more stringent.
Complete Report Scope:
- By Propulsion Type
- Hybrid
- Full-Electric
- By Platform
- Airborne (e-Aircraft and eVTOL)
- Terrestrial (Rail, Commercial EV, Mining)
- Marine (Commercial, Naval, Cruise)
- Space (Satellites, Deep-Space, In-Orbit Services)
- By End-User
- Government and Defense
- Commercial Operators
- OEM/System Integrators
- By Geography
- North America
- United States
- Canada
- Mexico
- Europe
- United Kingdom
- France
- Germany
- Italy
- Rest of Europe
- Asia-Pacific
- China
- India
- Japan
- South Korea
- Rest of Asia-Pacific
- South America
- Brazil
- Rest of South America
- Middle East and Africa
- Middle East
- Saudi Arabia
- United Arab Emirates
- Rest of Middle East
- Africa
- South Africa
- Rest of Africa
- Middle East
- North America
Geography Analysis
North America held 39.27% of the 2025 value, underpinned by FAA certification pipelines and US Navy IFEP roadmaps. Battery shortages and delays in eVTOL EMI compliance, though, restrain near-term deliveries. Canada's Coast Guard icebreakers choose Azipod drives that reduce polar fuel use by up to 15%. Mexico's rail projects and new battery plants diversify regional demand.
Asia-Pacific is forecasted to expand at a 12.38% CAGR through 2031. China operates the world's largest electrified rail network, India targets 100% broad-gauge electrification by 2030, and Japan advances marine electric-propulsion R&D. South Korean yards invest in LNG-carrier electrification but face workforce gaps as engineers migrate to the semiconductor industry.
Europe combines Green Deal incentives, Arctic shipping growth, and ferry electrification. Norway's battery ferries slash per-voyage fuel costs, while France's PA-NG carrier and Airbus's CityAirbus NextGen showcase cross-segment electrification. South America, and the Middle East and Africa regions remain smaller but are gaining traction in mining and offshore support, where diesel volatility tilts economics toward electric.
- General Electric Company
- Safran SA
- Airbus SE
- The Boeing Company
- Northrop Grumman Corporation
- Thales Alenia Space
- Busek Co. Inc.
- Sitael S.p.A.
- Collins Aerospace (RTX Corporation)
- Daihatsu Diesel Mfg. Co., Ltd.
- Efficient Drivetrains Inc. (Cummins Inc.)
- ENPULSION GmbH
- Rafael Advanced Defense Systems Ltd.
- Exotrail
- Honeywell International Inc.
- magniX USA Inc
- Rolls-Royce plc
Additional Benefits:
- The market estimate (ME) sheet in Excel format
- 3 months of analyst support
TABLE OF CONTENTS
1 INTRODUCTION
- 1.1 Study Assumptions and Market Definition
- 1.2 Scope of the Study
2 RESEARCH METHODOLOGY
3 EXECUTIVE SUMMARY
4 MARKET LANDSCAPE
- 4.1 Market Overview
- 4.2 Market Drivers
- 4.2.1 Fleet-level decarbonization mandates
- 4.2.2 Rapid miniaturization of Hall-effect thrusters for New-Space small-sat constellations
- 4.2.3 Naval IFEP retrofits unlocking lifetime OPEX savings greater than 15%
- 4.2.4 Megawatt-class hybrid-electric demonstrators entering commercial flight tests
- 4.2.5 Arctic shipping corridors favouring ice-class podded electric drives
- 4.2.6 On-orbit servicing demand driving sub-kW EP thrusters
- 4.3 Market Restraints
- 4.3.1 Grid-scale battery supply crunch delaying high-voltage aviation packs
- 4.3.2 Xenon and krypton price spikes raising satellite EP BOM by greater than 12%
- 4.3.3 Electromagnetic interference (EMI) certification gaps for eVTOL propulsion in urban airspace
- 4.3.4 Shipyard skill shortages for full-electric retrofit projects
- 4.4 Value Chain Analysis
- 4.5 Regulatory Landscape
- 4.6 Technological Outlook
- 4.7 Porter's Five Forces Analysis
- 4.7.1 Bargaining Power of Suppliers
- 4.7.2 Bargaining Power of Buyers
- 4.7.3 Threat of New Entrants
- 4.7.4 Threat of Substitutes
- 4.7.5 Intensity of Competitive Rivalry
5 MARKET SIZE AND GROWTH FORECASTS (VALUE)
- 5.1 By Propulsion Type
- 5.1.1 Hybrid
- 5.1.2 Full-Electric
- 5.2 By Platform
- 5.2.1 Airborne (e-Aircraft and eVTOL)
- 5.2.2 Terrestrial (Rail, Commercial EV, Mining)
- 5.2.3 Marine (Commercial, Naval, Cruise)
- 5.2.4 Space (Satellites, Deep-Space, In-Orbit Services)
- 5.3 By End-User
- 5.3.1 Government and Defense
- 5.3.2 Commercial Operators
- 5.3.3 OEM/System Integrators
- 5.4 By Geography
- 5.4.1 North America
- 5.4.1.1 United States
- 5.4.1.2 Canada
- 5.4.1.3 Mexico
- 5.4.2 Europe
- 5.4.2.1 United Kingdom
- 5.4.2.2 France
- 5.4.2.3 Germany
- 5.4.2.4 Italy
- 5.4.2.5 Rest of Europe
- 5.4.3 Asia-Pacific
- 5.4.3.1 China
- 5.4.3.2 India
- 5.4.3.3 Japan
- 5.4.3.4 South Korea
- 5.4.3.5 Rest of Asia-Pacific
- 5.4.4 South America
- 5.4.4.1 Brazil
- 5.4.4.2 Rest of South America
- 5.4.5 Middle East and Africa
- 5.4.5.1 Middle East
- 5.4.5.1.1 Saudi Arabia
- 5.4.5.1.2 United Arab Emirates
- 5.4.5.1.3 Rest of Middle East
- 5.4.5.2 Africa
- 5.4.5.2.1 South Africa
- 5.4.5.2.2 Rest of Africa
- 5.4.5.1 Middle East
- 5.4.1 North America
6 COMPETITIVE LANDSCAPE
- 6.1 Market Concentration
- 6.2 Strategic Moves
- 6.3 Market Share Analysis
- 6.4 Company Profiles (includes Global level Overview, Market level overview, Core Segments, Financials as available, Strategic Information, Market Rank/Share for key companies, Products and Services, and Recent Developments)
- 6.4.1 General Electric Company
- 6.4.2 Safran SA
- 6.4.3 Airbus SE
- 6.4.4 The Boeing Company
- 6.4.5 Northrop Grumman Corporation
- 6.4.6 Thales Alenia Space
- 6.4.7 Busek Co. Inc.
- 6.4.8 Sitael S.p.A.
- 6.4.9 Collins Aerospace (RTX Corporation)
- 6.4.10 Daihatsu Diesel Mfg. Co., Ltd.
- 6.4.11 Efficient Drivetrains Inc. (Cummins Inc.)
- 6.4.12 ENPULSION GmbH
- 6.4.13 Rafael Advanced Defense Systems Ltd.
- 6.4.14 Exotrail
- 6.4.15 Honeywell International Inc.
- 6.4.16 magniX USA Inc
- 6.4.17 Rolls-Royce plc
7 MARKET OPPORTUNITIES AND FUTURE OUTLOOK
- 7.1 White-space and Unmet-need Assessment
