
|
시장보고서
상품코드
2072536
전기자동차 렌탈 : 시장 점유율 분석, 업계 동향 및 통계, 성장 예측(2026-2031년)Electric Car Rental - Market Share Analysis, Industry Trends & Statistics, Growth Forecasts (2026 - 2031) |
||||||
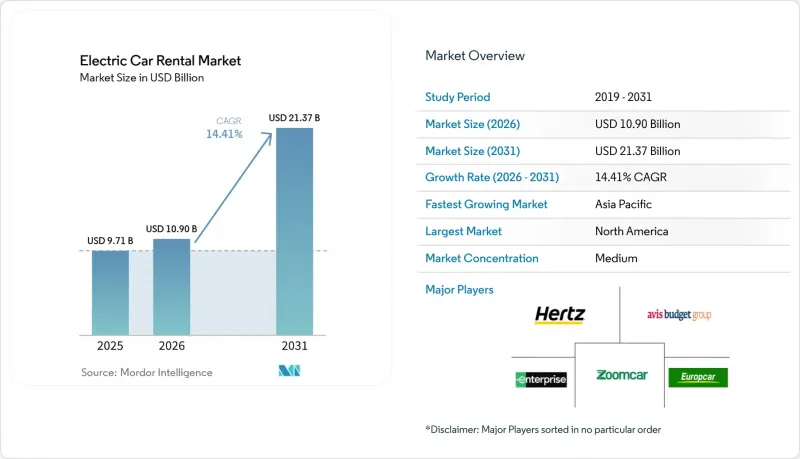
Mordor Intelligence에 의하면, 전기자동차 렌탈 시장 규모는 2025년 97억 1,000만 달러로 평가되었습니다. 2026년에는 109억 달러로 확대되어 2026년부터 2031년에 걸쳐 CAGR 14.41%로 성장을 지속하여, 2031년까지 213억 7,000만 달러에 이를 것으로 예측됩니다.

본 보고서는 차량 유형(배터리식 전기자동차, 플러그인 하이브리드차 등), 차체 스타일(해치백, 세단 등), 고객 유형(레저·관광, 비즈니스·법인 등), 예약 채널(온라인, 오프라인), 대여 기간(단기, 중기 등), 가격대, 이용 목적 및 지역별로 분류되어 있습니다. 시장 전망은 금액(달러) 기준으로 제시되어 있습니다.
세계의 전기자동차 렌탈 시장 동향 및 인사이트
이용 빈도가 높은 자전거 대여 서비스에서 BEV와 ICE의 TCO(총 소유 비용) 격차 축소
리튬 이온 배터리 팩의 가격 하락이 중요한 전환점에 도달함에 따라, 전체 수명 주기에 걸쳐 대규모 차량 군 단위의 배터리 전기자동차(BEV) 도입이 내연기관 차량보다 경제적으로 실현 가능해졌습니다. 이러한 추세는 연료비가 높은 지역에서 특히 큰 영향을 미치고 있으며, BEV는 운영 비용을 대폭 절감하고 있습니다. 일반적으로 연간 장거리를 주행하는 렌터카는 연료비 절감과 정비 부담 경감이라는 이점을 누릴 수 있습니다. BEV는 내연기관 차량에 비해 정비 빈도가 낮기 때문에 유지보수 비용 절감 효과가 뚜렷하며, 리스 기간 동안의 총 정비 비용을 대폭 절감할 수 있습니다. 노르웨이 등 일부 국가에서는 BEV가 내연기관 차량보다 훨씬 빠르게 비용 균형을 달성했다는 보고가 차량 운영사들로부터 나오고 있으며, 이는 자동차 업계에서 전동화의 경제적 매력이 높아지고 있음을 여실히 보여주고 있습니다.
렌터카 업체에 대한 정부의 전기자동차 차량 도입 의무 강화
2024년부터 시행된 캘리포니아주의 “"첨단 청정 차량 규정(Advanced Clean Fleets rule)" 그러면 우선순위가 높은 차량에 대해 제로 배출 차량으로의 완전한 전환이 의무화됨에 따라, 차량 교체 속도가 대폭 빨라지게 될 것입니다. 마찬가지로, 유럽연합(EU)의 규제 체계와 중국 각 도시의 시범 프로그램에서는 국경을 넘는 노선을 운영하는 사업자의 내연기관 열차 조달을 사실상 억제하는 엄격한 제재 조치가 도입되어 있습니다. 이러한 조치들은 경쟁 구도를 일변시키고 있으며, 배터리 구동 차량에 따른 고액의 초기 비용을 감당할 수 없는 사업자들은 업계 재편의 압박에 직면해 있습니다. 반면, 통합된 충전 네트워크를 구축한 기업들은 해당 인프라를 활용하여 공항 운영권 입찰 및 기타 전략적 기회에서 유리한 입지를 확보함으로써 경쟁 우위를 강화하고 있습니다.
교외 및 지방의 하차 지점에 충전 인프라가 미비함
미국에서는 급속 충전기가 주로 대도시권에 집중되어 있어, 도심 외곽으로 이동하는 데 큰 어려움이 발생하고 있습니다. 이러한 인프라 부족으로 인해 편도 여정의 실현 가능성이 제한되고, 사업자들은 지역별 할증 요금을 도입할 수밖에 없게 되었으며, 이것이 잠재적인 예약을 저해하는 요인이 되고 있습니다. 마찬가지로, 호주의 관광 노선이나 남유럽의 농촌 지역 등에서는 적절한 충전 인프라가 구축되어 있지 않아, 사업자들은 내연기관 차량(ICE)과 배터리식 전기자동차(BEV)가 혼합된 차량에 의존할 수밖에 없습니다. 이러한 혼합 차량을 이용한 운영은 업무의 복잡성을 가중시키고, 차량 보유 비용을 상승시켜, 해당 지역에서의 전기자동차 도입을 더욱 어렵게 만들고 있습니다.
부문별 분석
2025년에는 배터리 전기자동차가 차량 구성의 75.02%를 차지했으며, 2031년까지 연평균 성장률(CAGR) 17.85%로 성장할 것으로 전망됩니다. 한편, 플러그인 하이브리드 차량은 지방 노선의 공백을 메우고 있지만, 유지비가 많이 듭니다. 수소연료전지차는 수소 충전 인프라가 여전히 제한적이기 때문에 시범 운영 단계에 머물러 있습니다. 예를 들어, 2024년 미국에는 54곳의 일반용 수소 충전소가 운영되었으며, 그 대부분은 캘리포니아주에 집중되어 있었습니다. 따라서 순수 배터리 플랫폼이 전기자동차 렌터카 시장의 기반을 형성하고 있으며, 자동차 제조업체(OEM)들이 내연기관 차량(ICE) 생산에서 점차 철수하고 있다는 점이 이러한 우위를 더욱 공고히 하고 있습니다.
배터리 비용이 조만간 내연기관 차량 수준에 도달하고, 공항에 설치된 급속 충전소를 통해 사업자는 당초 예상보다 빨리 내연기관 차량을 퇴역시킬 수 있게 되었으며, 잔존 가치 보증을 통해 구매 위험이 더욱 경감되고 있습니다. 소비자들이 편의성이나 정책적 이점 때문에 BEV를 선호하는 경향이 있어, 플러그인 하이브리드 차량 시장 점유율은 20% 미만으로 정체될 전망입니다. 대규모 수소 회랑이 조성되지 않는 한, 연료전지차의 판매 대수는 극히 미미한 수준에 그칠 것입니다.
스포츠 유틸리티 차량(SUV)은 2025년 수요의 42.15%를 차지했으며, 실제 주행 거리 400-500킬로미터를 실현하는 대형 배터리 하우징을 활용해 연평균 성장률(CAGR) 15.48%로 증가할 전망입니다. 세단과 해치백을 합친 시장 점유율은 수요의 약 3분의 1 수준으로 안정적으로 유지되고 있지만, MPV와 쿠페는 여전히 틈새 시장으로 머물러 있습니다. 또한, SUV는 소형차에 비해 1일 이용 요금이 20-30% 비싸기 때문에 구매 시 지불한 추가 비용을 상쇄할 수 있습니다.
플릿 관리자들이 SUV를 선호하는 이유는 테슬라, 폭스바겐, 현대의 크로스오버 플랫폼이 150kW 충전을 지원하여 30분 이내에 상당한 양의 충전이 가능하기 때문에 공항에서의 차량 교체에 이상적이기 때문입니다. 자동차 제조업체들이 내연기관(ICE) 모델을 단종하고 전기 크로스오버를 우선시함에 따라 세단 시장 점유율은 하락하고 있으며, 해치백이 우위를 점하고 있는 것은 주차 공간의 제약이 주행 거리보다 더 중요하게 여겨지는 유럽의 밀집된 도심 지역에 국한되어 있습니다.
카풀 운전기사용 패키지는 2031년까지 연평균 성장률(CAGR) 18.31%로 확대될 전망이며, 이에 따라 렌터카 업체들은 관리형 서비스 제공업체로 전환하게 될 것입니다. 2025년에는 레저 여행객이 예약의 59.03%를 차지했으나, 가격에 대한 민감도와 계절적 요인의 영향으로 차량 1대당 수익에는 상한선이 있습니다. 하이브리드 근무 방식의 확산으로 출장 빈도가 줄어들면서 기업 대상 여행 시장의 성장세는 둔화되고 있지만, 배출량 보고 요건으로 인해 전기자동차는 여전히 우선 순위 목록에 포함되어 있습니다.
주당 300-400달러 규모의 구독 번들은 매달 200-300달러의 연료비를 절약할 수 있는 운전자들에게 매력적이며, 보험이 포함되어 있어 이용 개시 절차가 간소화됩니다. 점유율은 극히 미미하지만, P2P(개인 간) 호스트들은 지역 밀착형 공급 체계와 환경 의식이 높은 고객들의 공감을 불러일으키는 탄소 상쇄 기능을 통해 이익을 얻고 있습니다.
지역별 분석
아시아태평양은 가까운 미래의 전동화 목표를 설정한 중국의 지자체 할당 제도와 원활한 과금 시스템을 도입한 일본의 공항 운영권 계약에 힘입어 연평균 성장률(CAGR) 15.79%로 가장 빠른 성장세를 기록할 것으로 예측됩니다. 2025년에 40.25%의 점유율을 차지한 북미에서는 서부 해안의 규제가 성장의 기반이 되고 있지만, 중서부 지역의 충전 인프라 미비 문제가 성장의 걸림돌이 되고 있습니다. 싱가포르에서는 인센티브와 전기 택시 프로그램의 지원에 힘입어 전기자동차 보급이 급속히 확대되고 있으며, 전기자동차 렌탈의 거점으로서의 입지를 다져가고 있습니다. 하츠사는 전기자동차의 감가상각 및 수리비 부담으로 인해 2024년에 판매를 목적으로 한 전기자동차 처분 계획을 3만 대로 확대했습니다.
유럽에서는 충전 인프라가 잘 갖춰져 있어 보급률이 높아지고 있지만, 27개 회원국마다 인센티브 제도가 제각각이기 때문에 국경을 넘는 렌터카 이용이 복잡해지고 있습니다. 노르웨이는 차량의 전기화가 현저히 진전되고 있는 반면, 이탈리아와 스페인은 지방의 인프라가 미비하여 뒤처지고 있습니다. 남미와 중동은 아직 초기 단계에 있으며, 브라질과 아랍에미리트(UAE)가 도시 지역에서의 차량 도입을 주도하고 있지만, 높은 수입 관세와 고온 기후 하에서 배터리 성능과 관련된 과제에 직면해 있습니다.
캐나다는 미국과 유사한 추세를 보이고 있으며, 브리티시컬럼비아주와 퀘벡주가 앨버타주를 앞지르고 있습니다. 인도의 차량 중 렌탈용 전기자동차는 제한적이지만, 인프라가 정비되면 자산 부담이 적은 P2P(개인 간) 모델이 규모 확대의 길을 열어줄 것입니다. 호주에서는 관광 노선에 급속 충전기가 부족하기 때문에 전기자동차 대여 서비스가 주요 도시에만 한정되어 있습니다. 남아프리카공화국에서는 충전 인프라가 제한적이기 때문에 전기자동차 이용은 요하네스버그와 케이프타운을 잇는 회랑 지역으로 한정되어 있습니다.
기타 혜택 :
- 엑셀 형식 시장 예측(ME) 시트
- 3개월간의 애널리스트 지원
자주 묻는 질문
목차
제1장 서론
제2장 조사 방법
제3장 주요 요약
제4장 시장 구도
제5장 시장 규모 및 성장 예측
제6장 경쟁 구도
제7장 시장 기회 및 향후 전망
KTH 26.07.03According to Mordor Intelligence, the electric car rental Market size is expected to grow from USD 9.71 billion in 2025 to USD 10.90 billion in 2026 and is forecast to reach USD 21.37 billion by 2031 at 14.41% CAGR over 2026-2031.
This report is Segmented by Vehicle Type (Battery Electric, Plug-In Hybrid Electric, and More), Body Style (Hatchback, Sedan, and More), Customer Type (Leisure/Tourism, Business/Corporate, and More), Booking Channel (Online, Offline), Rental Duration (Short-Term, Medium-Term, and More), Price Tier, End-Use Purpose, and Geography. The Market Forecasts are Provided in Terms of Value (USD).
Global Electric Car Rental Market Trends and Insights
Falling TCO Parity of BEVs vs. ICE in High-Utilization Rental Cycles
Falling lithium-ion pack prices reached a significant milestone, making fleet-scale battery-electric vehicle (BEV) acquisitions more financially viable than internal combustion engine (ICE) vehicles over their lifecycles. This development has been particularly impactful in regions with high fuel costs, where BEVs offer substantial savings on operational expenses. Rental vehicles, which typically cover extensive distances annually, benefit from lower fuel costs and reduced maintenance requirements. The maintenance savings are notable, as BEVs require fewer service interventions than ICE vehicles, resulting in a significant reduction in overall service expenses during the lease period. In countries like Norway, fleets have reported that BEVs achieve cost parity much faster than ICE vehicles, highlighting the growing economic appeal of electrification in the automotive sector.
Increasing Government EV-Fleet Mandates for Rental Operators
Starting in 2024, California's Advanced Clean Fleets rule requires high-priority fleets to transition exclusively to zero-emission vehicles, significantly accelerating the pace of fleet turnover . Similarly, regulatory frameworks in the European Union and pilot programs in Chinese cities are introducing stringent penalties that effectively discourage the procurement of internal-combustion vehicles by operators managing cross-border routes. These measures are reshaping the competitive landscape, as operators unable to manage the high upfront costs associated with battery-powered vehicles face mounting consolidation pressures. In contrast, companies that have established integrated charging networks are gaining a competitive edge, leveraging their infrastructure to secure favorable positions in airport concession bids and other strategic opportunities.
Inadequate Charging Infrastructure at Suburban and Rural Drop-Off Points
Fast chargers in the United States were predominantly concentrated within metropolitan areas, creating significant challenges for travel outside urban centers. This lack of infrastructure limits the feasibility of one-way itineraries and compels operators to implement geographic surcharges, which discourage potential bookings. Similarly, in regions such as Australia's tourism routes and the rural areas of Southern Europe, the absence of adequate charging networks forces operators to rely on a combination of Internal Combustion Engine (ICE) and Battery Electric Vehicle (BEV) fleets. This dual-fleet approach increases operational complexity and drives up inventory costs, further complicating the adoption of electric vehicles in these areas.
Other drivers and restraints analyzed in the detailed report include:
- OEM-Rental Partnerships Offering Residual-Value Guarantees
- Rapid Expansion of Airport Fast-Charging Concessions
- High Battery Depreciation and Repair Costs on Short Rental Cycles
For complete list of drivers and restraints, kindly check the Table Of Contents.
Segment Analysis
Battery electric units delivered 75.02% of the fleet share in 2025 and are expected to grow at a 17.85% CAGR through 2031, whereas plug-in hybrids fill rural-route gaps but incur higher maintenance costs. Fuel-cell vehicles remain pilot-only because hydrogen refuelling availability remains limited; for example, the U.S. had 54 open retail hydrogen stations as of 2024, most in California. Pure battery platforms thus anchor the electric car rental market, and OEMs' pivot away from ICE production solidifies this lead.
Early battery cost parity and fast-charging plazas at airports enable operators to retire ICE assets faster than initially forecast, with residual-value guarantees further de-risking the purchase. Plug-in hybrids are likely to plateau below a 20% share as customers gravitate toward BEVs for their simplicity and policy advantages. Fuel-cell volumes stay negligible absent large-scale hydrogen corridors.
Sport Utility Vehicles (SUVs) accounted for 42.15% of 2025 demand and will rise at a 15.48% CAGR, leveraging larger battery housings that deliver 400-500 kilometer real-world range. Sedans and hatchbacks combined are stabilizing around one-third of demand, while MPVs and coupes remain niche. SUVs also achieve 20-30% higher daily rates that amortize their purchase premium over compact body styles.
Fleet managers prefer SUVs because crossover platforms from Tesla, Volkswagen, and Hyundai offer 150-kilowatt charging that restores significant capacity in under 30 minutes, ideal for airport turnover. Sedans lose ground as automakers discontinue ICE variants and prioritize electric crossovers, and hatchbacks dominate only in dense European cores where parking constraints trump range.
Ride-hailing driver packages are set to grow at an 18.31% CAGR through 2031, converting rental companies into managed-service providers. Leisure travelers generated 59.03% of bookings in 2025, but price sensitivity and seasonality cap revenue per vehicle. Corporate travel sees slower growth because hybrid work reduces trip frequency, yet emissions reporting keeps EVs on preferred lists.
Subscription bundles priced at USD 300-400 per week appeal to drivers who save USD 200-300 on fuel each month, and embedded insurance streamlines the onboarding process. Peer-to-peer hosts, holding a nominal share, profit from localized supply and carbon-offset features that resonate with eco-conscious customers.
Complete Report Scope:
- By Vehicle Type
- Battery Electric
- Plug-in Hybrid Electric
- Extended-Range Electric (REEV)
- Fuel-Cell Electric
- By Body Style
- Hatchback
- Sedan
- Sport Utility Vehicle (SUV)
- Multi-Utility Vehicle (MUV)/Multi-Purpose Vehicle (MPV)
- Sports Coupe
- By Customer Type
- Leisure / Tourism
- Business / Corporate
- Peer-to-Peer Host
- Ride-hailing Driver Subscription
- By Booking Channel
- Online
- Desktop Web
- Mobile App
- Offline
- Online
- By Rental Duration
- Short-Term (Less than 7 days)
- Medium-Term (7 to 30 days)
- Long-Term (More than 30 days, subscription)
- By Price Tier
- Budget / Economy
- Mid-Range
- Luxury / Premium
- By End-Use Purpose
- Local Commute
- Airport Transport
- Inter-City / Outstation
- Last-Mile Delivery
- By Geography
- North America
- United States
- Canada
- Rest of North America
- South America
- Brazil
- Argentina
- Chile
- Rest of South America
- Europe
- Germany
- United Kingdom
- France
- Italy
- Spain
- Netherlands
- Norway
- Rest of Europe
- Asia-Pacific
- China
- Japan
- India
- South Korea
- Australia
- Singapore
- Rest of Asia-Pacific
- Middle East and Africa
- United Arab Emirates
- Saudi Arabia
- Turkey
- South Africa
- Egypt
- Rest of Middle East and Africa
- North America
Geography Analysis
The Asia-Pacific region is expected to register the fastest growth, with a 15.79% CAGR, driven by Chinese municipal quotas setting electrification targets for the near future and Japanese airport concessions integrating seamless billing. North America, with a 40.25% share in 2025, sees growth anchored in West Coast mandates, yet tempered by sparse Midwest charging networks. Singapore EV adoption is rising fast, driven by incentives and electric taxi programs, positioning it as an EV rental hub. Hertz increased its EV disposition plan to 30,000 vehicles intended for sale in 2024, following EV depreciation and repair-cost pressures.
Europe's dense charging grids drive high penetration, though fragmented incentives across 27 member states complicate cross-border rentals. Norway leads the way with notable fleet electrification, while Italy and Spain lag due to gaps in rural infrastructure. South America and the Middle East are still in the early stages, with Brazil and the United Arab Emirates leading the way in urban fleets but facing high import duties and thermal challenges related to battery performance in hot climates.
Canada mirrors the United States patterns, with British Columbia and Quebec outpacing Alberta. India's fleet consists of limited rental EVs, but asset-light peer-to-peer models pave the way for scale if infrastructure broadens. Australia confines EV rentals to capital cities because tourist routes lack fast chargers. South Africa's limited charging grid restricts EV availability to Johannesburg and Cape Town corridors.
- Enterprise Holdings, Inc.
- The Hertz Corporation
- Avis Budget Group, Inc.
- Sixt SE
- Europcar Mobility Group
- Zoomcar Inc.
- Green Motion International
- Turo Inc.
- UFODrive S.A.
- DriveElectric (UK)
Additional Benefits:
- The market estimate (ME) sheet in Excel format
- 3 months of analyst support
TABLE OF CONTENTS
1 Introduction
- 1.1 Study Assumptions & Market Definition
- 1.2 Scope of the Study
2 Research Methodology
3 Executive Summary
4 Market Landscape
- 4.1 Market Overview
- 4.2 Market Drivers
- 4.2.1 Falling TCO Parity of BEVs vs. ICE in High-Utilization Rental Cycles
- 4.2.2 Increasing Government EV-Fleet Mandates for Rental Operators
- 4.2.3 OEM-Rental Partnerships Offering Residual-Value Guarantees
- 4.2.4 Rapid Expansion of Airport Fast-Charging Concessions
- 4.2.5 Surge in Peer-to-Peer EV-Sharing Platforms Integrating with Aggregators
- 4.2.6 Growing Carbon-Credit Monetization Opportunities for Rental Firms
- 4.3 Market Restraints
- 4.3.1 Inadequate Charging Infrastructure at Suburban and Rural Drop-Off Points
- 4.3.2 High Battery Depreciation and Repair Costs on Short Rental Cycles
- 4.3.3 Insurance-Underwriting Gaps for High-Voltage Systems
- 4.3.4 Volatile Residual Values for Low-Cost Chinese-Brand EVs in Secondary Market
- 4.4 Value/Supply-Chain Analysis
- 4.5 Regulatory Landscape
- 4.6 Technological Outlook
- 4.7 Porter's Five Forces
- 4.7.1 Threat of New Entrants
- 4.7.2 Bargaining Power of Buyers/Consumers
- 4.7.3 Bargaining Power of Suppliers
- 4.7.4 Threat of Substitute Products
- 4.7.5 Intensity of Competitive Rivalry
5 Market Size & Growth Forecasts (Value, USD)
- 5.1 By Vehicle Type
- 5.1.1 Battery Electric
- 5.1.2 Plug-in Hybrid Electric
- 5.1.3 Extended-Range Electric (REEV)
- 5.1.4 Fuel-Cell Electric
- 5.2 By Body Style
- 5.2.1 Hatchback
- 5.2.2 Sedan
- 5.2.3 Sport Utility Vehicle (SUV)
- 5.2.4 Multi-Utility Vehicle (MUV)/Multi-Purpose Vehicle (MPV)
- 5.2.5 Sports Coupe
- 5.3 By Customer Type
- 5.3.1 Leisure / Tourism
- 5.3.2 Business / Corporate
- 5.3.3 Peer-to-Peer Host
- 5.3.4 Ride-hailing Driver Subscription
- 5.4 By Booking Channel
- 5.4.1 Online
- 5.4.1.1 Desktop Web
- 5.4.1.2 Mobile App
- 5.4.2 Offline
- 5.4.1 Online
- 5.5 By Rental Duration
- 5.5.1 Short-Term (Less than 7 days)
- 5.5.2 Medium-Term (7 to 30 days)
- 5.5.3 Long-Term (More than 30 days, subscription)
- 5.6 By Price Tier
- 5.6.1 Budget / Economy
- 5.6.2 Mid-Range
- 5.6.3 Luxury / Premium
- 5.7 By End-Use Purpose
- 5.7.1 Local Commute
- 5.7.2 Airport Transport
- 5.7.3 Inter-City / Outstation
- 5.7.4 Last-Mile Delivery
- 5.8 By Geography
- 5.8.1 North America
- 5.8.1.1 United States
- 5.8.1.2 Canada
- 5.8.1.3 Rest of North America
- 5.8.2 South America
- 5.8.2.1 Brazil
- 5.8.2.2 Argentina
- 5.8.2.3 Chile
- 5.8.2.4 Rest of South America
- 5.8.3 Europe
- 5.8.3.1 Germany
- 5.8.3.2 United Kingdom
- 5.8.3.3 France
- 5.8.3.4 Italy
- 5.8.3.5 Spain
- 5.8.3.6 Netherlands
- 5.8.3.7 Norway
- 5.8.3.8 Rest of Europe
- 5.8.4 Asia-Pacific
- 5.8.4.1 China
- 5.8.4.2 Japan
- 5.8.4.3 India
- 5.8.4.4 South Korea
- 5.8.4.5 Australia
- 5.8.4.6 Singapore
- 5.8.4.7 Rest of Asia-Pacific
- 5.8.5 Middle East and Africa
- 5.8.5.1 United Arab Emirates
- 5.8.5.2 Saudi Arabia
- 5.8.5.3 Turkey
- 5.8.5.4 South Africa
- 5.8.5.5 Egypt
- 5.8.5.6 Rest of Middle East and Africa
- 5.8.1 North America
6 Competitive Landscape
- 6.1 Market Concentration
- 6.2 Strategic Moves
- 6.3 Market Share Analysis
- 6.4 Company Profiles (includes Global Level Overview, Market Level Overview, Core Segments, Financials as Available, Strategic Information, Market Rank/Share for Key Companies, Products and Services, SWOT Analysis, and Recent Developments)
- 6.4.1 Enterprise Holdings, Inc.
- 6.4.2 The Hertz Corporation
- 6.4.3 Avis Budget Group, Inc.
- 6.4.4 Sixt SE
- 6.4.5 Europcar Mobility Group
- 6.4.6 Zoomcar Inc.
- 6.4.7 Green Motion International
- 6.4.8 Turo Inc.
- 6.4.9 UFODrive S.A.
- 6.4.10 DriveElectric (UK)
7 Market Opportunities & Future Outlook
- 7.1 White-space & Unmet-Need Assessment

