
|
시장보고서
상품코드
2072629
제어실 솔루션 시장 : 시장 점유율 분석, 업계 동향 및 통계, 성장 예측(2025-2030년)Control Room Solutions - Market Share Analysis, Industry Trends & Statistics, Growth Forecasts (2025 - 2030) |
||||||
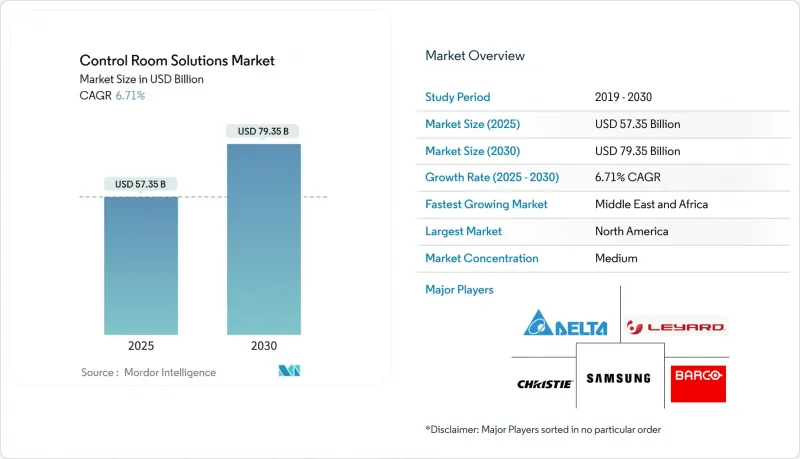
Mordor Intelligence에 의하면, 세계의 제어실 솔루션 시장 규모는 2025년에 573억 5,000만 달러로 평가되었고, 2030년까지 793억 5,000만 달러에 이를 것으로 예측되며, 예측 기간 중 CAGR 6.71%로 성장할 전망입니다.

본 보고서는 구성 요소별(LED 비디오월 디스플레이, LCD 비디오월 디스플레이 등), 도입 형태별(온프레미스, 클라우드, 하이브리드), 최종 사용자 산업별(에너지 및 유틸리티, 운송 및 물류, 의료 등), 용도별(지휘통제센터, 공정 제어 및 감시 등) 및 지역별로 분류되어 있습니다. 시장 전망치는 금액(달러)으로 표시되어 있습니다.
세계의 제어실 솔루션 시장 동향 및 인사이트
미션 크리티컬 산업 분야에서 실시간 상황 파악에 대한 수요가 급증하고 있습니다.
유틸리티자는 전력 계통의 이상을 1초 이내에 감지해야 하며, 운송 기관은 연쇄적인 지연을 방지하기 위해 복합 교통 흐름을 조정하고 있습니다. 탬파 일렉트릭사는 예측 분석을 통해 장비의 이상을 조기에 감지한 결과, 예기치 못한 정전을 40% 줄였습니다. 병원에서도 이와 같은 긴급성이 나타납니다. 가스리 클리닉은 환자 모니터링과 직원 배치를 일원화함으로써 연간 700만 달러의 비용 절감을 실현했습니다. 모든 업계에서 운영 담당자들은 인지적 부하를 증가시키지 않으면서 텔레메트리, 경보, 영상을 단일 화면에서 통합해 주는 플랫폼을 원하고 있습니다.
LCD에서 파인 피치 LED 비디오월로의 업그레이드 주기 가속화
베젤리스 LED 월은 기존 LCD 제품을 능가하는 높은 밝기와 넓은 시야각, 그리고 5만 시간의 수명을 실현하고 있습니다. 2024년에 접어들면서, 삼성과 LG가 제어실 전용 생산 라인을 확충함에 따라 공급 부족 현상이 완화되기 시작했습니다. 픽셀 단가 하락과 번인 현상에 대한 내성이 맞물리면서, 에너지 제어 센터나 철도 네트워크의 지휘 거점에서의 교체 주기가 단축되고 있습니다.
대형 직접 뷰 LED 월의 높은 총 소유 비용
전용 설치 공사, 공조 설비 업그레이드, 비상 전원 등을 포함하면 총 도입 비용은 50만 달러를 초과할 수 있습니다. 2025년 관세 면제로 인해 수입 관세가 인하되었지만, 많은 중견 전력 회사들은 자금 조달 모델이 자본 지출에서 운영 리스로 전환될 때까지 설비 교체 주기를 미루고 있습니다. 각 벤더사는 현재 하드웨어, 소프트웨어 및 5년간의 유지보수 서비스를 예측 가능한 월정액 요금에 포함시킨 구독형 번들 상품의 시범 도입을 추진하고 있습니다.
부문별 분석
2024년, LED 비디오월 디스플레이는 미션 크리티컬한 시각화 분야에서 핵심적인 역할을 수행하고 있음을 반영하여, 제어실 솔루션 시장 점유율의 36.43%를 차지했습니다. 운영자가 상황 인식의 명확성을 높여주는 베젤리스 디스플레이를 중시함에 따라, LED 디스플레이를 활용한 제어실 솔루션 시장 규모는 꾸준히 확대될 것으로 전망됩니다. 관련 서브시스템도 이에 발맞추어 발전하고 있으며, 첨단 컨트롤러가 고화소 밀도와 HDR 색 공간을 통합하고, 인체공학적으로 설계된 콘솔이 작업자의 피로를 줄여주고 있습니다.
KVM 및 신호 관리 스위치는 2030년까지 6.94%라는 가장 높은 연평균 성장률(CAGR)을 보일 것으로 전망됩니다. 이러한 장치는 직원이 하나의 키보드와 마우스를 통해 기밀 영역과 비기밀 영역을 전환할 수 있도록 함으로써, 안전한 데이터 분리를 지원합니다. 이러한 장치는 직원이 하나의 키보드와 마우스를 통해 기밀 영역과 비기밀 영역을 전환할 수 있도록 함으로써, 안전한 데이터 분리를 지원합니다. KVM 스위치 시장에서 보안이 강화된 다중 시스템 액세스 및 실시간 운영 제어에 대한 수요가 증가함에 따라, 첨단 제어실 솔루션의 도입이 더욱 가속화되고 있습니다. Black Box Corporation의 최신 보안 KVM 제품 라인은 인증된 절연 기술이 국방 및 공공 안전 관련 요구 사항을 어떻게 충족시키는지 보여줍니다. 예측 기간 동안 사이버 보안에 대한 우려가 커짐에 따라, 하드웨어를 통한 보안 계층에 대한 추가 투자가 촉진될 것입니다.
2024년, 유틸리티, 의료 네트워크, 국방 기관이 현지에서 데이터 관리를 유지하고 있기 때문에 온프레미스 구성이 제어실 솔루션 시장의 54.37%를 차지했습니다. 물리적 분리를 통해 결정론적 지연과 엄격한 업계 규정의 준수가 보장됩니다. 그러나 하이브리드 방식의 제어실 솔루션 시장 규모는 2030년까지 연평균 성장률(CAGR) 8.64%에 힘입어 기존 모델을 웃도는 속도로 확대될 전망입니다.
하이브리드형 프레임워크에서는 계산 부하가 높은 분석 처리를 클라우드로 오프로드하는 한편, 명령 루프는 온프레미스에 유지합니다. 엣지 게이트웨이는 암호화된 동기화 전에 데이터를 사전 처리하므로, AI 워크로드가 핵심 시스템을 노출시키지 않으면서도 이상 감지 정확도를 높일 수 있습니다. 퍼블릭 클라우드 공급업체들은 현재 관할 구역별 데이터 상주 요건을 충족하기 위해 지역별 가용성 구역을 인증하고 있으며, 이로 인해 유럽 및 아시아 전역에서의 도입이 가속화되고 있습니다.
지역별 분석
2024년에는 북미가 매출 점유율 37.41%로 1위를 차지했습니다. 2억 8,000만 달러 규모의 SMART 보조금과 7억 5,000만 달러 규모의 FEMA 회복탄력성 기금 등 연방 정부 프로그램을 통해 교통 관리 센터와 비상 대응 시설의 현대화가 진행되고 있습니다. NERC CIP와 같은 엄격한 규범에 따라, 유틸리티자들은 역할 기반 접근 제어 및 부문화된 네트워크를 갖춘 제어실로 시스템을 업그레이드해야 하는 반면, 의료 시스템에서는 간호사 부족 문제를 해결하기 위해 통합 환자 모니터링 시스템에 대한 투자가 진행되고 있습니다.
중동 및 아프리카는 2030년까지 연평균 성장률(CAGR) 7.46%를 기록하며, 세계에서 가장 빠른 성장률을 보일 것으로 전망됩니다. 사우디아라비아와 UAE의 '비전 2030' 계획에 따르면, 스마트 그리드, 지능형 모빌리티 회랑, AI를 활용한 보안 운영에 수십억 달러 규모의 예산이 배정되어 있습니다. 연간 20억 달러를 넘는 데이터센터 설비 투자가, 열 부하와 전력 사용 효율(PUE)을 관리하는 고가용성 네트워크 운영 센터에 대한 수요를 뒷받침하고 있습니다.
유럽 및 아시아태평양에서는 제조업의 디지털화와 스마트 시티 인프라 구축이 진행되면서 꾸준한 성장이 이어지고 있습니다. 유럽의 전력 회사들은 제어실을 활용하여 간헐적인 재생에너지의 균형을 조정하고 있는 반면, 아시아의 대도시에서는 철도와 도로의 연계된 감시가 요구되고 있습니다. 국내 반도체 제조에 대한 정부의 지원책 또한 하드웨어 공급 제약을 완화하여 프로젝트 납기 단축에 기여하고 있습니다.
기타 혜택 :
- 엑셀 형식 시장 예측(ME) 시트
- 3개월간의 애널리스트 지원
자주 묻는 질문
목차
제1장 서론
제2장 조사 방법
제3장 주요 요약
제4장 시장 구도
제5장 시장 규모 및 성장 예측
제6장 경쟁 구도
제7장 시장 기회 및 향후 전망
AJYAccording to Mordor Intelligence, the global control room solutions market size stands at USD 57.35 billion in 2025 and is projected to reach USD 79.35 billion by 2030, advancing at a 6.71% CAGR over the forecast period.
This report is Segmented by Component (Video Wall Displays LED, Video Wall Displays LCD, and More), Deployment Mode (On-Premise, Cloud, Hybrid), End-User Industry (Energy and Utilities, Transportation and Logistics, Healthcare, and More), Application (Command and Control Centers, Process Control and Monitoring, and More), and Geography. The Market Forecasts are Provided in Terms of Value (USD).
Global Control Room Solutions Market Trends and Insights
Surging Demand for Real-Time Situational Awareness in Mission-Critical Industries
Utilities need sub-second detection of grid disturbances, and transport agencies coordinate multimodal traffic flows to prevent cascading delays. Tampa Electric trimmed unplanned outages by 40% once predictive analytics surfaced early equipment anomalies. Hospitals mirror this urgency; Guthrie Clinic saved USD 7 million annually by centralizing patient monitoring and staff allocation. Across sectors, operators seek platforms that fuse telemetry, alarms, and video on a single pane of glass without increasing cognitive load.
Accelerated Upgrade Cycle from LCD to Fine-Pitch LED Video Walls
Bezel-free LED walls deliver higher brightness, wider viewing angles, and 50,000-hour lifespans that outclass legacy LCD counterparts. Supply constraints began easing in 2024 as Samsung and LG ramped production lines dedicated to control rooms. Falling cost-per-pixel, combined with resilience to burn-in, is shortening refresh cycles in energy control centers and rail-network command hubs.
High Total Cost of Ownership for Large-Format Direct-View LED Walls
Comprehensive deployments can exceed USD 500,000 once specialized mounting, HVAC upgrades, and backup power are included. Although 2025 tariff exemptions cut import duties, many mid-size utilities defer refresh cycles until financing models shift from capital expenditure to operating leases. Vendors now trial subscription bundles that package hardware, software, and five-year maintenance into predictable monthly fees.
Other drivers and restraints analyzed in the detailed report include:
- Convergence of OT/IT and Wider Adoption of Unified Control-Room Software Platforms
- Growing Preference for Cloud-Connected Remote and Hybrid Control-Room Architectures
- Cyber-Security Vulnerabilities Across Converged OT/IT Control Environments
For complete list of drivers and restraints, kindly check the Table Of Contents.
Segment Analysis
LED video wall displays held 36.43% of the control room solutions market share in 2024, reflecting their central role in mission-critical visualization. The control room solutions market size for LED displays is projected to expand steadily as operators value bezelless canvases that enhance situational clarity. Supporting subsystems evolve in lockstep; advanced controllers orchestrate higher pixel densities and HDR color spaces, and ergonomic consoles lower operator fatigue.
KVM and signal-management switches post the fastest 6.94% CAGR to 2030. These devices underpin secure data segregation by allowing staff to toggle between classified and unclassified domains through a single keyboard and mouse. These devices underpin secure data segregation by allowing staff to toggle between classified and unclassified domains through a single keyboard and mouse. The growing demand within the KVM Switch market for secure multi-system access and real-time operational control is further supporting the adoption of advanced control room solutions Black Box Corporation's latest secure KVM line illustrates how certified isolation supports defense and public safety mandates. Over the forecast period, rising cyber-concerns will funnel additional spend toward hardware-enforced security layers.
On-premise configurations accounted for 54.37% of the control room solutions market in 2024 as utilities, healthcare networks, and defense agencies uphold local data custody. Physical isolation ensures deterministic latency and compliance with stringent sector regulations. However, the control room solutions market size for hybrid deployments will outpace traditional models, supported by an 8.64% CAGR to 2030.
Hybrid frameworks offload compute-intensive analytics to the cloud while keeping command loops on site. Edge gateways pre-process data before encrypted synchronization, allowing AI workloads to refine anomaly detection without exposing core systems. Public cloud vendors now certify regionally confined availability zones to satisfy jurisdictional data-residency statutes, which accelerates adoption across Europe and Asia.
Complete Report Scope:
- By Component
- Video Wall Displays (LED)
- Video Wall Displays (LCD)
- Rear-Projection Cubes
- Video Wall Controllers
- Control-Room Consoles and Furniture
- KVM and Signal-Management Switches
- Integrated Software and Middleware
- Services (Design, Integration, O&M)
- By Deployment Mode
- On-Premise
- Cloud
- Hybrid
- By End-User Industry
- Energy and Utilities
- Transportation and Logistics
- Public Safety and Security
- Manufacturing and Process Industries
- Healthcare
- Defense and Aerospace
- IT and Telecommunications
- Other End-User Industry
- By Application
- Command and Control Centers
- Process Control and Monitoring
- Emergency and Incident Management
- Surveillance and Security Monitoring
- Network Operations Centers (NOCs)
- Broadcast and Media Control Rooms
- By Geography
- North America
- United States
- Canada
- Mexico
- Europe
- Germany
- United Kingdom
- France
- Russia
- Rest of Europe
- Asia-Pacific
- China
- Japan
- India
- South Korea
- Australia
- Rest of Asia-Pacific
- Middle East and Africa
- Middle East
- Saudi Arabia
- United Arab Emirates
- Rest of Middle East
- Africa
- South Africa
- Egypt
- Rest of Africa
- Middle East
- South America
- Brazil
- Argentina
- Rest of South America
- North America
Geography Analysis
North America led with 37.41% revenue share in 2024. Federal programs such as the USD 280 million SMART grants and USD 750 million FEMA resilience funding continue to modernize traffic management centers and emergency operations facilities. Strict frameworks like NERC CIP push utilities to renew control rooms with role-based access controls and segmented networks, while healthcare systems invest in centralized patient monitoring to counter nurse shortages.
The Middle East and Africa region will register a 7.46% CAGR through 2030, the fastest worldwide. Vision 2030 agendas in Saudi Arabia and the UAE earmark multibillion-dollar budgets for smart grids, intelligent mobility corridors, and AI-enabled security operations. Data-center capex exceeding USD 2 billion annually fuels demand for resilient network operations centers that manage thermal loads and power usage effectiveness.
Europe and Asia-Pacific maintain healthy expansion as they digitize manufacturing and roll out smart-city infrastructure. European utilities leverage control rooms to balance intermittent renewables, while Asian megacities require synchronized rail and road oversight. Government incentives for domestic semiconductor fabrication also ease hardware supply constraints, improving project delivery timelines.
- Barco NV
- Samsung Electronics Co., Ltd.
- Christie Digital Systems USA, Inc.
- Leyard Optoelectronic Co., Ltd.
- Delta Electronics, Inc.
- Mitsubishi Electric Corporation
- NEC Corporation
- LG Electronics Inc.
- ABB Ltd.
- Siemens AG
- Planar Systems, Inc.
- Prysm Systems Inc.
- Jupiter Systems, Inc.
- VuWall Technology Inc.
- Datapath Limited
- Kramer Electronics Ltd.
- Black Box Corporation
- EIZO Corporation
- RGB Spectrum, Inc.
- Haivision Systems Inc.
Additional Benefits:
- The market estimate (ME) sheet in Excel format
- 3 months of analyst support
TABLE OF CONTENTS
1 INTRODUCTION
- 1.1 Study Assumptions and Market Definition
- 1.2 Scope of the Study
2 RESEARCH METHODOLOGY
3 EXECUTIVE SUMMARY
4 MARKET LANDSCAPE
- 4.1 Market Overview
- 4.2 Market Drivers
- 4.2.1 Surging demand for real-time situational awareness in mission-critical industries
- 4.2.2 Accelerated upgrade cycle from LCD to fine-pitch LED video walls
- 4.2.3 Convergence of OT/IT and wider adoption of unified control-room software platforms
- 4.2.4 Growing preference for cloud-connected remote and hybrid control-room architectures
- 4.2.5 AI-powered analytics enabling predictive operations and incident prevention
- 4.2.6 Government-funded smart-infrastructure programs (transport, energy, public safety)
- 4.3 Market Restraints
- 4.3.1 High total cost of ownership for large-format direct-view LED walls
- 4.3.2 Cyber-security vulnerabilities across converged OT/IT control environments
- 4.3.3 Skill-set shortage in advanced AV-over-IP and data-fusion system integration
- 4.3.4 Supply-chain volatility for display and specialty semiconductor components
- 4.4 Industry Value / Supply-Chain Analysis
- 4.5 Regulatory Landscape
- 4.6 Technological Outlook
- 4.7 Porter's Five Forces Analysis
- 4.7.1 Threat of New Entrants
- 4.7.2 Bargaining Power of Suppliers
- 4.7.3 Bargaining Power of Buyers
- 4.7.4 Threat of Substitutes
- 4.7.5 Degree of Rivalry
5 MARKET SIZE AND GROWTH FORECASTS (VALUE)
- 5.1 By Component
- 5.1.1 Video Wall Displays (LED)
- 5.1.2 Video Wall Displays (LCD)
- 5.1.3 Rear-Projection Cubes
- 5.1.4 Video Wall Controllers
- 5.1.5 Control-Room Consoles and Furniture
- 5.1.6 KVM and Signal-Management Switches
- 5.1.7 Integrated Software and Middleware
- 5.1.8 Services (Design, Integration, O&M)
- 5.2 By Deployment Mode
- 5.2.1 On-Premise
- 5.2.2 Cloud
- 5.2.3 Hybrid
- 5.3 By End-User Industry
- 5.3.1 Energy and Utilities
- 5.3.2 Transportation and Logistics
- 5.3.3 Public Safety and Security
- 5.3.4 Manufacturing and Process Industries
- 5.3.5 Healthcare
- 5.3.6 Defense and Aerospace
- 5.3.7 IT and Telecommunications
- 5.3.8 Other End-User Industry
- 5.4 By Application
- 5.4.1 Command and Control Centers
- 5.4.2 Process Control and Monitoring
- 5.4.3 Emergency and Incident Management
- 5.4.4 Surveillance and Security Monitoring
- 5.4.5 Network Operations Centers (NOCs)
- 5.4.6 Broadcast and Media Control Rooms
- 5.5 By Geography
- 5.5.1 North America
- 5.5.1.1 United States
- 5.5.1.2 Canada
- 5.5.1.3 Mexico
- 5.5.2 Europe
- 5.5.2.1 Germany
- 5.5.2.2 United Kingdom
- 5.5.2.3 France
- 5.5.2.4 Russia
- 5.5.2.5 Rest of Europe
- 5.5.3 Asia-Pacific
- 5.5.3.1 China
- 5.5.3.2 Japan
- 5.5.3.3 India
- 5.5.3.4 South Korea
- 5.5.3.5 Australia
- 5.5.3.6 Rest of Asia-Pacific
- 5.5.4 Middle East and Africa
- 5.5.4.1 Middle East
- 5.5.4.1.1 Saudi Arabia
- 5.5.4.1.2 United Arab Emirates
- 5.5.4.1.3 Rest of Middle East
- 5.5.4.2 Africa
- 5.5.4.2.1 South Africa
- 5.5.4.2.2 Egypt
- 5.5.4.2.3 Rest of Africa
- 5.5.4.1 Middle East
- 5.5.5 South America
- 5.5.5.1 Brazil
- 5.5.5.2 Argentina
- 5.5.5.3 Rest of South America
- 5.5.1 North America
6 COMPETITIVE LANDSCAPE
- 6.1 Market Concentration
- 6.2 Strategic Moves
- 6.3 Market Share Analysis
- 6.4 Company Profiles (includes Global level Overview, Market level overview, Core Segments, Financials as available, Strategic Information, Market Rank/Share for key companies, Products and Services, and Recent Developments)
- 6.4.1 Barco NV
- 6.4.2 Samsung Electronics Co., Ltd.
- 6.4.3 Christie Digital Systems USA, Inc.
- 6.4.4 Leyard Optoelectronic Co., Ltd.
- 6.4.5 Delta Electronics, Inc.
- 6.4.6 Mitsubishi Electric Corporation
- 6.4.7 NEC Corporation
- 6.4.8 LG Electronics Inc.
- 6.4.9 ABB Ltd.
- 6.4.10 Siemens AG
- 6.4.11 Planar Systems, Inc.
- 6.4.12 Prysm Systems Inc.
- 6.4.13 Jupiter Systems, Inc.
- 6.4.14 VuWall Technology Inc.
- 6.4.15 Datapath Limited
- 6.4.16 Kramer Electronics Ltd.
- 6.4.17 Black Box Corporation
- 6.4.18 EIZO Corporation
- 6.4.19 RGB Spectrum, Inc.
- 6.4.20 Haivision Systems Inc.
7 MARKET OPPORTUNITIES AND FUTURE OUTLOOK
- 7.1 White-space and Unmet-Need Assessment
