
|
시장보고서
상품코드
2072727
Scope 3 배출량 관리 소프트웨어 시장 : 시장 점유율 분석, 업계 동향 및 통계, 성장 예측(2026-2031년)Scope 3 Emissions Management Software - Market Share Analysis, Industry Trends & Statistics, Growth Forecasts (2026 - 2031) |
||||||
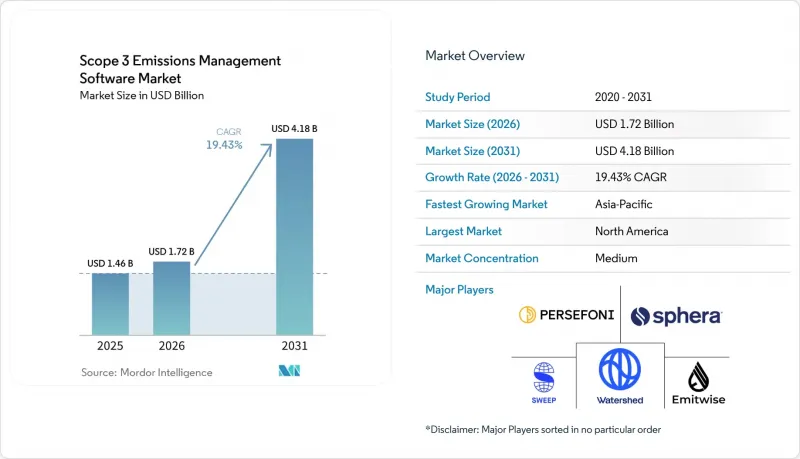
Mordor Intelligence에 의하면, Scope 3 배출량 관리 소프트웨어 시장은 2025년에 14억 6,000만 달러로 평가되었고, 2026년 17억 2,000만 달러로 추정되고, 2031년까지 41억 8,000만 달러에 이를 것으로 예측되며, 2026-2031년 연평균 복합 성장률(CAGR)은 19.43%를 나타낼 전망입니다.

본 보고서는 제공 형태별(소프트웨어 및 서비스), 도입 형태별(클라우드 기반, 온프레미스형, 하이브리드형), 기업 규모별(대기업 및 중소기업), 용도별(Scope 3 산정 및 공개 등), 최종 사용자 산업 분야별(제조 및 산업, 에너지 등) 및 지역별로 분류되어 있습니다. 시장 전망은 금액(달러) 기준으로 제시되어 있습니다.
세계의 Scope 3 배출량 관리 소프트웨어 시장 동향 및 인사이트
주요 경제권에서의 Scope 3 공시 의무 확대
유럽과 호주에서 기후 변화 보고가 의무화됨에 따라, Scope 3 관련 업무는 반복 가능한 관리, 감사 추적 및 보증 대응이 가능한 워크플로우를 지원할 수 있는 소프트웨어 플랫폼으로 전환되고 있습니다. 유럽에서는 ESRS E1에 따라 대상 기업의 보고 범위에 Scope 3가 계속 포함되어 있으며, 데이터 수집 및 계산 논리가 규정 준수에 직접적인 영향을 미치게 되었습니다. 1단계 보고 대상 기업들은 2027년 공시를 앞두고 2026년 데이터를 바탕으로 공시 준비를 진행 중이며, 이에 따라 기업들은 임시방편적인 스프레드시트에서 연간 보고 주기를 지속적으로 뒷받침할 수 있는 시스템으로의 전환을 요구받고 있습니다. 호주에서는 2025년 1월부터 이미 그룹 1에 속하는 사업체를 기후 변화 정보 공개 의무 대상에 포함시켰으며, 캘리포니아주의 SB 253 법안은 보다 상세한 배출량 공개가 동종 업계 타사와의 비교 및 투자자의 평가 기준을 변화시킬 것으로 예상에 따라, 두 번째 주요 규정 준수 채널을 추가했습니다. 이러한 시너지 효과로 인해 Scope 3 배출량 관리 소프트웨어 시장이 성장세를 보이고 있습니다. 이는 구매자들이 다양한 산업 분야에 걸친 규제 변화에 대응할 수 있는 플랫폼을 점점 더 선호하고 있기 때문입니다.
공급업체로부터의 데이터 수집 자동화가 보고 부담을 줄여줌
업스트림 보고의 품질은 공급업체에 대한 일관된 소통, 응답 추적 및 검증에 달려 있으므로, 공급업체로부터의 데이터 수집은 Scope 3 배출량 관리 소프트웨어 시장의 핵심 업무로 자리 잡고 있습니다. CDP공급망 프로그램에 따르면, 2025년에는 330개의 주요 기업 구매처가 약 7만 개공급업체에 환경 정보 공개를 요청할 것으로 예상되며, 기업 규모상 수동적인 수집 방식을 유지하기는 어려워지고 있습니다. 이러한 압박은 단순히 설문지를 발송하는 데 그치지 않습니다. 왜냐하면, 답변의 완전성과 조사 방법의 정확성이 해당 데이터가 보증 업무나 목표 설정에 활용될 수 있는지 여부에 영향을 미치게 되었기 때문입니다. 또한 CDP의 조사에 따르면, 공급업체가 보고한 배출량의 38%에는 보고치를 25% 이상 변동시킬 정도로 중대한 조사 방법상의 오류가 포함되어 있었으며, 이로 인해 내장형 검증 도구의 가치가 높아졌습니다. 따라서, 가이드 기반 데이터 입력, 이상 감지, 알림, 배출 계수 할당 기능을 결합한 플랫폼들은 단순한 데이터 수집량뿐만 아니라 데이터의 활용 편의성 측면에서도 경쟁을 펼치고 있습니다. 이러한 추세는 Scope 3 배출량 관리 소프트웨어 시장을 지속적으로 견인하고 있으며, 해당 소프트웨어를 구매하는 기업들은 공급망 전반에 걸친 보고 업무의 번거로움을 줄이고 수동 수정 과정을 최소화하기 위해 비용을 지불하고 있습니다.
파편화된 공급업체 데이터와 1차 데이터의 낮은 커버리지
많은 기업 프로그램에서 1차 데이터의 포괄성은 여전히 미흡하며, 공급업체의 보다 적극적인 참여 없이는 소프트웨어가 보고서의 질을 향상시킬 수 있는 범위는 제한적입니다. Sphera의 2025년 조사에 따르면, 79%의 조직이 공급업체 데이터의 접근성을 가장 큰 과제로 꼽았으며, 62%는 정확한 정보 공개의 주요 장애물로 내부 데이터의 품질을 지목했습니다. 이러한 구조적 취약점은 2026년에도 지속되었으며, Sphera의 보고서에 따르면, 89%의 경영진이 보고 범위를 확대할 계획을 가지고 있었음에도 불구하고, 45%는 Scope 3 데이터의 정확성에 대해 제한적인 신뢰만을 가지고 있는 것으로 나타났습니다. 규제 강화에 따라 추적 가능하고 설명 가능한 정보 공개가 요구되는 반면, 많은 데이터 세트는 여전히 공급업체가 제공한 불완전한 답변이나 추정치에 의존하고 있어 이러한 격차는 중요한 문제로 대두되고 있습니다. 현재 바이어들은 플랫폼 측에 지출 기반의 추정치에서 감사 가능성이 더 높은 1차 데이터로의 전환 경로를 제시해 줄 것을 기대하고 있으며, 이러한 기대는 공급업체의 준비 태세가 미흡할 경우 도입 작업을 장기화시키는 요인이 됩니다. 공급업체의 참여가 확대되고 일관성이 높아지기 전까지는 도입 일정이 장기화되고 보증의 신뢰성이 저하되어, Scope 3 배출량 관리 소프트웨어 시장의 성장세가 계속해서 둔화될 것입니다.
부문별 분석
Scope 3 배출량 관리 소프트웨어 시장에서 2025년 매출에서 소프트웨어가 차지하는 비중은 71.28%였으나, 서비스 부문은 2031년까지 연평균 성장률(CAGR) 21.34%로 성장할 것으로 전망됩니다. 이러한 구성 비율은 계산 로직, 공시 템플릿, 워크플로우 관리, 공급업체 참여 도구를 단일 시스템으로 통합한 전용 플랫폼이 수행하는 핵심적인 역할을 반영하고 있습니다. 구매자들은 사내 IT 주기를 길게 끌지 않으면서 규제 업데이트나 방법 변경을 반영하고자 하기 때문에 클라우드 기반 소프트웨어는 계속해서 이 부문의 핵심 제공 모델로 자리 잡고 있습니다. 반면, 배출 범위, 공급업체의 데이터 품질, 프레임워크와의 일관성 등에 대해서는 여전히 수동으로 설정하거나 검토해야 하기 때문에 라이선스 계약 체결 후의 도입 작업은 종종 매우 어렵습니다.
이러한 서비스 수요는 소프트웨어 수요의 부진 때문이 아니라, 운영 준비가 얼마나 잘 되어 있는지에 기인합니다. 많은 기업에서는 도구를 효과적으로 활용하기 위해 필요한 데이터를 정리하는 것보다 도구를 구입하는 편이 더 빠르기 때문입니다. Sphera사의 2026년 보고서에 따르면, 89%의 기업이 Scope 3 보고 범위를 확대할 계획을 가지고 있는 반면, 45%의 기업은 여전히 데이터의 정확성에 대해 제한적인 신뢰만을 보이고 있으며, 이는 관리형 지원 및 자문 서비스에 분명한 여지를 남기고 있습니다. 따라서 플랫폼 도입 지원, 데이터 컨설팅, 보증 대응 준비를 하나의 패키지로 묶어 제공하는 벤더는 초기 구독 계약을 넘어 고객 가치를 확대되고 있습니다. 순수한 SaaS 제공업체는 더 대규모이고 규제가 엄격한 구매 주기에서 입지를 유지하려면, 서비스 체계를 직접 확충하거나 전문 파트너와 협력해야 한다는 압박에 직면해 있습니다.
Scope 3 배출량 관리 소프트웨어 시장에서 2025년에는 클라우드가 66.45%의 점유율을 차지한 것으로 평가되었으며, 하이브리드 시장은 2031년까지 연평균 성장률(CAGR) 22.12%로 확대될 것으로 전망됩니다. 클라우드는 유지보수 부담을 줄이고, 기능 업데이트를 신속하게 처리하며, 최신 재무·조달 시스템과의 호환성이 높기 때문에 여전히 주요 모델로 자리 잡고 있습니다. 그렇긴 하지만, 가장 상세한 활동 데이터는 여전히 많은 기업이 온프레미스나 프라이빗 클라우드 환경에서 운영하고 있는 ERP의 거래 기록, 운송 시스템, 조달 데이터베이스에 저장되어 있는 경우가 많습니다. 그 때문에 하이브리드 아키텍처가 주목을 받고 있습니다. 이는 기업이 기밀성이 높은 운영 기록을 기존 시스템에 보관하면서, 그 위에 클라우드의 분석 및 보고 기능을 활용할 수 있기 때문입니다.
SAP의 2026년 제품 업데이트에서는 공급업체가 이러한 요구에 어떻게 대응하고 있는지가 드러났습니다. 구체적으로는 ERP를 중심으로 한 운송 관련 탄소 발자국 계산의 확대와 워크플로우 내 국가별 공급망 배출량 데이터 세트의 추가 등을 들 수 있습니다. 이러한 기능들은 하이브리드 배포를 통해, 원래 거래부터 보고되는 탄소 발자국에 이르기까지의 '체인 오브 카스토디(관리의 연쇄)' 점이 더욱 명확해지기 때문에 중요하며, 이는 관리 및 감사 추적 측면에서 그 가치가 점점 더 높아지고 있습니다. 독립형 온프레미스 모델 시장 점유율은 하락하고 있지만, 그 기반이 되는 인프라는 여전히 많은 대기업의 아키텍처에서 없어서는 안 될 요소입니다. 해당 환경에 연결할 수 없는 벤더는 보고서 작성 속도뿐만 아니라 데이터 계보, 주권, 통합의 깊이 등이 중요하게 여겨지는 엔터프라이즈 프로젝트를 놓칠 위험이 있습니다.
지역별 분석
2025년, 북미는 Scope 3 배출량 관리 소프트웨어 시장 규모의 35.40%를 차지했습니다. 캘리포니아주의 SB 253 및 관련 기후 정보 공개 규정에 따라 대기업들이 보다 공식적인 Scope 3 보고 시스템을 도입하도록 장려됨에 따라, 미국이 지역 수요의 상당 부분을 주도했습니다. 이에 따라 조달의 우선순위는 일회성 측정 작업에서 지속적인 데이터 수집, 문서화 및 외부 검토를 지원할 수 있는 플랫폼으로 변화했습니다. 또한, 이 지역의 구매 동향에는 AI를 활용한 워크플로우에 대한 강한 수요도 반영되어 있습니다. 이는 기업들이 데이터 정리, 시나리오 모델링, 그리고 재무 및 조달 데이터와의 통합을 보다 신속하게 수행하고자 하기 때문입니다. 이러한 환경에서는 이미 기업의 운영 체제와 연동되어 있어, 주요 고객사 내에서 전환에 따른 마찰을 줄일 수 있는 공급업체가 유리합니다.
유럽은 Scope 3 배출량 관리 소프트웨어 시장에서 여전히 2위의 규모를 자랑하는 지역입니다. CSRD(기업 지속가능성 보고 지침)에 따라, 보고 대상 기업에 대한 Scope 3 공시는 ESRS E1의 범위 내로 제한되어 있으며, 이는 지역 전체에서 감사 가능한 보고 워크플로우에 대한 수요를 지속적으로 뒷받침하고 있습니다. 1단계 대상 기업들은 2027년에 2026년 데이터를 보고할 준비를 진행 중이지만, 옴니버스 개정안으로 인해 이후 보고 단계는 연기되었습니다. 이로 인해 일정은 변경되었지만, 소프트웨어 투자가 필요 없어지는 것은 아닙니다. 또한, 유럽연합 집행위원회의 가치사슬 상한선에 따라 대규모 보고 기업이 소규모 공급업체에 요구할 수 있는 정보의 양에도 제한이 설정되어 있으며, 이는 공급업체 참여 도구가 업스트림 단계의 1차 데이터를 어느 정도 깊이까지 수집할 수 있는지에 영향을 미치고 있습니다. 독일은 탄탄한 산업 기반을 바탕으로 여전히 강력한 수요 거점이며, 한편 프랑스는 지역 혁신을 뒷받침하는 긴밀한 공급업체 생태계를 제공합니다.
아시아태평양은 2031년까지 연평균 성장률(CAGR) 25.67%를 기록하며 성장할 것으로 예상되며, Scope 3 배출량 관리 소프트웨어 시장에서 가장 빠르게 성장하는 지역이 될 전망입니다. 호주에서는 2025년 1월부터 그룹 1 기업에 대해 기후 변화 정보 공개를 의무화했으며, 2026년 7월부터는 그룹 2 기업으로 이 제도를 확대하여 Scope 3도 대상에 포함시켰습니다. 또한, 수출 지향적인 공급망 역시 이 지역 전체 수요를 뒷받침하고 있습니다. 이는 공급업체가 구매자의 요구 사항이나 국경을 초월한 보고 요건을 충족하기 위해 탄소 데이터에 대한 수요가 증가하고 있기 때문입니다. 남미, 중동 및 아프리카는 여전히 초기 단계 시장이며, 도입은 주로 다국적 기업의 보고 요건, 국내 대기업, 그리고 국경을 넘는 공급망 참여에 의해 주도되고 있습니다.
기타 혜택 :
- 엑셀 형식 시장 예측(ME) 시트
- 3개월간의 애널리스트 지원
자주 묻는 질문
목차
제1장 서론
제2장 조사 방법
제3장 주요 요약
제4장 시장 구도
제5장 시장 규모 및 성장 예측
제6장 경쟁 구도
제7장 시장 기회 및 향후 전망
AJY 26.07.03According to Mordor Intelligence, the scope 3 emissions management software market was valued at USD 1.46 billion in 2025 and is estimated to grow from USD 1.72 billion in 2026 to reach USD 4.18 billion by 2031, at a CAGR of 19.43% during 2026-2031.
This report is Segmented by Offering (Software, and Services), Deployment Mode (Cloud-Based, On-Premises, and Hybrid), Enterprise Size (Large Enterprises, and Small and Medium Enterprises), Application (Scope 3 Accounting and Disclosure, and More), End-User Industry (Manufacturing and Industrial, Energy, and More), and Geography. The Market Forecasts are Provided in Terms of Value (USD).
Global Scope 3 Emissions Management Software Market Trends and Insights
Rising Scope 3 Disclosure Mandates Across Major Economies
Mandatory climate reporting rules in Europe and Australia are moving Scope 3 work onto software platforms that can support repeatable controls, audit trails, and assurance-readiness workflows. In Europe, ESRS E1 continues to keep Scope 3 within the reporting perimeter for in-scope companies, meaning data gathering and calculation logic now carry direct compliance consequences. Wave 1 reporters are preparing disclosures on 2026 data for 2027 publication, which pushes companies to replace ad hoc spreadsheets with systems that can sustain year-after-year reporting cycles. Australia already brought Group 1 entities into mandatory climate disclosure in January 2025 andV. California's SB 253 added a second major compliance channel, because fuller emissions disclosure is expected to alter peer comparisons and investor evaluation inputs. This combination is supporting the Scope 3 Emissions Management Software Market, because buyers increasingly prefer platforms that can absorb rule changes across sectors.
Supplier Data Collection Automation Reduces Reporting Friction
Supplier data collection has become the operational core of the Scope 3 Emissions Management Software Market, as upstream reporting quality depends on consistent supplier outreach, response tracking, and validation. CDP's supply chain program showed in 2025 that 330 leading corporate buyers requested environmental disclosures from nearly 70,000 suppliers, making manual collection methods hard to sustain at an enterprise scale. The pressure is not limited to sending questionnaires, because response completeness and methodological accuracy now influence whether the data can be used in assurance and target-setting work. CDP also found that 38% of supplier-reported emissions contained methodological errors large enough to change reported values by more than 25%, which raised the value of built-in validation tools. Platforms that combine guided data entry, anomaly flags, reminders, and emission-factor assignment are therefore competing on data usability rather than on collection volume alone. That dynamic continues to drive the Scope 3 Emissions Management Software Market, as buyers pay for lower reporting friction and fewer manual correction loops across supplier networks.
Fragmented Supplier Data And Low Primary Data Coverage
Primary data coverage remains thin across many enterprise programs, limiting how far software can improve reporting quality without stronger supplier participation. Sphera found in 2025 that 79% of organizations cited supplier data availability as a top challenge, and 62% cited internal data quality as a major barrier to accurate disclosure. The same structural weakness persisted in 2026, when Sphera reported that 45% of business leaders had only limited confidence in the accuracy of Scope 3 data, even though 89% planned to expand reporting coverage. This gap matters because greater regulation requires traceable, explainable disclosures, while many datasets still rely on partial supplier responses and estimates. Buyers now expect platforms to show a path from spend-based estimation toward more auditable primary data, and that expectation lengthens implementation work where supplier readiness is weak. Until supplier participation deepens and becomes more consistent, this will continue to slow the Scope 3 Emissions Management Software Market by stretching deployment timelines and limiting assurance confidence.
Other drivers and restraints analyzed in the detailed report include:
- Investor And Customer Pressure On Value-Chain Transparency
- AI-Assisted Spend-Based Emissions Estimation Lowers Entry Barriers
- Methodology Differences Across Frameworks Limit Comparability
For complete list of drivers and restraints, kindly check the Table Of Contents.
Segment Analysis
Software accounted for 71.28% of revenue in 2025, while services are projected to grow at a 21.34% CAGR through 2031 in the Scope 3 Emissions Management Software Market. This mix reflects the central role of purpose-built platforms that bring together calculation logic, disclosure templates, workflow controls, and supplier engagement tools into a single system. Cloud-delivered software remains the core delivery model in this segment, as buyers want regulatory updates and method changes reflected without long internal IT cycles. At the same time, implementation work often becomes more difficult after the license is signed, because emissions boundaries, supplier data quality, and framework alignment still require manual configuration and review.
That service demand is tied to operational readiness rather than to weak software demand, because many companies can buy the tool faster than they can organize the data needed to use it well. Sphera reported in 2026 that 89% of companies planned to expand Scope 3 reporting, while 45% still had only limited confidence in data accuracy, which leaves clear room for managed support and advisory work. Vendors that package implementation, data consulting, and assurance-readiness support with the platform are therefore extending customer value beyond the initial subscription. Pure SaaS providers face pressure to add service capacity directly or work with specialist partners if they want to stay relevant in larger and more regulated buying cycles.
Cloud held 66.45% share in 2025, while hybrid is projected to expand at a 22.12% CAGR through 2031 in the Scope 3 Emissions Management Software Market. Cloud remains the leading model because it lowers maintenance burdens, speeds feature updates, and fits well with modern finance and procurement systems. Even so, the most detailed activity data often resides in ERP transaction records, transport systems, and procurement databases that many enterprises still run in on-premises or private cloud environments. That is why hybrid architecture is gaining momentum, because it lets companies keep sensitive operational records in established systems while using cloud analytics and reporting layers on top.
SAP's 2026 product updates showed how vendors are adapting to this need, with extended ERP-centric transport footprint calculations and additional country-specific supply chain emissions datasets inside the workflow. These features matter because hybrid deployment supports a clearer chain of custody from the source transaction to the reported footprint, which is increasingly valuable for controls and audit trails. Standalone on-premises models are losing share, yet the underlying infrastructure remains critical in many large-company architectures. Vendors that cannot connect to that environment risk losing enterprise deals where data lineage, sovereignty, and integration depth matter as much as reporting speed.
Complete Report Scope:
- By Offering
- Software
- Services
- By Deployment Mode
- Cloud-Based
- On-Premises
- Hybrid
- By Enterprise Size
- Large Enterprises
- Small and Medium Enterprises
- By Application
- Scope 3 Accounting and Disclosure
- Supplier Engagement and Primary Data Collection
- Value-Chain Decarbonization Planning
- Assurance, Governance and Compliance
- By End-user Industry
- Manufacturing and Industrial
- Retail and Consumer Goods
- Energy, Utilities and Natural Resources
- Transportation and Logistics
- BFSI
- IT and Telecom
- Healthcare and Life Sciences
- Government and Public Sector
- Other End-user Industries
- By Geography
- North America
- United States
- Canada
- Mexico
- South America
- Brazil
- Argentina
- Rest of South America
- Europe
- Germany
- United Kingdom
- France
- Italy
- Spain
- Russia
- Netherlands
- Rest of Europe
- Asia-Pacific
- China
- Japan
- India
- South Korea
- Australia and New Zealand
- Rest of Asia-Pacific
- Middle East
- Saudi Arabia
- United Arab Emirates
- Rest of Middle East
- Africa
- South Africa
- Nigeria
- Rest of Africa
- North America
Geography Analysis
North America accounted for 35.40% of the Scope 3 Emissions Management Software Market size in 2025. The United States drove most regional demand because California's SB 253 and related climate disclosure rules pushed large companies toward more formal Scope 3 reporting systems. This changed procurement priorities from one-off measurement exercises to platforms that can support recurring data collection, documentation, and external review. The regional buying pattern also reflects strong demand for AI-supported workflows, because enterprises want faster cleanup, scenario modeling, and integration with finance and procurement data. That environment favors vendors that already connect to enterprise operating systems and can reduce switching friction inside large accounts.
Europe remained the second-largest geography in the Scope 3 Emissions Management Software Market. CSRD kept Scope 3 disclosure within ESRS E1 for in-scope reporters, which continues to anchor demand for auditable reporting workflows across the region. Wave 1 companies are preparing to report on 2026 data in 2027, while the Omnibus changes delayed later reporting waves, shifting the timing but not removing the need for software investment. The European Commission's value chain cap also limits how much information large reporters can require from smaller suppliers, which affects how deeply supplier-engagement tools can push for primary upstream data. Germany remains a strong demand center because of its industrial base, while France contributes a dense vendor ecosystem that supports regional innovation.
Asia-Pacific is projected to grow at a 25.67% CAGR through 2031, making it the fastest-growing region in the Scope 3 Emissions Management Software Market. Australia required Group 1 entities to begin mandatory climate disclosures in January 2025 and extended the framework to Group 2 entities from July 2026, with Scope 3 included in scope. Export-oriented supply chains are also reinforcing demand across the region, as suppliers increasingly need carbon data to meet buyer requests and cross-border reporting requirements. South America, the Middle East, and Africa remain earlier-stage markets, with adoption led mainly by multinational reporting requirements, large domestic enterprises, and cross-border supply-chain participation.
- Watershed
- Persefoni, LLC
- Sweep SAS
- Green Project Technologies Inc.
- Altruistiq Limited
- Greenly SAS
- Sphera Solutions, Inc.
- Ecovadis SAS
- Salesforce, Inc.
- Microsoft Corporation
- SAP SE
- IBM Corporation
- Wolters Kluwer N.V.
- ENGIE Impact, LLC
- Schneider Electric SE
- Carbonflow
- Certivo
- Workiva Inc.
- FigBytes Inc.
- Normative AB
- Plan A Technologies GmbH
- Optera, Inc.
- Position Green AB
Additional Benefits:
- The market estimate (ME) sheet in Excel format
- 3 months of analyst support
TABLE OF CONTENTS
1 INTRODUCTION
- 1.1 Study Assumptions and Market Definition
- 1.2 Scope of the Study
2 RESEARCH METHODOLOGY
3 EXECUTIVE SUMMARY
4 MARKET LANDSCAPE
- 4.1 Market Overview
- 4.2 Market Drivers
- 4.2.1 Rising Scope 3 Disclosure Mandates Across Major Economies
- 4.2.2 Supplier Data Collection Automation Reduces Reporting Friction
- 4.2.3 Investor And Customer Pressure On Value-Chain Transparency
- 4.2.4 AI-Assisted Spend-Based Emissions Estimation Lowers Entry Barriers
- 4.2.5 Shift Toward Audit-Ready Sustainability Controls And Data Lineage
- 4.2.6 Procurement-Led Decarbonization Programs Expand Software Budgets
- 4.3 Market Restraints
- 4.3.1 Fragmented Supplier Data And Low Primary Data Coverage
- 4.3.2 Methodology Differences Across Frameworks Limit Comparability
- 4.3.3 Integration Complexity With ERP, Procurement, And ESG Stacks
- 4.3.4 Budget Pressure For Mid-Market Buyers And Long Sales Cycles
- 4.4 Industry Value-Chain Analysis
- 4.5 Impact of Macroeconomic Factors on the Market
- 4.6 Regulatory Landscape
- 4.7 Technological Outlook
- 4.8 Porter's Five Forces Analysis
- 4.8.1 Bargaining Power of Buyers
- 4.8.2 Bargaining Power of Suppliers
- 4.8.3 Threat of New Entrants
- 4.8.4 Threat of Substitutes
- 4.8.5 Intensity of Comptetive Rivalry
5 MARKET SIZE AND GROWTH FORECASTS (VALUE)
- 5.1 By Offering
- 5.1.1 Software
- 5.1.2 Services
- 5.2 By Deployment Mode
- 5.2.1 Cloud-Based
- 5.2.2 On-Premises
- 5.2.3 Hybrid
- 5.3 By Enterprise Size
- 5.3.1 Large Enterprises
- 5.3.2 Small and Medium Enterprises
- 5.4 By Application
- 5.4.1 Scope 3 Accounting and Disclosure
- 5.4.2 Supplier Engagement and Primary Data Collection
- 5.4.3 Value-Chain Decarbonization Planning
- 5.4.4 Assurance, Governance and Compliance
- 5.5 By End-user Industry
- 5.5.1 Manufacturing and Industrial
- 5.5.2 Retail and Consumer Goods
- 5.5.3 Energy, Utilities and Natural Resources
- 5.5.4 Transportation and Logistics
- 5.5.5 BFSI
- 5.5.6 IT and Telecom
- 5.5.7 Healthcare and Life Sciences
- 5.5.8 Government and Public Sector
- 5.5.9 Other End-user Industries
- 5.6 By Geography
- 5.6.1 North America
- 5.6.1.1 United States
- 5.6.1.2 Canada
- 5.6.1.3 Mexico
- 5.6.2 South America
- 5.6.2.1 Brazil
- 5.6.2.2 Argentina
- 5.6.2.3 Rest of South America
- 5.6.3 Europe
- 5.6.3.1 Germany
- 5.6.3.2 United Kingdom
- 5.6.3.3 France
- 5.6.3.4 Italy
- 5.6.3.5 Spain
- 5.6.3.6 Russia
- 5.6.3.7 Netherlands
- 5.6.3.8 Rest of Europe
- 5.6.4 Asia-Pacific
- 5.6.4.1 China
- 5.6.4.2 Japan
- 5.6.4.3 India
- 5.6.4.4 South Korea
- 5.6.4.5 Australia and New Zealand
- 5.6.4.6 Rest of Asia-Pacific
- 5.6.5 Middle East
- 5.6.5.1 Saudi Arabia
- 5.6.5.2 United Arab Emirates
- 5.6.5.3 Rest of Middle East
- 5.6.6 Africa
- 5.6.6.1 South Africa
- 5.6.6.2 Nigeria
- 5.6.6.3 Rest of Africa
- 5.6.1 North America
6 COMPETITIVE LANDSCAPE
- 6.1 Market Concentration
- 6.2 Strategic Moves
- 6.3 Market Share Analysis
- 6.4 Company Profiles (includes Global Level Overview, Market Level Overview, Core Segments, Financials as available, Strategic Information, Market Rank/Share, Products and Services, Recent Developments)
- 6.4.1 Watershed
- 6.4.2 Persefoni, LLC
- 6.4.3 Sweep SAS
- 6.4.4 Green Project Technologies Inc.
- 6.4.5 Altruistiq Limited
- 6.4.6 Greenly SAS
- 6.4.7 Sphera Solutions, Inc.
- 6.4.8 Ecovadis SAS
- 6.4.9 Salesforce, Inc.
- 6.4.10 Microsoft Corporation
- 6.4.11 SAP SE
- 6.4.12 IBM Corporation
- 6.4.13 Wolters Kluwer N.V.
- 6.4.14 ENGIE Impact, LLC
- 6.4.15 Schneider Electric SE
- 6.4.16 Carbonflow
- 6.4.17 Certivo
- 6.4.18 Workiva Inc.
- 6.4.19 FigBytes Inc.
- 6.4.20 Normative AB
- 6.4.21 Plan A Technologies GmbH
- 6.4.22 Optera, Inc.
- 6.4.23 Position Green AB
7 MARKET OPPORTUNITIES AND FUTURE OUTLOOK
- 7.1 White-space and Unmet-Need Assessment

