

|
시장보고서
상품코드
2073363
마이크로모빌리티 : 시장 점유율 분석, 업계 동향 및 통계, 성장 예측(2026-2031년)Micro Mobility - Market Share Analysis, Industry Trends & Statistics, Growth Forecasts (2026 - 2031) |
||||||
 Mordor Intelligence
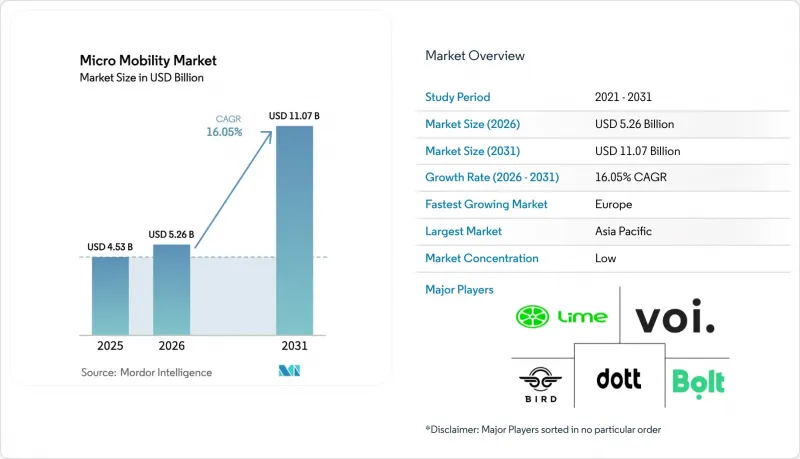
Mordor Intelligence에 의하면, 세계의 마이크로모빌리티 시장 규모는 2025년에 45억 3,000만 달러로 평가되었습니다. 2026년 52억 6,000만 달러에서 2031년까지 110억 7,000만 달러에 이를 것으로 예상되며, 예측 기간(2026-2031년) CAGR은 16.05%를 나타낼 전망입니다.
본 보고서는 차량 유형(전동 킥스쿠터, 전동 모페트, 전동 자전거, 전동 스케이트보드 등), 배터리 유형(밀폐형 납축전지, 니켈수소전지, 리튬이온전지), 전압(24V 미만, 36V, 48V, 48V 이상), 공유 모델(도크식, 도크리스식, 구독형), 지역(북미 등)별로 분류되어 있습니다. 시장 전망은 금액(달러) 및 수량(대) 단위로 제시되어 있습니다.
세계의 마이크로모빌리티 시장 동향 및 인사이트
도시 지역의 급격한 교통 체증과 팬데믹 이후의 이동 수단 변화
2024년 이후, 주요 도시의 교통 밀도는 15-20% 증가했으며, 통근자들은 교통 체증을 피할 수 있는 기동성이 뛰어난 대체 수단을 찾고 있습니다. 마이크로모빌리티 시장은 현재, 건강상의 이유로 버스나 철도 이용을 줄인 이용자들로 인해 발생한 서비스 공백을 메우고 있습니다. 하이브리드 근무 방식의 확산으로 출퇴근 시간대의 양상이 변화하는 가운데, 전동자전거나 킥스쿠터와 같은 유연한 문 앞까지 이동 수단이 주목받고 있습니다. 복합용도 지구에서는 차량 한 대로 출퇴근, 용무, 여가 활동 등 모든 요구를 충족시킬 수 있기 때문에 도입률이 가장 높습니다. 도시계획 담당자들은 마스터플랜에 전용 차로와 자전거 주차 구역을 반영하기 시작했으며, 이는 현재의 모달 시프트가 일시적인 대응이 아니라 구조적인 재편임을 뒷받침하고 있습니다.
리튬 이온 배터리의 비용 절감으로 주행 거리와 가동 주기가 연장됨
세계 배터리 팩 가격은 계속 하락하고 있어, 제조업체들은 소매 가격을 인상하지 않고도 더 대용량의 48V 유닛을 탑재할 수 있게 되었습니다. 중국에서는 연간 4,500만 대가 넘는 전동 이륜차가 생산되고 있으며, 이는 마이크로모빌리티 시장 전체에 파급되는 유례없는 규모의 경제 효과를 창출하고 있습니다. 최신 배터리 관리 시스템 덕분에 가동 수명이 8년까지 연장되고 총 소유 비용이 절감됨에 따라, 공유 서비스 사업자는 수익성이 높은 감가상각 일정을 운영할 수 있게 되었습니다. 아시아에서 선구적으로 도입되어 현재 유럽으로도 확산되고 있는 배터리 교체 네트워크는 충전으로 인한 가동 중단 시간을 해소하여 택배 업체와 출퇴근자들에게 준연속적인 서비스를 제공합니다.
제각각인 안전 규제와 차량 분류 간의 불일치
속도 제한이나 출력 제한의 차이로 인해 사업자들은 지역별로 서로 다른 차량을 도입할 수밖에 없어, 마이크로모빌리티 시장 규모 확대를 저해하고 있습니다. 유럽연합 집행위원회는 규제 합리화를 위해 통일된 “개인 이동 수단" 카테고리의 도입을 검토하고 있지만, 미국에서는 모터의 출력과 헬멧 착용 의무에 대해 여전히 큰 차이를 보이고 있습니다. 뉴욕시는 2019년부터 2023년까지 전기 이동수단 관련 화재로 인한 피해액이 5억 2,000만 달러에 달한 것을 계기로, “로컬 로 39"를 도입했습니다. 이로 인해 보험 측면의 불확실성이 커지면서 보험료가 상승하고, 위험을 꺼리는 소비자들의 이용을 저해하고 있습니다.
부문별 분석
전동 자전거는 계속해서 마이크로모빌리티 시장 규모의 주축을 이루었으며, 2025년에는 35.74%의 점유율을 차지했습니다. 현재 성장은 화물용 모델로 전환되고 있으며, 유럽의 라스트 마일 택배 수요와 새롭게 등장하는 무공해 구역의 요구를 충족시킴으로써 연평균 성장률(CAGR) 23.65%로 성장을 지속하고, 있습니다. 소매업체와 물류 기업들은 적재량 160kg을 수용할 수 있는 전면 적재식 박스형 디자인으로 전환하고 있으며, 이를 통해 도심 지역에서의 밴 주행 거리를 줄이고 있습니다.
사업자에게 있어 화물용 유닛은 대당 일일 평균 수익이 일반 자전거보다 45% 높기 때문에 높은 초기 투자 비용을 상쇄할 수 있다는 점에서 선호되고 있습니다. 공유 스쿠터 차량은 여가 활동이나 ‘퍼스트 마일’ 수요를 지속적으로 충족시키고 있지만, 사업자들이 수익성을 높이기 위해 기존 네트워크를 최적화함에 따라 확장세는 둔화되고 있습니다. 아시아 시장에서는 일상적인 이동 수단으로 자동차 대신 이륜차가 이용되고 있으며, 모페트가 이동 수단의 공백을 메우고 있어 마이크로모빌리티 시장의 지역별 다양성이 두드러지고 있습니다.
배터리 교체 시 호환성은 거의 연속적인 사용을 목표로 하는 기업 구매자들에게 새로운 구매 기준으로 부상하고 있습니다. 야마하의 “Enyring"가 독일과 네덜란드에 진출한 것은 유럽에서 물류에 대한 관심이 높아지고 있음을 보여줍니다. 반면, 전동 스케이트보드는 일반 도로에서의 사용에 대한 규제상 승인이 제한적이기 때문에 여전히 틈새 오락의 범위를 벗어나지 못하고 있습니다. 전반적으로 차량의 구성을 살펴보면, 하나의 플랫폼으로 모든 도시 지역의 요구를 충족시킬 수는 없으며, 오히려 적재량, 속도, 주행 거리 등의 요건에 부합하는 전용 설계를 통해 가치가 창출되고 있음을 알 수 있습니다.
2025년 기준으로 리튬 이온 배터리는 마이크로모빌리티 시장 규모의 82.65%를 차지했으며, 2031년까지 연평균 성장률(CAGR) 16.62%를 나타낼 것으로 전망됩니다. 이 배터리 화학 시스템의 높은 에너지 밀도와 가격 하락 덕분에, 차량 무게를 늘리지 않고도 장거리 주행이 가능해졌으며, 실제 주행 거리 40-60km를 원하는 통근자들의 기대에 부응하고 있습니다. 예측 분석 기능을 갖춘 첨단 배터리 관리 소프트웨어 덕분에 배터리 팩의 수명이 8년으로 연장되어, 차량 운영 사업자의 회차당 감가상각비가 절감되고 있습니다. 중국의 대규모 생산 체제가 전 세계 공급을 뒷받침하는 한편, 유럽의 조립 제조업체들은 더욱 엄격한 안전 기준을 충족하는 견고한 열 관리 기술을 통해 부가가치를 제공합니다.
밀폐형 납축전지는 초기 비용이 성능을 상회하는 초저가 제품에만 남아 있지만, 중고 리튬 이온 배터리 팩이 재판매 시장에 유입됨에 따라 그 시장 점유율은 계속해서 줄어들고 있습니다. 니켈수소 전지(NiMH)는 여전히 소수파에 속하며, 특수한 산업용 카트나 규제 준수를 목적으로 한 조달에 한정되어 있습니다.
지역별 분석
2025년 마이크로모빌리티 시장 규모 중 아시아태평양이 38.05%를 차지했습니다. 이는 중국 내 4억 대의 전기 이륜차 보급 대수와 2025 회계연도 인도의 114만 대 판매 대수에 힘입은 결과입니다. 중국에서는 평균 소매 가격이 336달러 전후이기 때문에 일반 대중에게도 소유할 기회가 확대되고 있습니다. 한편, 인도에서는 유리한 GST(상품 및 서비스세) 세율과 국내 생산 인센티브 덕분에 차량 보유 규모가 확대되고 있습니다. 유엔환경계획(UNEP)은 아시아 및 아프리카의 저소득 국가들에 1억 3,000만 달러의 보조금을 지원하고 있으며, 이는 수출되는 차량 및 부품의 향후 성장 가능성을 시사하고 있습니다.
연평균 성장률(CAGR) 18.1%로 가장 빠르게 성장하고 있는 유럽은 일관된 기후 정책과 규제 조화가 진전되고 있는 데 따른 혜택을 누리고 있습니다. 독일에서는 2024년에 205만 대의 전기 자전거가 판매되었으며, 평균 가격이 하락했음에도 불구하고 국내 자전거 판매 대수의 53%를 차지했습니다. 사업자들은 규모의 경제를 추구하기 위해 합병을 추진하고 있으며, 그중에서도 1억 5,000만 유로 규모의 ‘Tier-Dott"연합이 주목받고 있습니다. 수익을 중시하는 경향이 강해지고 있으며, 그 한 예로 Voi사가 2024년에 1,720만 유로의 EBITDA를 기록하고, 5,000만 유로 규모의 사채 발행을 통해 부채를 재융자한 사실을 들 수 있습니다. 각 도시가 저공해 구역을 시행하는 가운데, 관세 면제 혜택을 통해 접근을 원하는 물류 기업들의 카고바이크 도입이 가속화되고 있습니다.
북미에서는 5,000만 달러가 넘는 지방 자치단체의 구매 보조금과 4,455만 달러 규모의 연방 정부 액티브 트랜스포테이션 지원금을 바탕으로 연평균 성장률(CAGR) 17.72%로 성장을 지속하고, 있습니다. Lime사는 2년 연속 현금흐름 흑자와 기업공개(IPO) 계획을 통해 상업적 지속가능성을 입증하고 있으며, 확고한 앱 사용자 기반을 바탕으로 이용자를 유치하는 Uber사와의 제휴가 이를 뒷받침하고 있습니다. 그러나 뉴욕시가 화재 관련 비용을 5억 2,000만 달러로 추산함에 따라, 안전에 대한 우려가 시장 심리를 압박하고 있습니다. 건설적인 규제 체계가 마련되고 노상 충전 인프라가 확충되면, 시장이 더욱 확대될 것으로 전망됩니다.
기타 혜택 :
- 엑셀 형식 시장 예측(ME) 시트
- 3개월간의 애널리스트 지원
자주 묻는 질문
목차
제1장 서론
제2장 조사 방법
제3장 주요 요약
제4장 시장 구도
제5장 시장 규모 및 성장 예측
제6장 경쟁 구도
제7장 시장 기회 및 향후 전망
KTH 26.07.08According to Mordor Intelligence, the global micro mobility market size was valued at USD 4.53 billion in 2025 and estimated to grow from USD 5.26 billion in 2026 to reach USD 11.07 billion by 2031, at a CAGR of 16.05% during the forecast period (2026-2031).
This report is Segmented by Vehicle Type (Electric Kick Scooters, Electric Mopeds, Electric Bicycles, Electric Skateboards, and More), Battery Type (Sealed Lead Acid, Nimh, and Li-Ion), Voltage (Below 24V, 36V, 48V, and Above 48V), Sharing Model (Docked, Dockless, and Subscription-Based), and Geography (North America and More). The Market Forecasts are Provided in Terms of Value (USD) and Volume (Units).
Global Micro Mobility Market Trends and Insights
Rapid Urban Congestion & Post-Pandemic Modal Shift
Traffic density has climbed 15-20% in major cities since 2024, prompting commuters to seek nimble alternatives that bypass gridlock. The micro mobility market now fills service gaps left when riders reduced bus and rail use for health reasons. As hybrid work alters peak-hour patterns, flexible door-to-door modes such as e-bikes and kick scooters gain traction. Mixed-use districts display the highest uptake because a single vehicle can serve commuting, errands, and leisure needs. City planners have begun incorporating protected lanes and parking corrals into master plans, confirming that the current modal shift is a structural realignment rather than a passing response.
Falling Li-ion Battery Costs Lengthening Range & Duty-Cycles
Global battery pack prices keep sliding, letting manufacturers install larger 48 V units without raising retail prices. Chinese output exceeding 45 million electric two-wheelers a year creates unmatched economies of scale that ripple across the micro mobility market. Modern battery-management systems stretch operational life to 8 years, shrinking total cost of ownership and enabling shared-fleet operators to run profitable depreciation schedules. Swapping networks pioneered in Asia and now spreading to Europe, remove charging downtime, delivering quasi-continuous service to couriers and commuters alike.
Patchwork Safety Regulations & Vehicle Classification Gaps
Divergent speed caps and power limits force operators to deploy region-specific fleets, hindering scale in the micro mobility market. The European Commission studies a unified Personal Mobility Device category to streamline rules, while U.S. state laws still vary widely on motor wattage and helmet use. New York City introduced Local Law 39 after e-mobility fire costs reached USD 520 million between 2019-2023. The resulting insurance uncertainty raises premiums and deters risk-averse consumers.
Other drivers and restraints analyzed in the detailed report include:
- Municipal Subsidies & Pop-Up Infrastructure for Active Mobility
- Corporate Micromobility Programs for Employee ESG Targets
- Insufficient Charging / Parking Bays in Dense Downtowns
For complete list of drivers and restraints, kindly check the Table Of Contents.
Segment Analysis
Electric bicycles remained the anchor of the micro mobility market size, capturing 35.74% share in 2025. Growth now tilts toward cargo variants that log a 23.65% CAGR by satisfying last-mile parcel demand in Europe and emerging zero-emission zones. Retailers and logistics firms pivot to front-loading box designs capable of 160 kg payloads, cutting van mileage inside city centers.
Operators favor cargo units because average daily revenue per vehicle runs 45% higher than for standard bikes, offsetting their higher capital cost. Shared scooter fleets continue to serve leisure and first-mile needs, yet expansion cools as operators optimize existing networks for profitability. Mopeds fill the mobility gap in Asian markets where two-wheelers replace cars for everyday travel, underscoring regional diversity within the micro mobility market.
Battery-swap compatibility is emerging as a purchase criterion for commercial buyers who target near-continuous utilization. Yamaha's Enyring push into Germany and the Netherlands highlights Europe's growing logistics focus. In contrast, electric skateboards remain a niche pastime with limited regulatory acceptance for street use. Overall, the vehicle mix shows that one platform cannot satisfy every urban task; instead, specialized designs unlock value by matching payload, speed, and range requirements.
Li-ion held 82.65% of the micro mobility market size in 2025 and is on track for a 16.62% CAGR to 2031. The chemistry's high energy density and falling price enable longer trips without weight penalties, aligning with commuter expectations for 40-60 km real-world range. Advanced battery-management software featuring predictive analytics now extends pack life to 8 years, lowering per-ride depreciation for fleet operators. Manufacturing scale in China supports global supply, while European assemblers add value with robust thermal management to meet stricter safety codes.
Sealed lead-acid persists only in ultra-budget offerings where upfront price outweighs performance, yet its share continues to erode as second-hand Li-ion packs enter the resale market. NiMH remains marginal, restricted to specialized industrial carts or compliance-driven procurement.
Complete Report Scope:
- By Vehicle Type
- Electric Kick Scooters
- Electric Mopeds
- Electric Bicycles
- Electric Skateboards
- Electric Cargo Bikes
- By Battery Type
- Sealed Lead Acid
- NiMH
- Li-ion
- By Voltage
- Below 24V
- 36V
- 48V
- Above 48V
- By Sharing Model
- Docked
- Dockless
- Subscription-based
- By Geography
- North America
- United States
- Canada
- Mexico
- South America
- Brazil
- Argentina
- Rest of South America
- Europe
- Germany
- United Kingdom
- France
- Italy
- Spain
- Russia
- Rest of Europe
- Asia-Pacific
- China
- Japan
- India
- South Korea
- Australia
- New Zealand
- Rest of Asia-Pacific
- Middle East & Africa
- Middle East
- United Arab Emirates
- Turkey
- Israel
- Saudi Arabia
- Rest of Middle East
- Africa
- South Africa
- Nigeria
- Kenya
- Rest of Africa
- Middle East
- North America
Geography Analysis
Asia-Pacific accounted for 38.05% of the micro mobility market size in 2025, buoyed by China's installed base of 400 million electric two-wheelers and India's 1.14 million unit sales in FY2025. Average retail prices near USD 336 in China open ownership to mass segments, while India's fleet scales on favorable GST rates and domestic manufacturing incentives. The United Nations Environment Programme directs USD 130 million in grants to lower-income Asian and African nations, signaling future upside for exported vehicles and components.
Europe, the fastest-growing region at 18.1% CAGR, benefits from cohesive climate policy and advancing regulatory harmonization. Germany sold 2.05 million e-bikes in 2024, representing 53% of domestic bicycle volume even as average prices dipped. Operators amalgamate to chase scale economies, most notably the Tier-Dott union worth EUR 150 million. Profit focus intensifies, illustrated by Voi's EUR 17.2 million EBITDA in 2024 and debt refinancing via a EUR 50 million bond. As cities enforce low-emission zones, cargo bikes accelerate adoption by logistics firms seeking tariff-free access.
North America posts a 17.72% CAGR on the back of more than USD 50 million in local purchase subsidies and USD 44.55 million in federal active-transport grants. Lime shows commercial viability with two straight years of positive cash flow and an IPO roadmap, backed by an Uber partnership that funnels riders from an established app user base. Yet safety fears weigh on sentiment after New York City quantified USD 520 million in fire-related costs. Pending constructive rules and expanding curbside charging stand to unlock further market depth.
- Lime
- Bird Global Inc.
- Tier Mobility
- Dott
- Voi Technology
- Beam Mobility
- Yulu Bikes
- Helbiz
- Superpedestrian
- Spin
- Bolt Technologies
- Neuron Mobility
- Scooterson
- Segway-Ninebot
- NIU Technologies
- Rad Power Bikes
- Cowboy
- Zoomo
- RidePanda
Additional Benefits:
- The market estimate (ME) sheet in Excel format
- 3 months of analyst support
TABLE OF CONTENTS
1 Introduction
- 1.1 Study Assumptions & Market Definition
- 1.2 Scope of the Study
2 Research Methodology
3 Executive Summary
4 Market Landscape
- 4.1 Market Overview
- 4.2 Market Drivers
- 4.2.1 Rapid urban congestion & post-pandemic modal shift
- 4.2.2 Falling Li-ion battery costs lengthening range & duty-cycles
- 4.2.3 Municipal subsidies & pop-up infrastructure for active mobility
- 4.2.4 Corporate micromobility programs for employee ESG targets
- 4.2.5 Booming secondary market for used LEVs lowering entry price
- 4.2.6 AI-driven fleet analytics slashing operating downtime & cost
- 4.3 Market Restraints
- 4.3.1 Patchwork safety regulations & vehicle classification gaps
- 4.3.2 Insufficient charging / parking bays in dense downtowns
- 4.3.3 Rising insurance premiums following battery-fire incidents
- 4.3.4 Escalating city-level per-vehicle fees & trip taxes
- 4.4 Value / Supply-Chain Analysis
- 4.5 Regulatory Landscape
- 4.6 Technological Outlook
- 4.7 Porter's Five Forces
- 4.7.1 Threat of New Entrants
- 4.7.2 Bargaining Power of Buyers
- 4.7.3 Bargaining Power of Suppliers
- 4.7.4 Threat of Substitutes
- 4.7.5 Competitive Rivalry
5 Market Size & Growth Forecasts (Value (USD) and Volume (Units))
- 5.1 By Vehicle Type
- 5.1.1 Electric Kick Scooters
- 5.1.2 Electric Mopeds
- 5.1.3 Electric Bicycles
- 5.1.4 Electric Skateboards
- 5.1.5 Electric Cargo Bikes
- 5.2 By Battery Type
- 5.2.1 Sealed Lead Acid
- 5.2.2 NiMH
- 5.2.3 Li-ion
- 5.3 By Voltage
- 5.3.1 Below 24V
- 5.3.2 36V
- 5.3.3 48V
- 5.3.4 Above 48V
- 5.4 By Sharing Model
- 5.4.1 Docked
- 5.4.2 Dockless
- 5.4.3 Subscription-based
- 5.5 By Geography
- 5.5.1 North America
- 5.5.1.1 United States
- 5.5.1.2 Canada
- 5.5.1.3 Mexico
- 5.5.2 South America
- 5.5.2.1 Brazil
- 5.5.2.2 Argentina
- 5.5.2.3 Rest of South America
- 5.5.3 Europe
- 5.5.3.1 Germany
- 5.5.3.2 United Kingdom
- 5.5.3.3 France
- 5.5.3.4 Italy
- 5.5.3.5 Spain
- 5.5.3.6 Russia
- 5.5.3.7 Rest of Europe
- 5.5.4 Asia-Pacific
- 5.5.4.1 China
- 5.5.4.2 Japan
- 5.5.4.3 India
- 5.5.4.4 South Korea
- 5.5.4.5 Australia
- 5.5.4.6 New Zealand
- 5.5.4.7 Rest of Asia-Pacific
- 5.5.5 Middle East & Africa
- 5.5.5.1 Middle East
- 5.5.5.1.1 United Arab Emirates
- 5.5.5.1.2 Turkey
- 5.5.5.1.3 Israel
- 5.5.5.1.4 Saudi Arabia
- 5.5.5.1.5 Rest of Middle East
- 5.5.5.2 Africa
- 5.5.5.2.1 South Africa
- 5.5.5.2.2 Nigeria
- 5.5.5.2.3 Kenya
- 5.5.5.2.4 Rest of Africa
- 5.5.5.1 Middle East
- 5.5.1 North America
6 Competitive Landscape
- 6.1 Market Concentration
- 6.2 Strategic Moves
- 6.3 Market Share Analysis
- 6.4 Company Profiles (includes Global level Overview, Market level overview, Core Segments, Financials as available, Strategic Information, Market Rank/Share for key companies, Products & Services, and Recent Developments)
- 6.4.1 Lime
- 6.4.2 Bird Global Inc.
- 6.4.3 Tier Mobility
- 6.4.4 Dott
- 6.4.5 Voi Technology
- 6.4.6 Beam Mobility
- 6.4.7 Yulu Bikes
- 6.4.8 Helbiz
- 6.4.9 Superpedestrian
- 6.4.10 Spin
- 6.4.11 Bolt Technologies
- 6.4.12 Neuron Mobility
- 6.4.13 Scooterson
- 6.4.14 Segway-Ninebot
- 6.4.15 NIU Technologies
- 6.4.16 Rad Power Bikes
- 6.4.17 Cowboy
- 6.4.18 Zoomo
- 6.4.19 RidePanda
7 Market Opportunities & Future Outlook
- 7.1 White-space & Unmet-Need Assessment


