

|
시장보고서
상품코드
2073608
액체 비료 : 시장 점유율 분석, 업계 동향 및 통계, 성장 예측(2026-2031년)Liquid Fertilizers - Market Share Analysis, Industry Trends & Statistics, Growth Forecasts (2026 - 2031) |
||||||
 Mordor Intelligence
Mordor Intelligence에 의하면, 액체 비료 시장 규모는 2025년에 97억 4,000만 달러로 평가되었습니다. 2026년 102억 2,000만 달러에서 2031년까지 136억 9,000만 달러로 확대되어 예측 기간(2026-2031년) CAGR은 6.02%를 나타낼 전망입니다.
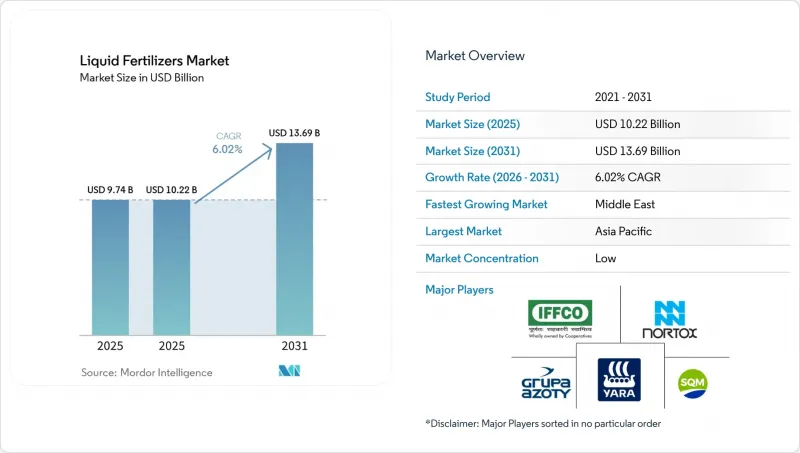
본 보고서는 유형별(복합비료 및 단일비료), 시용 방법별(시비 관개 및 엽면 시비), 작물별(밭작물, 원예작물 등), 그리고 지역별(아시아태평양, 유럽, 북미, 남미, 중동 및 아프리카)로 분류되어 있습니다. 시장 전망은 금액(달러) 및 수량(미터톤) 단위로 제시되어 있습니다.
세계의 액체 비료 시장 동향 및 인사이트
정밀 관개 도입 확대가 액체 비료 수요를 촉진
물 부족을 배경으로 점적 관개 및 마이크로 스프링클러 도입이 확대되고 있으며, 수용성 액체 비료와 결합한 시비 관개 시스템은 입상 비료 살포에 비해 영양소의 낭비를 최대 30%까지 줄여줍니다. 점적 관개나 마이크로 스프링클러 시스템의 광범위한 이용으로 인해 물과 영양분공급이 연동되므로, 농가에서는 입상 비료를 이용한 추비에서 시비 관개로 전환할 수 있게 됩니다. 이러한 접근 방식을 통해 유출 및 침출이 억제됩니다. 미국 농무부의 “2024년 비료 생산 확대 프로그램”이에 따라 생산 능력 강화를 위해 5억 달러가 배정되었으며, 이는 정밀 관개 이용자들에게 직접적인 혜택이 될 것입니다. 이는 액체 비료를 통해 영양분 이용 효율이 15-30% 향상된 사실이 공식적으로 인정된 것을 반영한 것입니다. 액체가 순식간에 용해되기 때문에 얇은 배관 내에서 입상 비료의 용해를 방해하는 에미터의 막힘을 해소합니다.
균형 잡힌 작물 영양 프로그램으로의 신속한 전환
'4R' 관리 프레임워크는 적절한 "공급원", "투여량", "시기", "시용 위치"를 중시하고 있으며, 다영양소 액체 비료는 한 번의 시비로 균형 잡힌 배합을 공급합니다. 현재 미국과 프랑스의 농업 지도원들은 작물의 생육 단계에 맞추어 질소·인·미량영양소를 분할 시비할 것을 권장하고 있으며, 이를 통해 흡수 효율이 향상되고 있습니다. 단일 영양소 프로그램에서는 수확량 곡선이 정체 상태에 이른 생산자들은 균형 잡힌 액체 비료를 수확량을 더욱 높이기 위한 다음 수단으로 보고 있습니다. 농업학자들은 또한 액체 비료가 요소 입상 비료를 반복적으로 사용하는 것에 비해 토양의 산성화를 억제하고, 농지의 장기적인 생산성을 유지한다고 지적하고 있습니다. 재조제된 혼합 제품은 하류 식품 브랜드가 요구하는 지속가능성 지표를 충족시키면서도 높은 이익률을 가져다주기 때문에 액체 비료 시장이 그 혜택을 누리고 있습니다.
온난한 기후에서의 높은 휘발성 및 침출 손실
용해성 질소는 30°C를 넘으면 급속히 암모니아 가스를 방출하며, 몬순 비로 인해 고정되지 않은 질산염이 몇 시간 이내에 뿌리 주변에서 아래로 씻겨 내려가게 됩니다. 베트남과 가나에서 실시된 실험 결과, 온대 지역에 비해 질소 이용 효율이 15%에서 25% 낮은 것으로 나타났습니다. 이에 대해 생산자들은 액체 비료의 사용을 온실이나 보호재배로 제한하는 방식으로 대응하고 있으며, 그 결과 판매량 증가세가 주춤하고 있습니다. 억제제 첨가제는 손실을 줄여주지만, 1미터톤당 50-80달러의 비용 증가를 초래하여, 코팅 입상제와 비용 차이가 좁혀지고 있습니다. 생물 유래 억제제가 저렴해지지 않는 한, 따뜻하고 습도가 높은 지역에서의 도입은 지연될 것입니다.
부문별 분석
2025년, 단일 성분 액체 비료는 액체 비료 시장 점유율의 58.7%를 차지하며 최대 제품 카테고리로서의 입지를 확고히 했습니다. 이러한 우위는 가변 비료 시비 프로그램의 광범위한 활용에 기인하며, 이를 통해 생산자는 개별 영양소를 시비함으로써 특정 영양소 결핍을 보다 정밀하게 해소할 수 있게 됩니다. 질소계 액체 비료는 특히 곡물 생산 시스템에서 단일 성분 제품에 대한 수요의 주요 구성 요소로 자리 잡고 있습니다. 또한, 농장 내 혼합 기능 덕분에 다양한 재배 환경에서 운영상의 유연성이 향상되었습니다.
복합비료 시장은 2026년부터 2031년까지 연평균 성장률(CAGR) 7.7%를 나타낼 것으로 예측되며, 가장 빠르게 성장하는 부문이 될 것으로 전망됩니다. 과수원, 원예 및 특산 작물 재배 시스템에서는 한 번의 시비로 균형 잡힌 영양 공급이 가능한 다영양소 복합 비료의 사용이 확대되고 있습니다. 킬레이트 비료 및 특수 영양소 혼합물의 지속적인 개발을 통해, 고부가가치 농업 분야에서의 도입이 촉진되고 있습니다. 또한, 배합 기술의 발전으로 인해 최신 비료·관개 시스템 및 정밀 영양 관리 시스템과의 호환성이 향상되고 있습니다.
지역별 분석
아시아태평양은 최대의 지역 시장으로, 2025년에는 액체 비료 시장의 39.9%를 차지했습니다. 이는 인도의 점적 관개에 대한 보조금 급증과 중국의 정밀 농업 추진에 힘입은 결과입니다. 일본과 한국에서는 엄격한 배수 규제를 준수하기 위해 온실 채소 생산에 순환식 양액을 사용하고 있습니다. 호주의 광활한 곡물 지대에서는 전도도 스캔을 통해 생성된 가변 시비율 액체 비료 지도를 활용한 실험이 진행되고 있으며, 이를 통해 밭 내 수확량 격차를 해소하는 것을 목표로 하고 있습니다. 방글라데시, 파키스탄, 베트남에서는 절대적인 보급률은 낮은 편이지만, 국가 차원의 보급 프로그램을 통해 마련된 시범 농장을 통해 벼농사 및 채소 재배 농가 간의 지식 격차가 점차 줄어들고 있습니다.
중동은 소규모 기반에서 출발해 2031년까지 연평균 성장률(CAGR) 8.1%를 기록하며 성장하고 있습니다. 나이지리아의 토마토 생산 클러스터와 케냐의 아보카도 농장에서는 설비 투자 장벽을 극복하기 위해 스테인리스제 저장 탱크를 공동으로 이용하는 지역 비료·관개 허브가 도입되었습니다. 남아프리카의 와인 및 감귤류 수출업체들은 유럽의 잔류 기준을 충족하기 위해 철 및 아연 킬레이트제에 의존하고 있으며, 이러한 성공 사례는 생산자 네트워크를 통해 빠르게 확산되고 있습니다.
북미와 유럽에서는 경작 면적을 확대하는 것보다, IoT로 최적화된 비료 시비 시스템을 도입해 기존 농지를 개량하는 데 주력하고 있습니다. 미국에서는 옥수수 및 대두 재배자들이 실시간 항공 사진을 활용하여 생육 중기 단계에서 액체 질소의 시비량을 조정함으로써, 주 정부의 영양염 규제치를 초과할 우려가 있는 과다 사용을 줄이고 있습니다. 유럽에서는 “질산염 지침”이로 인해 170 kg N/ha의 상한선을 준수하는 정밀 액체 비료에 대한 수요가 증가하고 있으며, 네덜란드와 덴마크 등 여러 국가에서 이 비료의 도입이 두드러지게 진행되고 있습니다. 동유럽 시장에서는 농장의 소규모화와 비료 및 관개 인프라 부족으로 인해 여러 과제에 직면해 있습니다. 그렇긴 하지만, 유럽연합(EU)의 탄소국경세는 효율 개선을 위한 자금 조달 기회를 제공할 가능성이 있습니다. 남미에서는 브라질의 사탕수수 비료 및 관개 실천과 아르헨티나의 특산 과일 수출에 힘입어 놀라운 성장률을 기록하고 있습니다.
기타 혜택 :
- 엑셀 형식 시장 예측(ME) 시트
- 3개월간의 애널리스트 지원
자주 묻는 질문
목차
제1장 서론
제2장 보고서의 내용
제3장 주요 요약 및 주요 조사 결과
제4장 주요 업계 동향
제5장 시장 규모 및 성장 예측
제6장 경쟁 구도
제7장 비료 업계 CEO를 향한 중요 전략적 과제
KTH 26.07.07According to Mordor Intelligence, the liquid fertilizers market size was valued at USD 9.74 billion in 2025 and is estimated to grow from USD 10.22 billion in 2026 to USD 13.69 billion by 2031, at a CAGR of 6.02% during the forecast period (2026-2031).
This report is Segmented by Type (Complex and Straight), by Application Mode (Fertigation and Foliar), by Crop Type (Field Crops, Horticultural Crops, and More), and by Geography (Asia-Pacific, Europe, North America, South America, Middle East, and Africa). The Market Forecasts are Provided in Terms of Value (USD) and Volume (Metric Tons).
Global Liquid Fertilizers Market Trends and Insights
Precision Irrigation Adoption Accelerates Liquid Uptake
Water scarcity is propelling drip and micro-sprinkler rollouts, and fertigation lines paired with soluble liquids reduce nutrient waste by up to 30% compared with granular broadcasting. The extensive use of drip and micro-sprinkler systems aligns water and nutrient delivery, allowing farmers to shift from granular top-dressing to in-line fertigation. This approach reduces runoff and leaching. The United States Department of Agriculture 2024 Fertilizer Production Expansion Program has allocated USD 500 million to enhance capacity, directly benefiting precision irrigation users. This reflects public acknowledgment of the 15-30% nutrient-use efficiency improvements achieved with liquid fertilizers . Liquids dissolve instantly, eliminating emitter clogging that undermines granular solubility in narrow lines.
Rapid Shift Toward Balanced Crop Nutrition Programs
The 4R stewardship framework emphasizes right source, rate, time, and placement, and multi-nutrient liquids deliver balanced blends in a single pass. Extension agents in the United States and France now recommend split nitrogen-phosphorus-micronutrient applications tied to crop growth stages, boosting uptake efficiency. Growers facing plateauing yield curves for single-nutrient programs view balanced liquids as the next lever for incremental gains. Agronomists also note that liquids lower soil acidification relative to repeated urea granule use, preserving long-term field productivity. The liquid fertilizers market benefits because reformulated blends earn premium margins while meeting sustainability metrics demanded by downstream food brands.
High Volatilization and Leaching Losses in Warm Climates
Soluble nitrogen faces rapid ammonia gas release above 30 °C, and monsoon rains wash unfixed nitrate below root zones within hours. Trials in Vietnam and Ghana showed nitrogen-use efficiency 15% to 25% lower than at temperate sites. Growers respond by limiting liquid use to greenhouses or protected horticulture, thereby capping volume growth. Inhibitor additives reduce losses but add USD 50-80 per metric ton, narrowing the cost gap with coated granules. Unless bio-based inhibitors become cheaper, adoption will lag in warm, humid regions.
Other drivers and restraints analyzed in the detailed report include:
- Government Subsidies Favoring Fertigation Solutions
- Drone-Based Micro-Spray Fertilization Platforms
- Stricter Container-Weight Rules Raising Freight Expense
For complete list of drivers and restraints, kindly check the Table Of Contents.
Segment Analysis
Straight fertilizers accounted for 58.7% of the liquid fertilizers market share in 2025, establishing them as the largest product category. Their dominance is attributed to their extensive use in variable-rate nutrient programs, which enable growers to address specific nutrient deficiencies with greater precision through individual nutrient applications. Nitrogenous liquid fertilizers remain a key component of straight-product demand, particularly in cereal production systems. Additionally, on-farm blending capabilities enhance their operational flexibility across various cropping environments.
Complex fertilizers are anticipated to be the fastest-growing segment, with a projected CAGR of 7.7% during 2026-2031. Multi-nutrient formulations are increasingly utilized in orchard, horticultural, and specialty crop systems, where a single application provides balanced nutrition. The ongoing development of chelated and specialty nutrient blends is driving their adoption in high-value agriculture. Furthermore, advancements in formulation technology are improving their compatibility with modern fertigation and precision nutrient management systems.
Complete Report Scope:
- Type
- Complex
- Straight
- By Nutrient
- Micronutrients
- Nitrogenous
- Phosphatic
- Potassic
- Secondary Macronutrients
- By Nutrient
- Application Mode
- Fertigation
- Foliar
- Crop Type
- Field Crops
- Horticultural Crops
- Turf and Ornamental
- Geography
- Asia-Pacific
- Australia
- Bangladesh
- China
- India
- Indonesia
- Japan
- Pakistan
- Philippines
- Thailand
- Vietnam
- Rest of Asia-Pacific
- Europe
- France
- Germany
- Italy
- Netherlands
- Russia
- Spain
- Ukraine
- United Kingdom
- Rest of Europe
- Middle East
- Saudi Arabia
- United Arab Emirates
- Turkey
- Rest of Middle East
- North America
- Canada
- Mexico
- United States
- Rest of North America
- South America
- Brazil
- Rest of South America
- Africa
- South Africa
- Nigeria
- Rest of Africa
- Asia-Pacific
Geography Analysis
Asia-Pacific was the largest regional market, accounting for 39.9% of the liquid fertilizers market in 2025., buoyed by India's surge in drip subsidies and China's precision farming push. Japan and South Korea use recirculating nutrient solutions in greenhouse vegetable production to comply with strict discharge rules. Australia's broadacre cereal belt experiments with variable-rate liquid maps generated from conductivity scans, aiming to close intra-field yield gaps. Bangladesh, Pakistan, and Vietnam trail on absolute penetration, but demonstration plots under state extension programs are narrowing knowledge gaps among rice and vegetable growers.
The Middle East region is growing at an 8.1% CAGR through 2031, from a small base. Nigeria's tomato clusters and Kenya's avocado orchards adopted community fertigation hubs that pool stainless storage to manage capex hurdles. South Africa's wine and citrus exporters rely on iron and zinc chelates to meet European residue standards, and success stories travel quickly through grower networks.
North America and Europe are focusing on upgrading existing agricultural acreage with IoT-optimized dosing systems rather than expanding cultivated areas. In the United States, corn and soybean growers use real-time aerial imagery to calibrate mid-season liquid nitrogen applications, reducing excess use that could exceed state nutrient regulations. In Europe, the Nitrates Directive drives demand for precision liquid fertilizers that comply with the 170 kg N/ha limit, with notable adoption in countries such as the Netherlands and Denmark. Eastern European markets face challenges due to fragmented farms and limited fertigation infrastructure. Nonetheless, European Union carbon border taxes may provide funding opportunities for efficiency improvements. South America is experiencing significant growth rate, driven by Brazil's sugarcane fertigation practices and Argentina's specialty fruit exports.
- Yara International ASA
- Sociedad Quimica y Minera de Chile S.A.
- Indian Farmers Fertiliser Cooperative Limited (IFFCO)
- Grupa Azoty S.A.
- Nortox SA
- ICL Group
- BMS Micro-Nutrients NV (Floridienne SA)
- Haifa Group
- Nutrien Ltd
- CF Industries Holdings, Inc.
- Kugler Company
- AgroLiquid
- Tessenderlo Kerley Inc (Tessenderlo Group)
- J. R. Simplot Company
- EuroChem Group
Additional Benefits:
- The market estimate (ME) sheet in Excel format
- 3 months of analyst support
TABLE OF CONTENTS
1 Introduction
- 1.1 Study Assumptions and Market Definition
- 1.2 Scope of the Study
- 1.3 Research Methodology
2 Report Offers
3 Executive Summary and Key Findings
4 Key Industry Trends
- 4.1 Acreage of Major Crop Types
- 4.1.1 Field Crops
- 4.1.2 Horticultural Crops
- 4.2 Average Nutrient Application Rates
- 4.2.1 Micronutrients
- 4.2.1.1 Field Crops
- 4.2.1.2 Horticultural Crops
- 4.2.2 Primary Nutrients
- 4.2.2.1 Field Crops
- 4.2.2.2 Horticultural Crops
- 4.2.3 Secondary Macronutrients
- 4.2.3.1 Field Crops
- 4.2.3.2 Horticultural Crops
- 4.2.1 Micronutrients
- 4.3 Agricultural Land Equipped for Irrigation
- 4.4 Regulatory Framework
- 4.5 Value Chain and Distribution Channel Analysis
- 4.6 Market Drivers
- 4.6.1 Precision irrigation adoption accelerates liquid uptake
- 4.6.2 Rapid shift toward balanced crop nutrition programs
- 4.6.3 Government subsidies favoring fertigation solutions
- 4.6.4 Drone-based micro-spray fertilization platforms
- 4.6.5 On-farm IoT blending systems enabling just-in-time mixes
- 4.6.6 Nitrate-from-ammonia electrolysis lowering production cost
- 4.7 Market Restraints
- 4.7.1 High volatilization and leaching losses in warm climates
- 4.7.2 Corrosive storage and handling infrastructure costs
- 4.7.3 Per- and polyfluoroalkyl substances (PFAS) contamination scrutiny on certain chelating agents
- 4.7.4 Stricter container-weight rules are raising freight expenses
5 Market Size and Growth Forecasts (Value and Volume)
- 5.1 Type
- 5.1.1 Complex
- 5.1.2 Straight
- 5.1.2.1 By Nutrient
- 5.1.2.1.1 Micronutrients
- 5.1.2.1.2 Nitrogenous
- 5.1.2.1.3 Phosphatic
- 5.1.2.1.4 Potassic
- 5.1.2.1.5 Secondary Macronutrients
- 5.1.2.1 By Nutrient
- 5.2 Application Mode
- 5.2.1 Fertigation
- 5.2.2 Foliar
- 5.3 Crop Type
- 5.3.1 Field Crops
- 5.3.2 Horticultural Crops
- 5.3.3 Turf and Ornamental
- 5.4 Geography
- 5.4.1 Asia-Pacific
- 5.4.1.1 Australia
- 5.4.1.2 Bangladesh
- 5.4.1.3 China
- 5.4.1.4 India
- 5.4.1.5 Indonesia
- 5.4.1.6 Japan
- 5.4.1.7 Pakistan
- 5.4.1.8 Philippines
- 5.4.1.9 Thailand
- 5.4.1.10 Vietnam
- 5.4.1.11 Rest of Asia-Pacific
- 5.4.2 Europe
- 5.4.2.1 France
- 5.4.2.2 Germany
- 5.4.2.3 Italy
- 5.4.2.4 Netherlands
- 5.4.2.5 Russia
- 5.4.2.6 Spain
- 5.4.2.7 Ukraine
- 5.4.2.8 United Kingdom
- 5.4.2.9 Rest of Europe
- 5.4.3 Middle East
- 5.4.3.1 Saudi Arabia
- 5.4.3.2 United Arab Emirates
- 5.4.3.3 Turkey
- 5.4.3.4 Rest of Middle East
- 5.4.4 North America
- 5.4.4.1 Canada
- 5.4.4.2 Mexico
- 5.4.4.3 United States
- 5.4.4.4 Rest of North America
- 5.4.5 South America
- 5.4.5.1 Brazil
- 5.4.5.2 Rest of South America
- 5.4.6 Africa
- 5.4.6.1 South Africa
- 5.4.6.2 Nigeria
- 5.4.6.3 Rest of Africa
- 5.4.1 Asia-Pacific
6 Competitive Landscape
- 6.1 Key Strategic Moves
- 6.2 Market Share Analysis
- 6.3 Company Landscape
- 6.4 Company Profiles (Includes Global Level Overview, Market Level Overview, Core Segments, Financials as Available, Strategic Information, Market Rank/Share for Key Companies, Products and Services, and Recent Developments)
- 6.4.1 Yara International ASA
- 6.4.2 Sociedad Quimica y Minera de Chile S.A.
- 6.4.3 Indian Farmers Fertiliser Cooperative Limited (IFFCO)
- 6.4.4 Grupa Azoty S.A.
- 6.4.5 Nortox SA
- 6.4.6 ICL Group
- 6.4.7 BMS Micro-Nutrients NV (Floridienne SA)
- 6.4.8 Haifa Group
- 6.4.9 Nutrien Ltd
- 6.4.10 CF Industries Holdings, Inc.
- 6.4.11 Kugler Company
- 6.4.12 AgroLiquid
- 6.4.13 Tessenderlo Kerley Inc (Tessenderlo Group)
- 6.4.14 J. R. Simplot Company
- 6.4.15 EuroChem Group


