
|
시장보고서
상품코드
2097319
동기 발전기 : 시장 점유율 분석, 업계 동향 및 통계, 성장 예측(2026-2031년)Synchronous Generator - Market Share Analysis, Industry Trends & Statistics, Growth Forecasts (2026 - 2031) |
||||||
 Mordor Intelligence
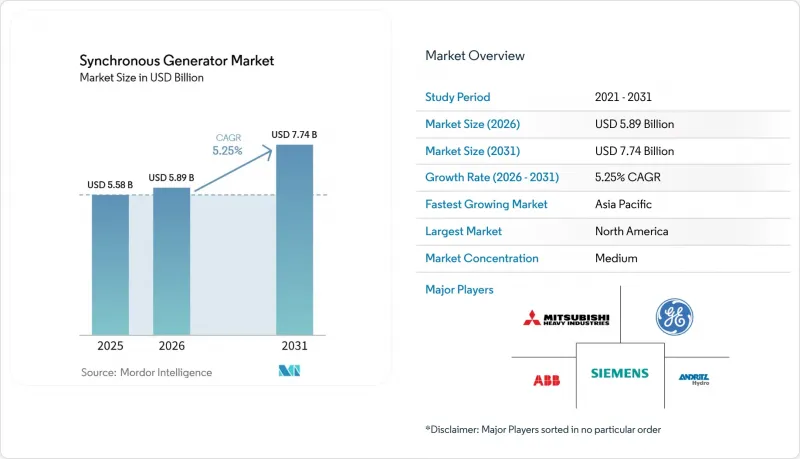
Mordor Intelligence에 의하면, 동기 발전기 시장 규모는 2025년 55억 8,000만 달러로 평가되었습니다. 2026년에는 58억 9,000만 달러로 확대되어 2031년까지 77억 4,000만 달러에 이를 것으로 예상되고 2026년부터 2031년에 걸쳐 CAGR 5.25%로 성장할 전망입니다.
본 보고서는 유형별(원통형 로터, 돌출극 등), 냉각 방식별(공기, 수소, 물, 오일), 상수별(단상, 3상), 정격 출력별(100 KVA 미만 등), 용도별(발전소 등), 최종 사용자별(유틸리티 등), 지역별(북미, 유럽, 아시아태평양, 남미, 중동 및 아프리카)로 분류되어 있습니다. 시장 예측은 금액(달러)으로 제시되어 있습니다.
세계의 동기 발전기 시장 동향과 인사이트
재생에너지 비중이 높은 전력 구성에서 계통 안정화용 발전기에 대한 수요 증가
송전 사업자들은 순간 부하의 40%를 초과하는 풍력 및 태양광 발전 도입률이 밀리초 단위로 NERC PRC-024-4의 라이드스루 한계치를 초과하는 주파수 편차를 유발할 가능성이 있기 때문에 동기 진상기 도입에 주력하고 있습니다. Siemens Energy는 2024년 아일랜드의 머니포인트(Moneypoint) 사이트에서 250 MVAr 규모의 설비를 가동하여, 현재 재생에너지 비중이 70% 이상의 발전 계획에 대해 3,500 MW의 관성력 및 무효 전력 지원을 제공합니다. GE Vernova는 사이클론으로 인한 고립 운전이 안정성 위험을 높이는 호주의 타운즈빌에서도 유사한 설비를 도입했습니다. ENTSO-E의 2024년 로드맵에 따르면, 유럽의 모든 송전계통운영자(TSO)는 2027년까지 최소 관성 값 기준을 충족해야 하며, 이로 인해 동기기에 대한 향후 몇 년간의 수주 전망이 사실상 보장되고 있습니다. 물리적 관성이라는 특성은 현재의 그리드 포밍 인버터로는 경제적으로 재현할 수 없으며, 이것이 장기적인 가치의 기반이 되고 있습니다.
전 세계 하이퍼스케일 데이터센터의 급속한 확장
각 하이퍼스케일러 기업들은 계통 연계의 병목 현상을 피하고, 홀당 50-100 MW를 소비하는 AI 워크로드를 위한 현지 베이스로드 전력을 확보하기 위해 부지 내에 가스터빈 발전 설비를 도입하고 있습니다. 루이지애나주에 위치한 Meta의 Hyperion 캠퍼스에서는 2026년부터 2030년에 걸쳐 동기 발전기를 갖춘 7.5GW의 복합 사이클 발전 설비를 도입할 예정입니다. 마이크로소프트는 2024년, 펜실베이니아주의 클라우드 지역 전용으로 835 MW 규모의 쓰리마일아일랜드 제1 원자로를 재가동하기 위해 160억 달러 규모의 전력 구매 계약을 체결했습니다. 아마존과 구글도 유사한 원자력 및 SMR(소형 모듈형 원자로) 관련 협약을 체결했으며, 이는 1-5 MVA 규모의 모듈을 선호하는 ‘계량기 뒤편 발전’으로의 광범위한 전환을 반영하고 있습니다. 블룸버그의 추산에 따르면, 2027년까지 하이퍼스케일러 기업의 설비 투자액은 6,400억 달러에 달할 것으로 보이며, 이 중 2,400억 달러는 발전기나 변압기 등의 물리적 인프라에 투입될 전망입니다.
인버터식 유도 발전기의 비용 경쟁력
그리드 포밍 인버터는 관성력이 중요하지 않은 용도에서 초기 비용을 20-30% 절감하고 유지보수도 간소화합니다. NREL의 2024년 연구에 따르면, 이러한 인버터가 전압원의 동작을 모방할 수 있음이 확인되었으나, 운동 에너지가 부족하여 큰 진폭의 주파수 변동을 억제하는 능력에는 한계가 있습니다. 남호주에서 진행된 100% 재생에너지 실증 실험에서는 합성 관성을 이용하여 2시간 동안의 안정성을 달성했으나, 배터리의 과잉 사양이 필요하여 설비 투자 비용 절감 효과의 일부가 상쇄되었습니다. 동남아시아나 아프리카와 같은 비용 중심 시장에서는 고정형 VAR 보상 장치와 결합된 유도 발전기 패키지가 선호되고 있습니다. 이는 동기 발전기의 성능 약 85%를 비용의 60-70%로 실현합니다.
부문 분석
영구자석 동기 발전기는 연평균 성장률(CAGR) 9.5%로 확대되고 있으며, 이는 동기 발전기 시장 전체 평균의 거의 2배에 해당합니다. 이 제품의 컴팩트한 설치 면적은 해상 풍력 발전 및 해군 관련 고객을 유치하고 있으며, 브러쉬리스 자화 방식을 통해 슬립 링 유지보수가 필요하지 않습니다. 원통형 로터 기종은 2025년에도 동기 발전기 시장 점유율의 42.1%를 유지했습니다. 이는 3,000-3,600 RPM의 증기·가스 터빈 구동이 베이스로드 발전 설비 증설에서 계속해서 주류를 이루고 있으며, 또한 그 철심 로터가 희토류 공급 부족의 영향을 받지 않기 때문입니다. 돌출극형 발전기는 수력 발전소에서 여전히 필수적인 존재입니다. 저속·다극 설계를 통해 과도한 원심 응력을 발생시키지 않으면서 대구경을 실현하고 있습니다.
희토류 공급 리스크가 PMSG의 보급을 제한하고 있습니다. 중국의 수출 규제로 인해 2025년에는 NdFeB 자석 가격이 18-22% 상승하여, 해상 풍력 발전의 설비 투자 전망이 상향 조정되었습니다. 고엔트로피 붕소화물 및 망간계 자석에 대한 조사에 따르면, 2028년 이후에는 희토류를 포함하지 않는 로터의 실현이 가능해져 공급 제약은 완화될 전망이지만, 단기적으로는 동기 발전기 시장 규모에는 영향을 미치지 않을 것으로 보입니다. 한편, 브러쉬리스 권선 로터식 발전기는 정자석 자화를 통해 운전 및 유지보수 주기를 5,000시간에서 1만 시간으로 연장함으로써, 선박 및 산업 분야에서 실용화가 진행되고 있습니다.
수소 냉각 방식은 2025년 동기 발전기 시장의 39.6%를 차지했으며, 2031년까지 연평균 성장률(CAGR) 5.8%를 나타낼 것으로 예측됩니다. 뛰어난 열전도율로 높은 전력 밀도가 실현되고 있으며, 300 MVA의 공랭식 유닛을 수소 냉각 방식으로 개조할 경우, 용량률 80%에서 평균 3년 만에 투자 회수가 가능합니다. 200 MVA를 초과하는 발전소에서는 주로 수소 냉각이 채택되고 있지만, 100kVA 미만의 예비용 발전기에서는 효율보다 간편성이 우선시되기 때문에 공랭식이 여전히 주류를 이루고 있습니다.
초고출력 원자력 발전 유닛의 물·수소 하이브리드 시스템은 고정자의 핫스팟을 12-15°C 낮추고, 절연재의 수명을 최대 40% 연장합니다. 유지보수의 복잡성은 여전히 장벽으로 남아 있습니다. 운영사는 폭발성 혼합기 발생을 방지하기 위해 수소 순도를 98%로 유지하고 분기마다 씰을 점검해야 합니다. 공랭식 발전기는 0.8-1.2%의 효율 저하를 동반하고 프레임 크기도 20-30% 커지지만, 보조 시스템 비용이 저렴하기 때문에 분산형 발전이나 이동식 용도에서는 여전히 매력적인 선택지로 남아 있습니다.
지역별 분석
2025년 매출액 중 북미가 31.9%를 차지했습니다. FERC 지침 842 및 NERC PRC-024-4의 개정과 더불어, 폐쇄된 석탄 화력 발전소의 동기 진상기 개조가 설비 갱신 수요를 뒷받침하고 있습니다. 버지니아주, 텍사스주 및 태평양 연안 북서부 지역의 하이퍼스케일러 기업들은 수 기가와트 규모의 현장 발전 용량을 확보하고 있으며, 한편 캐나다의 원자력 발전소 출력 증강 및 멕시코의 복합 사이클 발전 입찰도 수요 증가에 기여하고 있습니다.
아시아태평양은 연평균 성장률(CAGR) 6.1%로 가장 빠르게 성장하고 있는 지역입니다. 인도, 베트남, 인도네시아에서는 관성력 및 전압 조정을 위해 동기기를 필요로 하는 수 기가와트 규모의 석탄 화력, 가스 화력, 수력 발전 프로젝트가 발주되고 있습니다. 일본의 원자로 재가동, 중국의 초초임계압 화력 발전소 건설, 그리고 아세안(ASEAN) 국가들의 가스 화력 전환이 시장 기반을 더욱 확대시키고 있습니다.
유럽에서는 석탄 화력 발전소의 폐지와 관성력 확보 의무 간의 균형이 맞추어지고 있습니다. 독일이 42 GW의 동기 발전 용량을 폐지하는 한편, ENTSO-E가 정한 2027년 최소 요건에 따라 응축기 설치가 촉진되고 있습니다. 핀란드의 원자력 발전소 출력 향상과 스칸디나비아 전역의 수력 발전소 현대화로 인해 개보수 활동이 지속되고 있으며, 러시아 볼주스카야 발전소의 대규모 개보수를 통해 2.7 GW의 개보수 완료된 발전 단위가 추가될 예정입니다.
기타 혜택 :
- 엑셀 형식 시장 예측(ME) 시트
- 3개월간의 애널리스트 지원
자주 묻는 질문
목차
제1장 서론
제2장 조사 방법
제3장 주요 요약
제4장 시장 구도
제5장 시장 규모 및 성장 예측
제6장 경쟁 구도
제7장 시장 기회 및 향후 전망
KTH 26.08.10According to Mordor Intelligence, the synchronous generator market size is expected to increase from USD 5.58 billion in 2025 to USD 5.89 billion in 2026 and reach USD 7.74 billion by 2031, growing at a CAGR of 5.25% over 2026-2031.
This report is Segmented by Type (Cylindrical Rotor, Salient Pole, and More), Cooling Type (Air, Hydrogen, Water, Oil), Phase (Single, Three), Power Rating (Below 100 KVA, and More), Application (Power Plants, and More), End-User (Utilities, and More), and Geography (North America, Europe, Asia-Pacific, South America, Middle East and Africa). Market Forecasts are Provided in Value (USD).
Global Synchronous Generator Market Trends and Insights
Rising Demand for Grid-Stabilizing Generators in Renewable-Heavy Power Mixes
Transmission operators are turning to synchronous condensers because wind and solar penetration above 40% of the instantaneous load can trigger frequency deviations that violate NERC PRC-024-4 ride-through limits within milliseconds. Siemens Energy commissioned a 250 MVAr unit at Ireland's Moneypoint site in 2024, providing 3,500 MW of inertia and reactive support for a dispatch that now tops 70% renewables. GE Vernova delivered a similar installation in Townsville, Australia, where cyclone-islanded operation raises stability risk. ENTSO-E's 2024 roadmap obliges every European TSO to meet minimum inertia floors by 2027, effectively guaranteeing a multiyear order pipeline for synchronous machines. The physical-inertia attribute cannot be replicated economically by grid-forming inverters today, anchoring long-term value.
Rapid Expansion of Hyperscale Data Centers Worldwide
Hyperscalers are procuring on-site gas turbine generation to bypass interconnection bottlenecks and secure local baseload power for AI workloads that draw 50-100 MW per hall. Meta's Hyperion campus in Louisiana will deploy 7.5 GW of combined-cycle capacity with synchronous generators between 2026 and 2030. Microsoft signed a USD 16 billion power purchase agreement in 2024 to restart the 835 MW Three Mile Island Unit 1 reactor exclusively for its Pennsylvania cloud region. Amazon and Google have executed similar nuclear and SMR arrangements, reflecting a broader shift toward behind-the-meter generation that favors 1-5 MVA modules. Bloomberg estimates hyperscaler capital expenditure at USD 640 billion through 2027, of which USD 240 billion targets physical infrastructure such as generators and transformers.
Cost Competitiveness of Inverter-Based Induction Generators
Grid-forming inverters deliver 20-30% lower upfront cost and simpler maintenance for applications where inertia is noncritical. NREL's 2024 study confirmed they can emulate voltage-source behavior, but inadequate kinetic energy limits their ability to arrest large-signal frequency excursions. South Australia's 100% renewable demonstration achieved two-hour stability using synthetic inertia, yet required over-specification of batteries, offsetting some capex benefit. Cost-sensitive markets in Southeast Asia and Africa favor induction-generator packages paired with static VAR compensators, which deliver roughly 85% of synchronous-machine performance at 60-70% of the cost.
Other drivers and restraints analyzed in the detailed report include:
- Industrial Output Growth in Emerging Economies
- Modernization of Aging Thermal & Hydro Plants in OECD
- High CAPEX and Maintenance Intensity
For complete list of drivers and restraints, kindly check the Table Of Contents.
Segment Analysis
Permanent-magnet synchronous generators are expanding at a 9.5% CAGR, nearly twice the synchronous generator market average. Their compact footprint attracts offshore wind and naval customers, while brushless excitation eliminates slip-ring maintenance. Cylindrical-rotor machines retained 42.1% of the synchronous generator market share in 2025, as 3,000-3,600 RPM steam- and gas-turbine drives continue to dominate baseload build-outs and their iron-core rotors are not affected by rare-earth supply shortages. Salient-pole units remain essential in hydro plants, where low-speed, high-pole designs provide large diameters without excessive centrifugal stress.
Rare-earth supply risk is limiting PMSG penetration. China's export controls pushed NdFeB magnet prices 18-22% higher in 2025, raising offshore wind capital expenditure forecasts. Research into high-entropy borides and manganese-based magnets could enable rare-earth-free rotors after 2028, easing supply constraints but not affecting the synchronous generator market size in the near term. Meanwhile, brushless wound-rotor machines are finding a practical application in marine and industrial settings by extending operation and maintenance intervals from 5,000 to 10,000 hours through static excitation.
Hydrogen-cooled designs held 39.6% of the synchronous generator market in 2025 and are expected to grow at a CAGR of 5.8% through 2031. Superior thermal conductivity enables high power density; the payback period for retrofitting a 300 MVA air-cooled unit to hydrogen averages 3 years at an 80% capacity factor. Plants above 200 MVA predominantly select hydrogen cooling, while air-cooled machines continue to dominate below-100 kVA standby sets where simplicity takes priority over efficiency.
Hybrid water-hydrogen systems in ultra-high-power nuclear units reduce stator hot-spots by 12-15 °C, prolonging insulation life by up to 40%. Maintenance complexity remains a barrier: operators must maintain 98% hydrogen purity and monitor seals quarterly to avoid explosive mixtures. Air-cooled machines carry a 0.8-1.2% efficiency penalty and require 20-30% larger frames; however, their lower auxiliary-system cost keeps them attractive in distributed-generation and mobile applications.
Complete Report Scope:
- By Type
- Cylindrical Rotor Synchronous Generators
- Salient Pole Synchronous Generators
- Brushless Synchronous Generators
- Permanent-Magnet Synchronous Generators (PMSG)
- By Cooling Type
- Air-Cooled
- Hydrogen-Cooled
- Water-Cooled
- Oil-Cooled
- By Phase
- Single-Phase
- Three-Phase
- By Power Rating
- Below 100 kVA
- 100 to 500 kVA
- 500 to 1000 kVA
- 1 to 5 MVA
- Above 5 MVA
- By Application
- Power Plants
- Industrial
- Oil and Gas
- Marine
- Mining
- Data Centres
- Others (Aerospace, Military, Commercial Buildings)
- By End-user
- Utilities
- Commercial and Industrial
- Residential
- By Geography
- North America
- United States
- Canada
- Mexico
- Europe
- Germany
- United Kingdom
- France
- Italy
- NORDIC Countries
- Russia
- Rest of Europe
- Asia-Pacific
- China
- India
- Japan
- South Korea
- ASEAN Countries
- Rest of Asia-Pacific
- South America
- Brazil
- Argentina
- Rest of South America
- Middle East and Africa
- Saudi Arabia
- United Arab Emirates
- South Africa
- Egypt
- Rest of Middle East and Africa
- North America
Geography Analysis
North America accounted for 31.9% of 2025 revenue. FERC Order 842 and NERC PRC-024-4 upgrades, along with synchronous condenser retrofits at retired coal plants, support replacement demand. Hyperscalers in Virginia, Texas, and the Pacific Northwest are securing multi-gigawatt on-site capacity, while nuclear uprates in Canada and combined-cycle tenders in Mexico contribute additional volume.
Asia-Pacific is the fastest-growing region, with a CAGR of 6.1%. India, Vietnam, and Indonesia are ordering multi-gigawatt coal, gas, and hydro projects that require synchronous machines for inertia and voltage regulation. Japan's reactor restarts, China's ultra-supercritical builds, and gas conversions across ASEAN further broaden the market base.
Europe is balancing coal plant exits with inertia mandates. ENTSO-E's 2027 floor requirement is driving condenser installations even as Germany retires 42 GW of synchronous capacity. Nuclear uprates in Finland and hydro modernizations across Scandinavia sustain retrofit activity, while Russia's Volzhskaya overhaul adds 2.7 GW of refurbished units.
- ABB Ltd.
- ANDRITZ AG
- Bharat Heavy Electricals Limited (BHEL)
- Brush Group Limited
- Caterpillar Inc.
- Cummins Inc.
- Doosan Enerbility Co., Ltd.
- Franklin Electric Co., Inc.
- Fuji Electric Co., Ltd.
- General Electric Company
- Harbin Electric Machinery Company Limited
- Hyundai Electric & Energy Systems Co., Ltd.
- Meidensha Corporation
- Mitsubishi Heavy Industries, Ltd.
- Nidec Leroy-Somer Holding
- SDMO Industries SAS
- Siemens AG
- TMEIC Corporation (Toshiba Mitsubishi-Electric Industrial Systems Corporation)
- Toshiba Energy Systems & Solutions Corporation
- Turbo-Dienst GmbH (TDG)
- WEG S.A.
Additional Benefits:
- The market estimate (ME) sheet in Excel format
- 3 months of analyst support
TABLE OF CONTENTS
1 Introduction
- 1.1 Study Assumptions & Market Definition
- 1.2 Scope of the Study
2 Research Methodology
3 Executive Summary
4 Market Landscape
- 4.1 Market Overview
- 4.2 Market Drivers
- 4.2.1 Rising demand for grid-stabilising generators in renewable-heavy power mixes
- 4.2.2 Rapid expansion of hyperscale data centres worldwide
- 4.2.3 Industrial output growth in emerging economies
- 4.2.4 Modernisation of ageing thermal & hydro plants in OECD
- 4.2.5 Grid operators adopting synchronous condensers for inertia (under-reported)
- 4.2.6 Naval platforms shifting to integrated electric propulsion (under-reported)
- 4.3 Market Restraints
- 4.3.1 Cost competitiveness of inverter-based induction generators
- 4.3.2 High CAPEX and maintenance intensity
- 4.3.3 Supply-chain tightness for rare-earth magnets (under-reported)
- 4.3.4 Tighter NOx/CO norms accelerating shift to non-rotating solutions (under-reported)
- 4.4 Supply-Chain Analysis
- 4.5 Regulatory Landscape
- 4.6 Technological Outlook
- 4.7 Porter's Five Forces
- 4.7.1 Threat of New Entrants
- 4.7.2 Bargaining Power of Buyers
- 4.7.3 Bargaining Power of Suppliers
- 4.7.4 Threat of Substitutes
- 4.7.5 Competitive Rivalry
5 Market Size & Growth Forecasts
- 5.1 By Type
- 5.1.1 Cylindrical Rotor Synchronous Generators
- 5.1.2 Salient Pole Synchronous Generators
- 5.1.3 Brushless Synchronous Generators
- 5.1.4 Permanent-Magnet Synchronous Generators (PMSG)
- 5.2 By Cooling Type
- 5.2.1 Air-Cooled
- 5.2.2 Hydrogen-Cooled
- 5.2.3 Water-Cooled
- 5.2.4 Oil-Cooled
- 5.3 By Phase
- 5.3.1 Single-Phase
- 5.3.2 Three-Phase
- 5.4 By Power Rating
- 5.4.1 Below 100 kVA
- 5.4.2 100 to 500 kVA
- 5.4.3 500 to 1000 kVA
- 5.4.4 1 to 5 MVA
- 5.4.5 Above 5 MVA
- 5.5 By Application
- 5.5.1 Power Plants
- 5.5.2 Industrial
- 5.5.3 Oil and Gas
- 5.5.4 Marine
- 5.5.5 Mining
- 5.5.6 Data Centres
- 5.5.7 Others (Aerospace, Military, Commercial Buildings)
- 5.6 By End-user
- 5.6.1 Utilities
- 5.6.2 Commercial and Industrial
- 5.6.3 Residential
- 5.7 By Geography
- 5.7.1 North America
- 5.7.1.1 United States
- 5.7.1.2 Canada
- 5.7.1.3 Mexico
- 5.7.2 Europe
- 5.7.2.1 Germany
- 5.7.2.2 United Kingdom
- 5.7.2.3 France
- 5.7.2.4 Italy
- 5.7.2.5 NORDIC Countries
- 5.7.2.6 Russia
- 5.7.2.7 Rest of Europe
- 5.7.3 Asia-Pacific
- 5.7.3.1 China
- 5.7.3.2 India
- 5.7.3.3 Japan
- 5.7.3.4 South Korea
- 5.7.3.5 ASEAN Countries
- 5.7.3.6 Rest of Asia-Pacific
- 5.7.4 South America
- 5.7.4.1 Brazil
- 5.7.4.2 Argentina
- 5.7.4.3 Rest of South America
- 5.7.5 Middle East and Africa
- 5.7.5.1 Saudi Arabia
- 5.7.5.2 United Arab Emirates
- 5.7.5.3 South Africa
- 5.7.5.4 Egypt
- 5.7.5.5 Rest of Middle East and Africa
- 5.7.1 North America
6 Competitive Landscape
- 6.1 Market Concentration
- 6.2 Strategic Moves (M&A, Partnerships, PPAs)
- 6.3 Market Share Analysis (Market Rank/Share for key companies)
- 6.4 Company Profiles (includes Global level Overview, Market level overview, Core Segments, Financials as available, Strategic Information, Products & Services, and Recent Developments)
- 6.4.1 ABB Ltd.
- 6.4.2 ANDRITZ AG
- 6.4.3 Bharat Heavy Electricals Limited (BHEL)
- 6.4.4 Brush Group Limited
- 6.4.5 Caterpillar Inc.
- 6.4.6 Cummins Inc.
- 6.4.7 Doosan Enerbility Co., Ltd.
- 6.4.8 Franklin Electric Co., Inc.
- 6.4.9 Fuji Electric Co., Ltd.
- 6.4.10 General Electric Company
- 6.4.11 Harbin Electric Machinery Company Limited
- 6.4.12 Hyundai Electric & Energy Systems Co., Ltd.
- 6.4.13 Meidensha Corporation
- 6.4.14 Mitsubishi Heavy Industries, Ltd.
- 6.4.15 Nidec Leroy-Somer Holding
- 6.4.16 SDMO Industries SAS
- 6.4.17 Siemens AG
- 6.4.18 TMEIC Corporation (Toshiba Mitsubishi-Electric Industrial Systems Corporation)
- 6.4.19 Toshiba Energy Systems & Solutions Corporation
- 6.4.20 Turbo-Dienst GmbH (TDG)
- 6.4.21 WEG S.A.
7 Market Opportunities & Future Outlook
- 7.1 White-space & Unmet-Need Assessment