

|
시장보고서
상품코드
2100042
예지보전 시장 : 시장 점유율 분석, 업계 동향 및 통계, 성장 예측(2026-2031년)Predictive Maintenance - Market Share Analysis, Industry Trends & Statistics, Growth Forecasts (2026 - 2031) |
||||||
 Mordor Intelligence
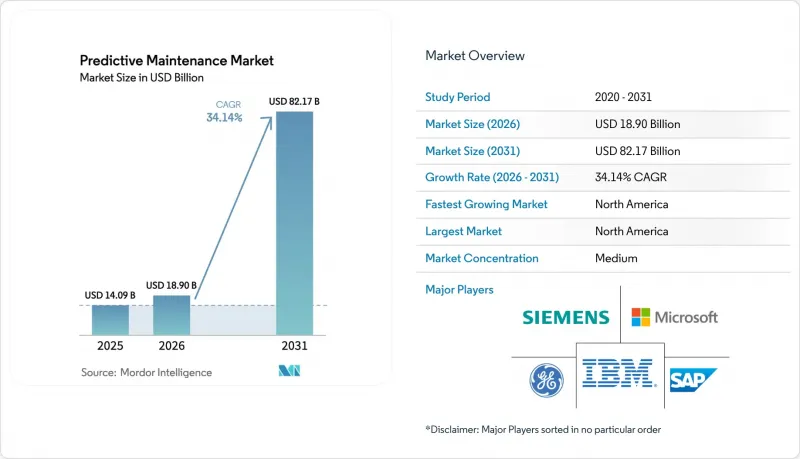
Mordor Intelligence에 의하면, 예지보전 시장 규모는 2025년에 140억 9,000만 달러로 평가되었고, 2026년 189억 달러에서 2031년까지 821억 7,000만 달러에 이를 것으로 예측되며, 예측 기간(2026-2031년) CAGR은 34.14%를 나타낼 전망입니다.
본 보고서는 구성 요소별(하드웨어, 소프트웨어, 서비스), 기업 규모별(중소기업, 대기업), 도입 형태별(온프레미스, 클라우드), 최종 사용자 산업별(공업 제조, 자동차 및 운송, 에너지·유틸리티, 기타), 지역별로 분류되어 있습니다. 시장 예측은 금액(달러) 기준으로 제시되어 있습니다.
세계의 예지보전 시장 동향 및 인사이트
IoT를 활용한 자산 연결의 급속한 확대
산업용 IoT 센서의 보급은 진동이나 온도 프로브에 그치지 않고, 단일 보드 상에서 음향, 열, 전력 시그니처 모니터링까지 확대되고 있습니다. 엣지 게이트웨이는 초당 수천 개의 데이터 포인트를 로컬에서 처리하여 클라우드로의 트래픽을 억제하는 동시에 경보의 즉각성을 보장합니다. 무선 메시 네트워크는 유선 배선에 비해 설치 비용을 최대 60% 절감하며, 외딴 지역의 광산, 해양 시추 시설, 이동식 장비를 예지보전의 대상 범위에 포함시키고 있습니다. MQTT 및 OPC-UA와 같은 표준화된 프로토콜을 통해 상호 운용성이 향상되어, 다중 벤더 플랜트에서의 통합 복잡성이 완화되고 있습니다. 2024년 이후 하드웨어 가격 급등으로 조달 주기가 둔화되고 있지만, 그 결과 엣지 효율성에 대한 관심이 높아지면서 많은 플랜트에서 복잡한 서버를 소형 추론 유닛으로 대체하는 움직임이 진행되고 있습니다.
AI/ML 정확도의 비약적 발전
앙상블 머신러닝 파이프라인과 도메인 적응형 딥러닝 모델을 통해 베어링, 펌프, 모터의 고장을 30-60일 전에 예측하는 정확도가 현재 85-95%에 달하고 있습니다. 합성 데이터와 전이 학습 기술을 통해 과거 고장 사례가 부족한 경우에도 팀은 수년이 아닌 수주 만에 모델을 학습시킬 수 있습니다. 엣지 추론 칩은 상시 연결이 필요 없어도 실시간 인사이트를 제공하며, 대역폭이 제한된 지역에서도 운영을 유지합니다. 유지보수 제품군에 통합된 생성형 AI 코파일럿은 자연어 쿼리를 통해 기술자에게 상황에 맞는 수리 절차, 부품 목록, 안전 점검 사항을 안내합니다. 정확도 향상은 사용자의 신뢰를 직접적으로 높여, 소규모 생산 거점으로의 도입 확대를 촉진합니다.
데이터 보안 및 개인정보 보호 과제
센서 네트워크의 확장에 따라 공격 표면이 넓어지면서 운영 기술(OT)이 사이버 위협에 노출되고 있습니다. 레거시 프로토콜에는 기본 암호화 기능이 부족하기 때문에 GDPR(EU 개인정보보호규정)이나 NERC CIP 등의 규제를 충족하기 위해 보안 터널링이나 인증 계층을 사후에 도입할 수밖에 없습니다. 실시간 데이터 흐름과 엄격한 보안 조치의 균형을 맞추는 것은 여전히 과제이며, 특히 환자 안전과 전력망의 안정성이 최우선시되는 의료 및 중요 에너지 시설에서 두드러집니다. 따라서 기업들은 디바이스 수준의 암호화, 제로 트러스트 아키텍처, 감사 대응이 가능한 데이터 처리 관행을 갖춘 플랫폼을 우선적으로 선택하고 있습니다.
부문 분석
2025년, 하드웨어는 예지보전 시장에서 45.18%의 점유율을 차지했습니다. 고성능 센서와 엣지 게이트웨이는 소프트웨어 분석이 의존하는 데이터의 백본을 형성하고 있습니다. 신규 도입으로 인해 매년 대상 시장이 확대되고 있으므로, 이 부문은 여전히 매우 중요한 위치를 차지하고 있습니다. 소프트웨어 매출은 가장 빠르게 성장하고 있으며, AI 라이브러리의 성숙과 클라우드 구독의 보급에 따라 2031년까지 연평균 성장률(CAGR) 35.82%로 확대되고 있습니다. 서비스 부문은 규모는 작지만, 복잡한 산업 시설 전반에 걸쳐 도입, 보정, 모델 튜닝에 관한 중요한 전문 지식을 제공합니다.
무선 센서의 지속적인 소형화와 비용 절감으로 인해 단일 장치에서 여러 매개변수를 모니터링할 수 있게 되어 총 도입 비용이 절감되고 있습니다. 엣지 유닛은 현재 머신러닝 추론을 로컬에서 실행하고 있어, 대역폭 사용량을 줄이는 동시에 안전상 중요한 자산에 대해 결정론적 지연 시간을 보장하고 있습니다. 소프트웨어 제공업체들은 모듈식 설계에 주력하고 있으며, 이를 통해 공장은 펌프, 구동 장치 또는 HVAC 시스템에 특화된 분석 패키지에 대한 라이선스를 취득할 수 있게 되었습니다. 생성형 AI 프론트엔드를 통해 기술자가 평이한 언어로 유지보수 시스템과 대화할 수 있게 되어, 교육에 드는 오버헤드가 더욱 줄어듭니다. 서비스 기업들은 원격 모니터링, 정기적인 모델 업데이트, 사이버 보안 대책을 포함한 턴키 패키지를 제공함으로써 인력 부족 문제를 해결하고 있습니다.
2025년에는 대규모 기업이 광범위한 자산 포트폴리오와 넉넉한 IT 예산을 바탕으로 예지보전 시장 매출의 63.65%를 차지했습니다. 그러나 도입 장벽이 낮아짐에 따라 중소기업이 가장 역동적인 성장층이 되어, 2031년까지 연평균 성장률(CAGR) 36.2%로 성장할 전망입니다. 사용량 기반 과금제를 통해 소규모 공장에서도 자산 1개당월50-100달러로 시범 운영을 시작할 수 있으며, 12-18개월 이내에 투자 수익률(ROI)을 흑자로 전환할 수 있습니다.
대기업은 프라이빗 클라우드나 사내 데이터 사이언스 팀을 활용하여 자사 고유의 설비에 맞춘 알고리즘을 맞춤화하고 있습니다. 또한 예측 대시보드를 기존 MES나 ERP 환경에 통합함으로써 워크플로우 조정을 효율화하고 있습니다. 반면, 중소기업은 벤더가 관리하는 클라우드 도구에 의존하고 있으며, 이곳에서는 업데이트, 보안 패치 적용, 모델 재학습이 자동으로 수행됩니다. 매니지드 서비스 파트너는 센서, 게이트웨이, 분석 기능을 단일 구독에 묶음으로써 도입을 더욱 용이하게 하고 있습니다. 엣지 AI는 지방 공장의 대역폭 제약을 완화하고, 대용량 연결에 대한 의존도를 낮춥니다.
지역별 분석
북미는 디지털 팩토리에 대한 조기 투자, 풍부한 벤처 자금, 지원적인 규제 환경 덕분에 2025년 매출 점유율의 28.85%를 차지했습니다. 산업용 IoT 플랫폼의 광범위한 도입과 높은 인건비가 맞물려 예측 솔루션에 대한 지속적인 지출을 뒷받침하고 있습니다. 자동화 대기업과 하이퍼스케일 클라우드 제공업체 간의 전략적 제휴를 통해 제품 혁신과 시장 침투가 가속화되고 있습니다. 학제 간 인재의 심각한 부족과 사이버 위험에 대한 인식 제고가 중소기업에게는 과제로 대두되고 있습니다.
아시아태평양은 가장 빠르게 성장하는 지역으로, 2031년까지 연평균 성장률(CAGR) 35.25%를 기록하며 성장을 이어가고 있습니다. 각국의 ‘인더스트리 4.0’ 프로그램, 대규모 제조 생산량, 높아지는 기술 전문성이 수요를 뒷받침하고 있습니다. 지방 자치 단체는 노동력의 고령화를 보완하고 수출 경쟁력을 유지하기 위해 센서 도입 및 디지털 기술 교육에 대한 지원을 실시했습니다. 지역 기업들은 낮은 하드웨어 비용과 지역 내 전자 부품 공급망의 혜택을 누리고 있지만, 레거시 시스템과의 연동 및 데이터 거버넌스에 대한 우려를 해소하기 위해 맞춤형 솔루션이 요구되고 있습니다.
유럽에서는 성숙한 산업 자동화와 엄격한 데이터 보호법이 맞물려 도입이 꾸준히 확대되고 있습니다. 독일의 자동차 및 기계 산업에서는 예측 루틴을 통합한 첨단 디지털 트윈 프로젝트가 시범적으로 도입되고 있는 반면, 영국에서는 상태 모니터링 프레임워크를 활용하여 노후화된 에너지 그리드의 현대화가 진행되고 있습니다. Siemens, ABB, Schneider Electric을 핵심으로 하는 벤더 생태계는 CE 마크 획득 환경에 맞추어 인증된 통합 솔루션을 제공합니다. 중동 및 아프리카 시장은 여전히 발전 단계에 있지만, 자산의 신뢰성이 최우선시되고 원격 지역의 물류 비용이 높은 석유, 가스, 재생 에너지 부문에서 미래성이 기대되고 있습니다.
기타 혜택
- 엑셀 형식 시장 예측(ME) 시트
- 3개월간의 애널리스트 지원
자주 묻는 질문
목차
제1장 서론
제2장 조사 방법
제3장 주요 요약
제4장 시장 구도
제5장 시장 규모 및 성장 예측(금액, 2024-2030년)
제6장 경쟁 구도
제7장 시장 기회 및 향후 전망
AJY 26.08.11According to Mordor Intelligence, the predictive maintenance market size was valued at USD 14.09 billion in 2025 and estimated to grow from USD 18.9 billion in 2026 to reach USD 82.17 billion by 2031, at a CAGR of 34.14% during the forecast period (2026-2031).
This report is Segmented by Component (Hardware, Software, Services), Enterprise Size (Small and Medium Enterprises, Large Enterprises), Deployment Mode (On-Premise, Cloud), End-User Industry (Industrial Manufacturing, Automotive & Transportation, Energy and Utilities, and More), and Geography. The Market Forecasts are Provided in Terms of Value (USD)
Global Predictive Maintenance Market Trends and Insights
IoT-Enabled Asset Connectivity Boom
Mass adoption of industrial IoT sensors now extends beyond vibration and temperature probes to include acoustic, thermal, and power-signature monitoring on a single board. Edge gateways process thousands of data points per second locally, ensuring immediacy of alerts while limiting traffic back to the cloud.Wireless mesh networks cut installation costs up to 60% relative to wired layouts, bringing remote mines, offshore rigs, and mobile equipment into predictive regimes. Standardized protocols such as MQTT and OPC-UA raise interoperability, reducing integration complexity for multi-vendor plants. Hardware inflation since 2024 has slowed procurement cycles, yet the resulting focus on edge efficiency means many plants are replacing complex servers with compact inference units.
AI/ML Accuracy Breakthroughs
Ensemble machine-learning pipelines and domain-adapted deep-learning models now achieve 85-95% precision in predicting bearing, pump, and motor failures 30-60 days in advance. Synthetic data and transfer-learning techniques let teams train models in weeks rather than years, even when historical failure events are scarce. Edge inference chips deliver real-time insights without persistent connectivity, maintaining operations in bandwidth-limited areas. Generative AI copilots embedded in maintenance suites provide technicians with contextual repair steps, parts lists, and safety checks using natural-language queries. Higher accuracy directly improves user trust, driving wider rollout across smaller production sites.
Data-Security and Privacy Gaps
Expanded sensor networks enlarge attack surfaces, exposing operational technology to cyberthreats. Legacy protocols lack native encryption, forcing retrofit of secure tunneling and authentication layers to meet regulations such as GDPR and NERC CIP. Balancing real-time data flows with strict security policies remains a challenge, especially in healthcare and critical-energy sites where both patient safety and grid stability are paramount. Enterprises therefore prioritize platforms featuring device-level encryption, zero-trust architectures, and audit-ready data-handling practices.
Other drivers and restraints analyzed in the detailed report include:
- Downtime-Reduction Cost Pressures
- Cloud-Native Deployment Scalability
- Skilled-Talent Shortage
For complete list of drivers and restraints, kindly check the Table Of Contents.
Segment Analysis
Hardware captured a 45.18% share of the predictive maintenance market in 2025. High-performance sensors and edge gateways create the data backbone that software analytics depend on. The segment remains pivotal because new installations expand the addressable base each year. Software revenues are climbing quickest, advancing at a 35.82% CAGR to 2031 as AI libraries mature and cloud subscriptions proliferate. Services, though smaller, deliver critical deployment, calibration, and model-tuning expertise across complex industrial estates.
Continued miniaturization and cost reductions in wireless sensors allow multi-parameter monitoring from a single device, reducing total installed cost. Edge units now execute machine-learning inference locally, trimming bandwidth usage and ensuring deterministic latency for safety-critical assets. Software providers focus on modular designs, allowing plants to license analytics packs specific to pumps, drives, or HVAC systems. Generative-AI front ends further lower training overhead by letting technicians converse with maintenance systems in plain language. Services firms combat talent shortages by offering turnkey packages that include remote monitoring, periodic model refreshes, and cybersecurity safeguards.
Large corporations controlled 63.65% of predictive maintenance market revenue in 2025 owing to expansive asset portfolios and deep IT budgets. However, SMEs represent the most dynamic constituency, advancing at a 36.2% CAGR to 2031 as barriers to adoption fall. Pay-as-you-go pricing lets smaller plants launch pilots for USD 50-100 per asset per month, achieving positive ROI within 12-18 months.
Enterprise incumbents leverage private clouds and internal data-science teams to tailor algorithms for proprietary equipment. They also integrate predictive dashboards into existing MES and ERP environments, streamlining workflow orchestration. SMEs, conversely, rely on vendor-managed cloud tools where updates, security patches, and model retraining occur automatically. Managed-service partners further ease uptake by bundling sensors, gateways, and analytics in a single subscription. Edge AI mitigates bandwidth constraints in rural factories, reducing dependence on high-capacity connections.
Complete Report Scope:
- By Component
- Hardware
- Software
- Services
- By Enterprise Size
- Small and Medium Enterprises
- Large Enterprises
- By Deploymet Mode
- On-Premise
- Cloud
- By End-user Industry
- Industrial Manufacturing
- Automotive and Transportation
- Energy and Utilities
- Healthcare
- Telecommunications
- Aerospace and Defense
- Others (Oil and Gas, Mining, etc.)
- By Geography
- North America
- United States
- Canada
- Mexico
- South America
- Brazil
- Argentina
- Rest of South America
- Europe
- Germany
- United Kingdom
- France
- Netherlands
- Rest of Europe
- Asia-Pacific
- China
- Japan
- India
- South Korea
- Australia and New Zealand
- Rest of Asia-Pacific
- Middle East and Africa
- Middle East
- United Arab Emirates
- Saudi Arabia
- Turkey
- Rest of Middle East
- Africa
- South Africa
- Nigeria
- Rest of Africa
- Middle East
- North America
Geography Analysis
North America held 28.85% revenue share in 2025 thanks to early digital-factory investment, abundant venture funding, and a supportive regulatory climate. Widespread adoption of industrial IoT platforms, coupled with high labor costs, drives continued spending on predictive solutions. Strategic collaborations between automation giants and hyperscale-cloud providers accelerate product innovation and market penetration. Nonetheless, acute shortages of cross-disciplinary talent and heightened cyber-risk awareness challenge smaller enterprises.
Asia-Pacific is the fastest-expanding region, advancing at a 35.25% CAGR through 2031. National Industry 4.0 programs, sizeable manufacturing output, and growing technical expertise underpin demand. Local governments subsidize sensor retrofits and digital-skills training to offset aging workforces and sustain export competitiveness. Regional firms benefit from lower hardware costs and in-region electronics supply chains, although legacy-system connectivity and data-governance concerns require targeted solutions.
Europe combines mature industrial automation with stringent data-protection laws, yielding steady adoption growth. German automotive and machinery sectors pilot advanced digital-twin projects that embed predictive routines, while the United Kingdom modernizes aging energy grids with condition-monitoring frameworks. Vendor ecosystems anchored by Siemens, ABB, and Schneider Electric provide integrated offerings certified for CE-marked environments. Middle East and Africa markets remain nascent but show promise in oil, gas, and renewables where asset reliability is paramount and remote-site logistics are costly.
- IBM Corporation
- Microsoft Corporation
- SAP SE
- Siemens AG
- General Electric Company
- Robert Bosch GmbH
- ABB Ltd.
- Schneider Electric SE
- Honeywell International Inc.
- Rockwell Automation, Inc.
- Emerson Electric Co.
- PTC Inc.
- Hitachi Ltd.
- Oracle Corporation
- C3.ai, Inc.
- Uptake Technologies, Inc.
- SAS Institute Inc.
- SKF AB
- Dell Technologies
- Senseye (Siemens)
- Aspen Technology, Inc.
- Fiix Software (Rockwell)
- OSIsoft (AVEVA)
Additional Benefits:
- The market estimate (ME) sheet in Excel format
- 3 months of analyst support
TABLE OF CONTENTS
1 INTRODUCTION
- 1.1 Study Assumptions and Market Definition
- 1.2 Scope of the Study
2 RESEARCH METHODOLOGY
3 EXECUTIVE SUMMARY
4 MARKET LANDSCAPE
- 4.1 Market Overview
- 4.2 Market Drivers
- 4.2.1 IoT-enabled asset connectivity boom
- 4.2.2 AI/ML accuracy breakthroughs
- 4.2.3 Downtime-reduction cost pressures
- 4.2.4 Cloud-native deployment scalability
- 4.2.5 Digital-twin-driven prescriptive workflows
- 4.2.6 ESG-linked maintenance KPIs
- 4.3 Market Restraints
- 4.3.1 Data-security and privacy gaps
- 4.3.2 Skilled-talent shortage
- 4.3.3 Legacy-protocol interoperability issues
- 4.3.4 AI model drift and liability risk
- 4.4 Supply-Chain Analysis
- 4.5 Regulatory Landscape
- 4.6 Technological Outlook
- 4.7 Porter's Five Forces
- 4.7.1 Threat of New Entrants
- 4.7.2 Bargaining Power of Buyers
- 4.7.3 Bargaining Power of Suppliers
- 4.7.4 Threat of Substitutes
- 4.7.5 Intensity of Rivalry
- 4.8 Assesment of Macroeconomic Factors on the Market
5 MARKET SIZE AND GROWTH FORECASTS (VALUE, 2024-2030)
- 5.1 By Component
- 5.1.1 Hardware
- 5.1.2 Software
- 5.1.3 Services
- 5.2 By Enterprise Size
- 5.2.1 Small and Medium Enterprises
- 5.2.2 Large Enterprises
- 5.3 By Deploymet Mode
- 5.3.1 On-Premise
- 5.3.2 Cloud
- 5.4 By End-user Industry
- 5.4.1 Industrial Manufacturing
- 5.4.2 Automotive and Transportation
- 5.4.3 Energy and Utilities
- 5.4.4 Healthcare
- 5.4.5 Telecommunications
- 5.4.6 Aerospace and Defense
- 5.4.7 Others (Oil and Gas, Mining, etc.)
- 5.5 By Geography
- 5.5.1 North America
- 5.5.1.1 United States
- 5.5.1.2 Canada
- 5.5.1.3 Mexico
- 5.5.2 South America
- 5.5.2.1 Brazil
- 5.5.2.2 Argentina
- 5.5.2.3 Rest of South America
- 5.5.3 Europe
- 5.5.3.1 Germany
- 5.5.3.2 United Kingdom
- 5.5.3.3 France
- 5.5.3.4 Netherlands
- 5.5.3.5 Rest of Europe
- 5.5.4 Asia-Pacific
- 5.5.4.1 China
- 5.5.4.2 Japan
- 5.5.4.3 India
- 5.5.4.4 South Korea
- 5.5.4.5 Australia and New Zealand
- 5.5.4.6 Rest of Asia-Pacific
- 5.5.5 Middle East and Africa
- 5.5.5.1 Middle East
- 5.5.5.1.1 United Arab Emirates
- 5.5.5.1.2 Saudi Arabia
- 5.5.5.1.3 Turkey
- 5.5.5.1.4 Rest of Middle East
- 5.5.5.2 Africa
- 5.5.5.2.1 South Africa
- 5.5.5.2.2 Nigeria
- 5.5.5.2.3 Rest of Africa
- 5.5.5.1 Middle East
- 5.5.1 North America
6 COMPETITIVE LANDSCAPE
- 6.1 Market Concentration
- 6.2 Strategic Moves
- 6.3 Market Share Analysis
- 6.4 Company Profiles (includes Global level Overview, Market level overview, Core Segments, Financials as available, Strategic Information, Market Rank/Share, Products and Services, Recent Developments)
- 6.4.1 IBM Corporation
- 6.4.2 Microsoft Corporation
- 6.4.3 SAP SE
- 6.4.4 Siemens AG
- 6.4.5 General Electric Company
- 6.4.6 Robert Bosch GmbH
- 6.4.7 ABB Ltd.
- 6.4.8 Schneider Electric SE
- 6.4.9 Honeywell International Inc.
- 6.4.10 Rockwell Automation, Inc.
- 6.4.11 Emerson Electric Co.
- 6.4.12 PTC Inc.
- 6.4.13 Hitachi Ltd.
- 6.4.14 Oracle Corporation
- 6.4.15 C3.ai, Inc.
- 6.4.16 Uptake Technologies, Inc.
- 6.4.17 SAS Institute Inc.
- 6.4.18 SKF AB
- 6.4.19 Dell Technologies
- 6.4.20 Senseye (Siemens)
- 6.4.21 Aspen Technology, Inc.
- 6.4.22 Fiix Software (Rockwell)
- 6.4.23 OSIsoft (AVEVA)
7 MARKET OPPORTUNITIES AND FUTURE OUTLOOK
- 7.1 White-space and Unmet-Need Assessment


