

|
시장보고서
상품코드
2113375
북미의 디지털 사이니지 : 시장 점유율 분석, 업계 동향과 통계, 성장 예측(2026-2031년)North America Digital Signage - Market Share Analysis, Industry Trends & Statistics, Growth Forecasts (2026 - 2031) |
||||||
 Mordor Intelligence
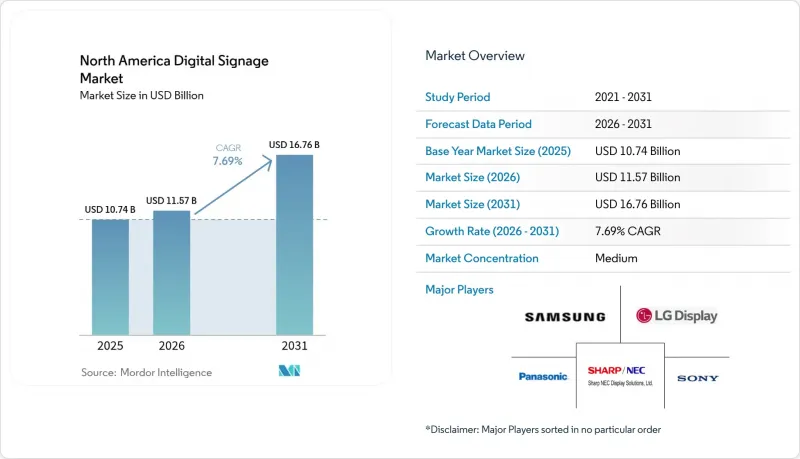
Mordor Intelligence에 따르면 북미의 디지털 사이니지 시장 규모는 2025년에 107억 4,000만 달러로 평가되며, 2026년 115억 7,000만 달러에서 2031년까지 167억 6,000만 달러에 달할 것으로 예측되며, 예측 기간(2026-2031년) 동안 CAGR은 7.69%가 될 전망입니다.
본 보고서는 구성요소(하드웨어, 소프트웨어, 서비스), 설치 장소(실내, 실외), 디스플레이 크기(32인치 미만, 32-52인치, 52인치 이상), 설치 장소(매장 내, 매장 외), 최종사용자 업종(소매, 운송 등), 하드웨어(LCD/LED 디스플레이 등), 및 국가별로 분류되어 있습니다. 시장 예측은 금액(달러) 기준으로 제시되어 있습니다.
북미 디지털 사이니지 시장의 동향 및 인사이트
턴키 솔루션의 진화가 미국 소매 체인에서의 도입을 가속화하고 있습니다
스크린, 미디어 플레이어, 소프트웨어, 콘텐츠 템플릿 및 원격 모니터링을 결합한 번들형 서비스 덕분에 2023년 이후 전국적 규모의 전개에 소요되는 시간이 37% 단축되었습니다. 소매 그룹은 현재 수백 개 매장에 걸쳐 경험을 표준화하는 동시에, 지역의 재고 상황과 조건에 맞춰 프로모션을 최적화하고 있습니다. 초기 투자 대신 구독형 요금 체계를 통해 향후 2년 이내에 도입을 계획 중인 기업의 60%에서 디지털 사이니지 채택이 촉진되고 있습니다. 이 모델을 채택한 체인점에서는 고객 참여도가 22% 향상되고 평균 구매액이 18% 증가하여, 디지털 사이니지가 비용 센터에서 수익원으로 전환되었음을 입증하고 있습니다.
모바일 데이터를 활용한 컨텍스트 기반 광고가 캐나다 광고주의 ROI를 향상
익명화된 휴대폰 신호를 통해 콘텐츠 스케줄러에 실시간 잠재 고객 추정치가 반영되게 되었습니다. 캐나다에서 진행된 시범 프로젝트에서는 기존의 옥외 광고 구매와 비교해 ROI가 41% 향상되었을 뿐만 아니라, 소매 환경에서 고객 참여도가 27% 향상되고 전환율이 19% 상승했습니다. 지오펜싱을 활용함으로써 브랜드는 광고를 본 행인의 스마트폰을 대상으로 리타게팅이 가능해지며, 개인 식별자를 저장하지 않고도 오프라인 매장에서의 노출과 디지털 후속 조치를 연결할 수 있습니다.
위치 기반 타겟팅 및 얼굴 분석과 관련된 개인정보 보호 우려
미국 각 주의 법안과 캐나다의 ‘디지털 헌장’에 따라 동의에 관한 규제가 강화되면서, 공급업체들은 얼굴 인식에서 익명화된 인구통계 데이터의 집계로 전환할 수밖에 없게 되었습니다. 조사에 따르면, 캐나다 젊은이의 68%가 상업적 목적의 얼굴 분석에 반대하고 있어, 소매업체들은 평판 위험과 개인 맞춤화의 이점을 저울질해야 하는 상황에 처해 있습니다.
부문 분석
2025년, 북미 디지털 사이니지 시장 점유율의 56.35%를 하드웨어가 차지했으며, 그 중심은 자본 집약적인 스크린과 미디어 플레이어였습니다. 이러한 선두에도 불구하고, 클라우드 대시보드, AI 스케줄링 엔진, 시청자 분석으로 인해 구매자의 관심이 ‘일회성 도입’에서 ‘평생 가치’로 이동함에 따라 소프트웨어 부문은 연평균 성장률(CAGR) 8.73%로 확대되고 있습니다. 구독 번들은 현재 플랫폼 수익의 43%를 차지하며, 공급업체의 인센티브를 지속적인 콘텐츠 최적화와 연계하고 있습니다. 하드웨어 제조업체들은 라이선스나 관리형 서비스를 사전 설치하는 경우가 늘어나고 있으며, 이를 통해 원활한 조달 프로세스가 실현되어 소매업체들은 여러 공급업체를 관리해야 하는 번거로움에서 해방되고 있습니다.
계획, 배선, 보정, 현장 유지보수, 크리에이티브 디자인을 아우르는 서비스 분야는 최종사용자가 광대한 시설 전체에서 캠페인을 업데이트할 내부 자원이 부족하기 때문에 꾸준히 확대되고 있습니다. 네트워크를 종단 간(end-to-end)으로 관리하는 통합 업체들은 다년 계약을 수주하고, 장애 발생률을 서비스 수준 기준치 이하로 억제하면서 예측 가능한 연간 수익을 확보하고 있습니다. 최신 미디어 플레이어에 내장된 엣지 AI 기능은 대역폭 비용을 절감하고, 한산한 시간대의 음성 음소거나 고장 난 LED 표시를 통한 예방적 수리 등 현지에서 의사결정을 내릴 수 있게 해줍니다.
2025년, 북미 디지털 사이니지 시장 규모의 67.65%를 실내 시설이 차지하고 있으며, 이는 공조 관리된 환경과 기존 전력 및 데이터 인프라에 의해 뒷받침되고 있습니다. 기업 본사, 대학, 쇼핑몰 통로에서는 방문객 안내, 판촉을 통한 상향 판매, 직원 알림 등을 위해 실내 스크린이 활용되고 있습니다. 콘텐츠에 대한 피로감을 해소하기 위해 운영자는 터치 조작, 제스처, QR코드를 통한 상호 작용을 통합하여 대면 및 모바일 경험을 단일 참여 퍼널로 통합하고 있습니다.
매출의 32.35%를 차지하는 실외 네트워크는 연평균 성장률(CAGR) 9.08%로 시장 전체 성장률을 웃도는 속도로 확대되고 있으며, 내구성이 뛰어난 케이스, 자동 조광 기능, 그리고 자가 세척 기능이 탑재된 유리 처리 기술의 혜택을 받고 있습니다. 스마트 시티 시범 사업에서는 공공 Wi-Fi, 환경 센서, 긴급 경보 기능이 추가되어 지자체의 예산 배정을 정당화하고 있습니다. 한편, 태양광발전식 토템은 전력 공급이 제한된 지역에 동적인 정보를 제공하고 있습니다. 원격 진단 소프트웨어의 발전으로 출장 수리 비용이 대폭 절감되었으며, 가동 시간에 대한 SLA가 연장되었습니다.
기타 혜택:
- 엑셀 형식의 시장 예측(ME) 시트
- 3개월간의 애널리스트 지원
자주 묻는 질문
목차
제1장 소개
제2장 조사 방법
제3장 주요 요약
제4장 시장 구도
제5장 시장 규모와 성장 예측
제6장 경쟁 구도
제7장 시장 기회와 향후 전망
KSM 26.08.25According to Mordor Intelligence, the North America digital signage market size was valued at USD 10.74 billion in 2025 and estimated to grow from USD 11.57 billion in 2026 to reach USD 16.76 billion by 2031, at a CAGR of 7.69% during the forecast period (2026-2031).
This report is Segmented by Component (Hardware, Software, and Services), Location (Indoor, and Outdoor), Display Size (Below 32 Inches, 32 - 52 Inches, and Above 52 Inches), Installation Location (In-Store, and Out-Of-Store), End-User Vertical (Retail, Transportation, and More), Hardware (LCD/LED Display, and More), and Country. The Market Forecasts are Provided in Terms of Value in (USD).
North America Digital Signage Market Trends and Insights
Evolution of Turnkey Solutions Accelerating Deployment Across U.S. Retail Chains
Bundled offerings that combine screens, media players, software, content templates, and remote monitoring have reduced national rollouts by 37% since 2023. Retail groups now standardize experiences across hundreds of stores while tailoring promotions to local inventory levels and conditions. Subscription pricing, rather than capital outlay, encourages the adoption of digital signage among 60% of enterprises that intend to subscribe within two years. Chains adopting this model report 22% higher engagement and an 18% increase in average basket value, confirming the pivot from a cost center to a revenue driver.
Context-Aware Advertising Leveraging Mobile Data Enhances ROI for Canadian Advertisers
Anonymized cellphone signals now feed real-time audience estimates into content schedulers. Canadian pilots show ROI gains of 41% over traditional out-of-home buying, plus 27% higher engagement and 19% conversion lifts in retail settings. Geofencing lets brands retarget exposed passers-by on their phones, knitting together physical impressions and digital follow-ups without storing personal identifiers.
Privacy Concerns Regarding Location-Based Targeting and Facial Analytics
State-level U.S. bills and Canada's Digital Charter are tightening consent rules, forcing vendors to shift from face recognition to anonymous demographic counts. Surveys indicate 68% of Canadian youth oppose facial analysis in commerce, prompting retailers to weigh reputational risk against personalization benefits.
Other drivers and restraints analyzed in the detailed report include:
- Integration of 4K/8K Video Walls Powers Experiential Venues in Major U.S. Airports
- Smart-City Initiatives Driving Outdoor Digital Signage Roll-outs in Mexican Urban Centers
- Rising Energy-Efficiency Regulations for Large-Format Displays
For complete list of drivers and restraints, kindly check the Table Of Contents.
Segment Analysis
Hardware captured 56.35% of the North America digital signage market share in 2025, anchored by capital-intensive screens and media players. Despite this lead, the software slice is advancing at an 8.73% CAGR as cloud dashboards, AI scheduling engines, and audience analytics shift buyer focus from one-time installs to lifetime value. Subscription bundles now comprise 43% of platform revenue, aligning vendor incentives with continuous content optimisation. Hardware makers are increasingly pre-loading licenses and managed services, creating a seamless procurement process and freeing retailers from the need to juggle multiple suppliers.
The services tier-covering planning, cabling, calibration, on-site maintenance, and creative design-expands steadily because end-users lack in-house bandwidth to refresh campaigns across sprawling estates. Integrators that manage networks end-to-end win multi-year contracts, locking in predictable annuities while keeping failure rates below service-level thresholds. Edge-AI features embedded in modern media players reduce bandwidth costs and enable localised decisions-such as muting audio during quiet hours or flagging malfunctioning LEDs for proactive repairs.
Indoor venues held 67.65% of North America digital signage market size in 2025, buoyed by climate-controlled conditions and existing power/data infrastructure. Corporate headquarters, colleges and mall walkways rely on indoor screens for visitor orientation, promotional upsells and employee notices. In response to content fatigue, operators layer touch, gesture or QR interactions, merging in-person and mobile experiences into a single engagement funnel.
Outdoor networks, representing 32.35% of revenue but outpacing overall growth at 9.08% CAGR, benefit from durable casings, auto-dimming and self-cleaning glass treatments. Smart-city pilots add public Wi-Fi, environmental sensors and emergency alerts to justify municipal budgets, while solar-powered totems bring dynamic information to energy-constrained locales. The evolution of remote-diagnostic software slashes truck-roll expenses and lengthens uptime SLAs.
Complete Report Scope:
- By Component
- Hardware
- Software
- Services
- By Location
- Indoor
- Outdoor
- By Display Size
- Below 32 Inches
- 32 - 52 Inches
- Above 52 Inches
- By Installation Location
- In-Store
- Out-of-Store/Roadside
- By End-user Vertical
- Retail
- Transportation
- Hospitality
- Corporate
- Education
- Healthcare
- Government
- Sports and Entertainment Venues
- Other End-user Verticals
- By Hardware Type
- LCD/LED Display
- OLED Display
- Media Players
- Projectors/Projection Screens
- Transparent LED Displays
- Other Hardware Types
- By Country
- United States
- Canada
- Mexico
List of Companies Covered in this Report:
- Samsung Electronics Co., Ltd.
- LG Display Co., Ltd.
- SHARP NEC Display Solutions, Ltd.
- Sony Group Corporation
- Panasonic Corporation
- Cisco Systems, Inc.
- Planar Systems, Inc. (Leyard)
- Barco NV
- Daktronics, Inc.
- BrightSign LLC
- STRATACACHE Inc. (Scala)
- Broadsign International, LLC
- Christie Digital Systems USA, Inc.
- AOPEN Inc.
- Goodview Electronics
- Hitachi, Ltd.
- Peerless-AV
- Elo Touch Solutions, Inc.
- Mvix Digital Signage
- Four Winds Interactive
Additional Benefits:
- The market estimate (ME) sheet in Excel format
- 3 months of analyst support
TABLE OF CONTENTS
1 INTRODUCTION
- 1.1 Study Assumptions and Market Definition
- 1.2 Scope of the Study
2 RESEARCH METHODOLOGY
3 EXECUTIVE SUMMARY
4 MARKET LANDSCAPE
- 4.1 Market Overview
- 4.2 Market Drivers
- 4.2.1 Evolution of Turnkey Solutions Accelerating Deployment Across United States Retail Chains
- 4.2.2 Context-Aware Advertising Leveraging Mobile Data Enhances ROI for Canadian Advertisers
- 4.2.3 Integration of 4K/8K Video Walls Powers Experiential Venues in Major United States Airports
- 4.2.4 Smart-City Initiatives Driving Outdoor Digital Signage Roll-outs in Mexican Urban Centers
- 4.2.5 Decline in LCD Panel Prices Expands Adoption Among SMBs Across North America
- 4.2.6 Programmatic DOOH Platforms Increasing Advertiser Spend and Screen Utilisation
- 4.3 Market Restraints
- 4.3.1 Privacy Concerns Regarding Location-Based Targeting and Facial Analytics
- 4.3.2 Rising Energy-Efficiency Regulations for Large-Format Displays
- 4.3.3 Supply-Chain Volatility for High-Brightness LED Components
- 4.3.4 Capex Barriers for Independent QSRs in Rural Areas
- 4.4 Industry Ecosystem Analysis
- 4.5 Distribution Channel Analysis
- 4.6 Regulatory Landscape - Data-Privacy and Environmental Display Standards
- 4.7 Technology Snapshot
- 4.7.1 Evolution of Digital Signage Solutions in the United States
- 4.7.2 Key Technological Trends - Video Walls, 4K/8K, POS and Social Media Integration
- 4.8 Porter's Five Forces Analysis
- 4.8.1 Threat of New Entrants
- 4.8.2 Bargaining Power of Buyers
- 4.8.3 Bargaining Power of Suppliers
- 4.8.4 Threat of Substitutes
- 4.8.5 Intensity of Competitive Rivalry
5 MARKET SIZE AND GROWTH FORECASTS (VALUES)
- 5.1 By Component
- 5.1.1 Hardware
- 5.1.2 Software
- 5.1.3 Services
- 5.2 By Location
- 5.2.1 Indoor
- 5.2.2 Outdoor
- 5.3 By Display Size
- 5.3.1 Below 32 Inches
- 5.3.2 32 - 52 Inches
- 5.3.3 Above 52 Inches
- 5.4 By Installation Location
- 5.4.1 In-Store
- 5.4.2 Out-of-Store/Roadside
- 5.5 By End-user Vertical
- 5.5.1 Retail
- 5.5.2 Transportation
- 5.5.3 Hospitality
- 5.5.4 Corporate
- 5.5.5 Education
- 5.5.6 Healthcare
- 5.5.7 Government
- 5.5.8 Sports and Entertainment Venues
- 5.5.9 Other End-user Verticals
- 5.6 By Hardware Type
- 5.6.1 LCD/LED Display
- 5.6.2 OLED Display
- 5.6.3 Media Players
- 5.6.4 Projectors/Projection Screens
- 5.6.5 Transparent LED Displays
- 5.6.6 Other Hardware Types
- 5.7 By Country
- 5.7.1 United States
- 5.7.2 Canada
- 5.7.3 Mexico
6 COMPETITIVE LANDSCAPE
- 6.1 Market Concentration
- 6.2 Strategic Moves
- 6.3 Market Share Analysis
- 6.4 Company Profiles (includes Global level Overview, Market level overview, Core Segments, Financials as available, Strategic Information, Market Rank/Share for key companies, Products and Services, and Recent Developments)
- 6.4.1 Samsung Electronics Co., Ltd.
- 6.4.2 LG Display Co., Ltd.
- 6.4.3 SHARP NEC Display Solutions, Ltd.
- 6.4.4 Sony Group Corporation
- 6.4.5 Panasonic Corporation
- 6.4.6 Cisco Systems, Inc.
- 6.4.7 Planar Systems, Inc. (Leyard)
- 6.4.8 Barco NV
- 6.4.9 Daktronics, Inc.
- 6.4.10 BrightSign LLC
- 6.4.11 STRATACACHE Inc. (Scala)
- 6.4.12 Broadsign International, LLC
- 6.4.13 Christie Digital Systems USA, Inc.
- 6.4.14 AOPEN Inc.
- 6.4.15 Goodview Electronics
- 6.4.16 Hitachi, Ltd.
- 6.4.17 Peerless-AV
- 6.4.18 Elo Touch Solutions, Inc.
- 6.4.19 Mvix Digital Signage
- 6.4.20 Four Winds Interactive
7 MARKET OPPORTUNITIES AND FUTURE OUTLOOK
- 7.1 White-space and Unmet-Need Assessment


