|
시장보고서
상품코드
2113786
직접 메탄올 연료전지 : 시장 점유율 분석, 업계 동향 및 통계, 성장 예측(2026-2031년)Direct Methanol Fuel Cell - Market Share Analysis, Industry Trends & Statistics, Growth Forecasts (2026 - 2031) |
||||||
 Mordor Intelligence
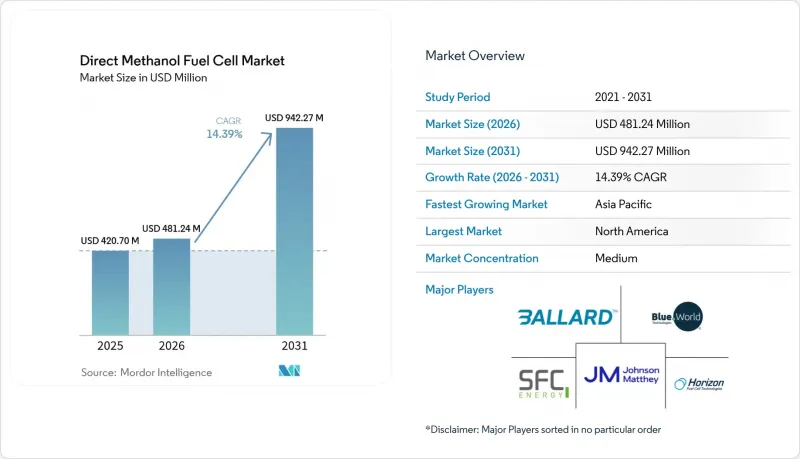
Mordor Intelligence에 의하면, 직접 메탄올 연료전지 시장 규모는 2026년에 4억 8,124만 달러로 추정되고 2025년 4억 2,070만 달러에서 확대해, 2031년에는 9억 4,227만 달러에 이를 것으로 예측됩니다.
2026년부터 2031년까지 연평균 성장률(CAGR) 14.39%로 성장할 것으로 전망됩니다.
본 보고서는 구성 부품(막전극 어셈블리, 양극판 등), 출력(100W 미만, 100-1,000W, 1,000W 이상),용도(원격 감지 및 모니터링, 군 및 방위, 기타), 최종 사용자(통신 사업자, 군사 조직, 민수용 전자기기 OEM, 기타), 지역(북미, 유럽, 아시아태평양, 기타)별로 분류되어 있습니다.
세계의 직접 메탄올 연료전지 시장 동향 및 인사이트
저소음형 휴대용 전원에 대한 군사적 수요
현대 전쟁에서 요구되는 스텔스성으로 인해, 내연기관 발전기가 발생시키는 음향 및 열 신호는 허용되지 않습니다. 메탄올 연료전지는 전기화학적 방식으로 작동하기 때문에 감지 가능한 진동이나 배기가스가 발생하지 않아, 병사나 자율형 플랫폼이 전자 기기에 전력을 공급하면서도 그 존재를 숨길 수 있습니다. 미국 국방부는 병사가 착용하는 충전기, 지상 차량, 수중 플랫폼을 아우르는 로드맵에 자금을 지원하고 있습니다. NATO가 실시한 EMILY 3000 휴대용 시스템 실증 실험에서는 연료 보급 없이 5일간의 임무를 수행할 수 있음이 확인되었으며, 이에 따라 독일 연방군과 추가 공급 계약이 체결되었습니다. 액체 메탄올은 350 bar의 압축 수소에 비해 체적 에너지 밀도가 3배이므로, 전장에서의 병참 업무가 용이해집니다. 현재 연구개발 프로그램에서는 메탄올 개질 장치와 PEM 스택을 통합하여, 고압 실린더를 사용하지 않고도 일반적인 물류용 연료 등급을 활용할 수 있게 되었습니다. 군에서 전동화 전략을 확대함에 따라 조달 지침에서 저소음성이 점점 더 중요시되고 있으며, 무선 중계, 레이더 및 이동식 지휘 장비에 직접 메탄올 유닛의 도입이 가속화되고 있습니다.
외딴 지역의 통신 타워 백업 설비 증가
인구 밀도가 낮은 지역으로 4G 및 5G 서비스 영역을 확대하는 통신 사업자는 전력망이 취약한 지역에서도 가동 시간을 확보해야 합니다. 인도네시아와 캐나다 북부의 도입 사례에 따르면, 메탄올 연료전지는 80리터 카트리지 1개로 기지국을 72시간 동안 가동할 수 있어, 매달 연료 보급 작업이 필요한 디젤 발전기를 대체하고 있습니다. 통신 사업자들은 저소음 운전, 유지보수가 거의 필요 없음, 5분 미만의 연료 주입 시간을 주요 구매 기준으로 꼽고 있습니다. 메탄올은 상온에서 액체 상태이므로, 수소 시스템에 필요한 부피가 큰 복합 실린더가 필요 없어 설치 장소의 자본 지출(CAPEX)을 절감할 수 있을 뿐만 아니라, 표준 연료 트럭을 이용한 배송이 가능해집니다. 태양광 패널 및 리튬 이온 축전지와 결합함으로써, 직접 메탄올 연료전지 시장은 인프라의 중량 및 설치 면적에 상한을 둔 신규 기지국의 사양 요건을 충족하게 되었습니다. 이러한 가치 제안은 디젤 발전기에 대한 배출 규제를 강화하고 통신 사업자들에게 청정 전력 옵션으로의 전환을 촉진하고 있는 인도와 나이지리아의 규제 당국에 의해 더욱 뒷받침되고 있습니다.
백금·루테늄 촉매의 비용 및 공급 위험
남아프리카공화국과 러시아는 1차 백금 및 루테늄 생산량의 80% 가까이를 차지하고 있으며, 공급망은 지정학적 요인과 노동 문제로 인한 혼란의 영향을 받기 쉬운 상황에 있습니다. 세계 백금 투자 위원회(WPIC)의 예측에 따르면, 2030년까지 수소 및 연료전지 용도의 백금 수요는 연간 875 koz에 달할 것으로 예상되어, 다른 분야공급 부족이 우려됩니다. 직접 메탄올 연료전지 시장의 촉매층에서는 현재 CO 중독을 방지하기 위해 최대 6 mg PGM/cm²가 사용되고 있으며, 스택 비용은 금속 현물 가격과 직결되어 있습니다. 미국 에너지부가 주도하는 연구에서는 2030년까지 PGM 부하량을 3 mg/cm² 이하로 낮추고, 피크 전력 밀도를 300 mW/cm² 이상으로 높이는 것을 목표로 하고 있습니다(ENERGY.GOV). 그래핀 시트 위에 고정화된 단일 원자 루테늄은 유망한 산소 환원 반응 속도를 보이고 있지만, 사이클 시험 하에서의 내구성에 대해서는 현재도 검증이 진행 중입니다. 재활용을 통한 노력만으로는 향후 10년간의 예상 수요의 10-15%밖에 공급할 수 없기 때문에 개발 기업들은 비PGM 촉매나 고엔트로피 합금 개발을 추진하고 있으나, 이들이 2030년까지 양산 단계에 도달할 가능성은 낮을 것으로 보입니다.
부문 분석
2025년에는 막-전극 어셈블리(MEA)가 매출 점유율에서 최대인 40.65%를 차지했으며, 이 부문은 2031년까지 연평균 성장률(CAGR) 15.08%로 가장 높은 성장률을 나타낼 것으로 예측됩니다. 고성능 폴리비닐 알코올 복합막은 현재 60°C에서 메탄올 투과율이 1×10⁻⁶cm2·s 미만, 양성자 전도도가 70 mS·cm 이상을 나타내고 있으며, 이는 비불소계 골격을 사용하면서도 나피온에 버금가는 성능입니다. 5-설포살리실산을 도입한 가교형은 열 사이클 하에서 내구성을 더욱 향상시켰습니다. 바이폴라 플레이트의 경우, 니오브·티타늄 코팅을 통해 전기 전도도가 42.6%, 열 전도도가 3.5% 향상되어 미국 에너지부의 목표치를 상회하며, 스테인리스 스틸 기준선과의 비용 격차를 줄이고 있습니다. 적층 조형 기술을 통해 반응물의 분포와 물 관리를 최적화하는 구불구불한 유동장 형상이 가능해져, 스택의 차압 손실을 18% 저감했습니다. 휴대용 및 고정형 시스템 통합사업자들이 턴키 솔루션을 요구하는 가운데, 연료 카트리지와 플랜트 주변 기기에 대한 수요도 병행하여 확대되고 있습니다. 세균 셀룰로오스를 원료로 하는 신흥 바이오 막은 62.2 mS/cm의 전도도를 보여주고 있으며, 순환 경제의 새로운 가능성을 열어가고 있습니다. 지속적인 기술 발전으로 인해 직접 메탄올 연료전지 시장은 신뢰성 향상은 물론, 비용 절감의 혜택도 확실히 누릴 수 있게 되었습니다.
2025년에는 100W-1,000W급이 직접 메탄올 연료전지 시장 규모의 55.40%를 차지했으며, 2031년까지 연평균 성장률(CAGR) 14.55%로 선두 자리를 유지할 것으로 예측됩니다. 이 범위의 장치는 통신, 감시 및 군용 보조 전원 분야에서 연료 보급 주기, 설치 면적 및 초기 투자 비용의 균형이 최적입니다. 100W 미만의 장치는 유지보수 비용이 높을 수 있는 틈새 시장인 소비자용 전자기기 및 센서 노드용으로 제공됩니다. 1kW를 초과하는 출력 범위에서는 수소 PEM 및 고체 산화물 시스템이 더 높은 출력 밀도를 제공하기 때문에 DMFC의 점유율은 선박의 보조 전원 및 Off-grid 산업 시설로 제한되어 있습니다. 최근 실시된 200 kW 선박용 스택 실증 실험은 확장성을 입증했으나, 여전히 상용화 전 단계에 있습니다. 전반적으로, 각 통합 업체들이 폼 팩터의 제약 범위 내에서 중복성을 확보하기 위해 여러 개의 500 W 스택을 병렬로 연결할 수 있는 모듈식 아키텍처를 추구하는 가운데, 중출력 대역 부문은 계속해서 투자를 유치할 것으로 보입니다.
지역별 분석
북미는 2025년에 전 세계 매출의 37.50%를 차지했으며, 이는 원격 지역의 저소음 전원 및 통신 설비의 내환경성 강화를 우선시하는 국방 예산에 힘입은 것입니다. 수소 및 관련 기술에 대한 연방 정부의 연구개발(R&D) 자금은 70억 달러를 초과하여, 지역 공급업체들에게 혁신 면에서 우위를 점하게 하고 있습니다. 캘리포니아주 대기자원국은 메탄올을 면제 대상 대체 선박 연료로 지정하여, 이에 따라 태평양 연안 항만의 해운 부문에서 성장이 예상됩니다. 이 지역은 선도적인 입지를 차지하고 있지만, 규모의 경제 효과를 누리는 아시아 제조업체들과의 비용 경쟁이 심화되고 있습니다.
아시아태평양은 산업 정책의 연계와 광범위한 제조 능력을 바탕으로 2031년까지 연평균 성장률(CAGR) 18.20%를 나타낼 것으로 전망됩니다. 한국은 모든 화학 계열을 합친 연료전지 설치 용량이 1GW를 넘어, 부품 생산의 거점으로 자리매김하고 있습니다. 중국은 고정형 발전 장치와 메탄올 충전소를 공동으로 사용하는 버스 및 물류 트럭에 주력함으로써, 연료전지차 보유 대수에서 일본을 추월했습니다. 일본은 기술적 리더십을 유지하고 있으며, 스마트 시티 전력망에서의 실증 사업을 확대되고 있습니다. 인도 및 아세안(ASEAN) 국가들은 보편적 서비스 의무(USO) 프로젝트에 DMFC 타워를 도입하고 있어, 이로 인해 예측 기간 동안 해당 지역 전체 수요가 증가할 것으로 전망됩니다.
유럽은 엄격한 배기가스 규제를 통해 계속해서 기술 방향에 영향을 미치고 있습니다. ‘FuelEU Maritime’ 규정은 2025년 1월 1일에 시행되어 온실가스 배출 강도를 2% 감축하도록 의무화하고 있으며, 이에 따라 보조 발전기용 메탄올 개조에 대한 문의가 잇따르고 있습니다. 독일 연방군은 북극권 기온 조건에서 5일간 무음 감시가 가능하다는 점을 실증 시험을 통해 확인한 후, 휴대용 메탄올 유닛을 추가 발주했습니다. 베네룩스 지역에서는 내륙 수송용으로 1.25 MW PEM 전해조를 활용한 최초의 e-메탄올 플랜트가 가동을 시작하며, 지역 내 수요 증가의 기반을 마련하고 있습니다. 남유럽 및 동유럽에서는 중요 인프라를 위한 친환경 휴대용 전원에 자금을 지원하는 EU 부흥 기금에 따라 산발적인 시범 도입 사례가 보고되고 있습니다.
기타 혜택 :
- 엑셀 형식 시장 예측(ME) 시트
- 3개월간의 애널리스트 지원
자주 묻는 질문
목차
제1장 서론
제2장 조사 방법
제3장 주요 요약
제4장 시장 구도
제5장 시장 규모 및 성장 예측
제6장 경쟁 구도
제7장 시장 기회 및 향후 전망
KTH 26.08.26According to Mordor Intelligence, direct methanol fuel cell market size in 2026 is estimated at USD 481.24 million, growing from 2025 value of USD 420.70 million with 2031 projections showing USD 942.27 million, growing at 14.39% CAGR over 2026-2031.
This report is Segmented by Component (Membrane Electrode Assembly, Bipolar Plates, and More), Power Output (Below 100 W, 100 To 1, 000 W, and Above 1, 000 W), Application (Remote Sensing and Surveillance, Military and Defense, and More), End-User (Telecom Operators, Military Organisations, Consumer Electronics OEMs, and More), and Geography (North America, Europe, Asia-Pacific, and More).
Global Direct Methanol Fuel Cell Market Trends and Insights
Military demand for silent portable power
Stealth requirements in modern warfare prohibit internal combustion generators' acoustic and thermal signatures. Methanol fuel cells operate electrochemically, eliminating detectable vibrations and exhaust, which allows soldiers and autonomous platforms to remain concealed while powering electronics. The US Department of Defense funds a roadmap that spans soldier-worn chargers, ground vehicles, and submerged platforms. NATO demonstrations of the EMILY 3000 portable system validated five-day missions without refuel, prompting follow-up supply contracts from the Bundeswehr. Liquid methanol delivers three times the volumetric energy density of compressed hydrogen at 350 bar, easing battlefield logistics. R&D programs now integrate methanol reformers with PEM stacks so common logistic fuel grades can be used without high-pressure cylinders. As militaries broaden electrification strategies, procurement guidelines increasingly specify low acoustic profiles, accelerating the adoption of direct methanol units in radio relay, radar, and mobile command assets.
Rising telecom tower backup installations in remote areas
Mobile operators expanding 4G and 5G footprints into sparsely populated zones must guarantee uptime where the grid is weak. Deployments in Indonesia and northern Canada show methanol fuel cells can keep base transceiver stations online for 72 hours on a single 80 L cartridge, replacing diesel generators that require monthly refueling runs. Operators cite silent operation, negligible maintenance, and sub-5-minute refuel time as key purchase criteria. Methanol's liquid state at ambient conditions avoids the bulky composite cylinders that hydrogen systems need, lowering site capex and permitting delivery by standard fuel trucks. Combined with solar panels and lithium-ion buffers, direct methanol fuel cells now meet new-build tower specifications that cap infrastructure weight and footprint. The value proposition is amplified by regulators in India and Nigeria who tighten emissions limits around diesel gensets, nudging operators toward cleaner power options.
Platinum-ruthenium catalyst cost and supply risk
South Africa and Russia account for nearly 80% of primary platinum and ruthenium output, exposing the supply chain to geopolitical and labor disruptions. The World Platinum Investment Council projects that hydrogen and fuel cell applications will demand 875 koz platinum annually by 2030, tightening availability for other sectors. Catalyst layers in direct methanol fuel cells currently use up to 6 mg PGM cm2 to combat CO poisoning, directly linking stack cost to metal spot prices. Research led by the US Department of Energy targets <=3 mg PGM cm2 loading and >=300 mW cm2 peak power density by 2030 ENERGY.GOV. Single-atom ruthenium anchored on graphene sheets has delivered encouraging oxygen-reduction kinetics, but durability under cycling remains under validation. Recycling initiatives can only supply 10-15% of projected demand this decade, so developers pursue non-PGM catalysts and high-entropy alloys, although these are unlikely to reach volume commercial readiness before 2030.
Other drivers and restraints analyzed in the detailed report include:
- Methanol price stability versus hydrogen
- EU defence-focused carbon targets
- Low volumetric efficiency versus Li-ion above 1 kW
For complete list of drivers and restraints, kindly check the Table Of Contents.
Segment Analysis
Membrane electrode assemblies controlled the largest 40.65% revenue share in 2025, and the segment is expected to post the fastest 15.08% CAGR through 2031. High-performance polyvinyl-alcohol composite membranes now show methanol permeability below 1 X 10⁻⁶ cm2 s and proton conductivity above 70 mS cm at 60 °C, metrics that approach Nafion while using non-fluorinated backbones. Cross-linked variants incorporating 5-sulfosalicylic acid further improve durability under thermal cycling. Within bipolar plates, niobium-titanium coatings have lifted electrical conductivity 42.6% and thermal conductivity 3.5%, exceeding US Department of Energy targets and narrowing the cost gap with stainless steel baseline. Additive manufacturing allows serpentine flow-field geometries that optimize reactant distribution and water management, lowering stack differential pressure losses by 18%. Fuel cartridges and balance-of-plant components grow parallel as portable and stationary integrators demand turnkey solutions. Emerging bio-based membranes sourced from bacterial cellulose register a conductivity of 62.2 mS cm and open circular-economy opportunities. Continuous advances ensure the direct methanol fuel cells market benefits from cost reductions alongside reliability gains.
The 100 W-1,000 W class captured 55.40% of the direct methanol fuel cells market size in 2025 and is forecast to retain leadership with a 14.55% CAGR to 2031. Units in this range offer the optimal compromise between refuel interval, footprint, and capital cost for telecom, surveillance, and auxiliary military uses. Sub-100 W devices serve niche consumer electronics and sensor nodes where maintenance callouts are expensive. Above 1 kW, hydrogen PEM and solid oxide systems provide higher power density, limiting DMFC's share to marine auxiliary power and off-grid industrial sites. Recent demonstrations of a 200 kW maritime stack prove scalability yet remain pre-commercial. Overall, the mid-range segment will continue to command investment as integrators pursue modular architectures that can parallel multiple 500 W stacks for redundancy while staying within form-factor constraints.
Complete Report Scope:
- By Component
- Membrane Electrode Assembly (MEA)
- Bipolar Plates
- Fuel Cartridges and Tanks
- Balance-of-Plant (BoP) Hardware
- Others
- By Power Output
- Below 100 W
- 100 to 1,000 W
- Above 1,000 W
- By Application
- Portable Power
- Military and Defense
- Remote Sensing and Surveillance
- Marine and Leisure Craft
- Stationary Backup Power
- Other Niche Uses
- By End-User Industry
- Military Organisations
- Telecom Operators
- Oil and Gas and Mining
- Industrial and Construction
- Consumer Electronics OEMs
- Transportation and Logistics
- By Geography
- North America
- United States
- Canada
- Mexico
- Europe
- Germany
- United Kingdom
- France
- Italy
- NORDIC Countries
- Russia
- Rest of Europe
- Asia-Pacific
- China
- India
- Japan
- South Korea
- ASEAN Countries
- Rest of Asia-Pacific
- South America
- Brazil
- Argentina
- Rest of South America
- Middle East and Africa
- Saudi Arabia
- United Arab Emirates
- South Africa
- Rest of Middle East and Africa
- North America
Geography Analysis
North America generated 37.50% of global revenue in 2025, underpinned by defense allocations prioritizing quiet power sources and telecom hardening across remote territories. Federal R&D funding surpasses USD 7 billion for hydrogen and related technologies, giving regional suppliers an innovation edge. California's Air Resources Board lists methanol as an exempt alternative marine fuel, adding maritime upside in Pacific ports. Despite leadership, the region faces rising cost competition from Asian manufacturers that benefit from scale efficiencies.
Asia-Pacific is projected to grow at an 18.20% CAGR through 2031, propelled by industrial policy coordination and widespread manufacturing capacity. Korea commands more than 1 GW of installed fuel-cell capacity across all chemistries, making it a component hub. China has overtaken Japan in fuel cell vehicle fleet size by focusing on buses and logistics trucks that share methanol fueling stops with stationary power units. Japan retains technical leadership and is expanding demonstrations in smart-city power grids. India and ASEAN nations deploy DMFC towers in universal service obligation projects, raising regional volumes over the outlook period.
Europe continues to influence technology direction via stringent emissions standards. The FuelEU Maritime rule began on 1 January 2025 and mandates 2% greenhouse-gas intensity reduction, triggering methanol retrofit inquiries for auxiliary generators. Germany's Bundeswehr placed repeat orders for portable methanol units after field trials confirmed a five-day silent watch at Arctic temperatures. The Benelux region launched its first e-methanol plant using a 1.25 MW PEM electrolyzer to supply inland shipping, anchoring local demand growth. Southern and Eastern Europe report scattered pilot deployments aligned with EU recovery funds that earmark clean portable power for critical infrastructure.
- Blue World Technologies ApS
- Johnson Matthey Plc
- SFC Energy AG
- Ballard Power Systems Inc.
- Horizon Fuel Cell Technologies
- Oorja Protonics Inc.
- MeOH Power Inc.
- TreadStone Technologies Inc.
- Fujikura Ltd.
- VIASPACE Inc.
- Siqens GmbH
- SerEnergy A/S
- Sushui Energy Technology
- Hitachi Zosen Corp.
- Toshiba Energy Systems & Solutions
- Panasonic Corp.
- Plug Power Inc.
- Protonex Technology Corp.
- Sony Corp. (Fuel-cell R&D)
- Tokuyama Corp.
Additional Benefits:
- The market estimate (ME) sheet in Excel format
- 3 months of analyst support
TABLE OF CONTENTS
1 Introduction
- 1.1 Study Assumptions & Market Definition
- 1.2 Scope of the Study
2 Research Methodology
3 Executive Summary
4 Market Landscape
- 4.1 Market Overview
- 4.2 Market Drivers
- 4.2.1 Military demand for silent portable power
- 4.2.2 Rising telecom tower backup installations in remote areas
- 4.2.3 Methanol price stability versus hydrogen
- 4.2.4 EU defence-focused carbon targets
- 4.2.5 Mini-UAV endurance requirement over 8 h
- 4.2.6 Maritime emissions rules pushing auxiliary DMFC
- 4.3 Market Restraints
- 4.3.1 Platinum-Ru catalyst cost & supply risk
- 4.3.2 Low volumetric efficiency v. Li-ion at Above 1 kW
- 4.3.3 Methanol transport restrictions on passenger aircraft
- 4.3.4 OEM hesitancy after early consumer-electronics failures
- 4.4 Supply-Chain Analysis
- 4.5 Regulatory Landscape
- 4.6 Technological Outlook
- 4.7 Porter's Five Forces
- 4.7.1 Bargaining Power of Suppliers
- 4.7.2 Bargaining Power of Consumers
- 4.7.3 Threat of New Entrants
- 4.7.4 Threat of Substitute Products
- 4.7.5 Intensity of Competitive Rivalry
5 Market Size & Growth Forecasts
- 5.1 By Component
- 5.1.1 Membrane Electrode Assembly (MEA)
- 5.1.2 Bipolar Plates
- 5.1.3 Fuel Cartridges and Tanks
- 5.1.4 Balance-of-Plant (BoP) Hardware
- 5.1.5 Others
- 5.2 By Power Output
- 5.2.1 Below 100 W
- 5.2.2 100 to 1,000 W
- 5.2.3 Above 1,000 W
- 5.3 By Application
- 5.3.1 Portable Power
- 5.3.2 Military and Defense
- 5.3.3 Remote Sensing and Surveillance
- 5.3.4 Marine and Leisure Craft
- 5.3.5 Stationary Backup Power
- 5.3.6 Other Niche Uses
- 5.4 By End-User Industry
- 5.4.1 Military Organisations
- 5.4.2 Telecom Operators
- 5.4.3 Oil and Gas and Mining
- 5.4.4 Industrial and Construction
- 5.4.5 Consumer Electronics OEMs
- 5.4.6 Transportation and Logistics
- 5.5 By Geography
- 5.5.1 North America
- 5.5.1.1 United States
- 5.5.1.2 Canada
- 5.5.1.3 Mexico
- 5.5.2 Europe
- 5.5.2.1 Germany
- 5.5.2.2 United Kingdom
- 5.5.2.3 France
- 5.5.2.4 Italy
- 5.5.2.5 NORDIC Countries
- 5.5.2.6 Russia
- 5.5.2.7 Rest of Europe
- 5.5.3 Asia-Pacific
- 5.5.3.1 China
- 5.5.3.2 India
- 5.5.3.3 Japan
- 5.5.3.4 South Korea
- 5.5.3.5 ASEAN Countries
- 5.5.3.6 Rest of Asia-Pacific
- 5.5.4 South America
- 5.5.4.1 Brazil
- 5.5.4.2 Argentina
- 5.5.4.3 Rest of South America
- 5.5.5 Middle East and Africa
- 5.5.5.1 Saudi Arabia
- 5.5.5.2 United Arab Emirates
- 5.5.5.3 South Africa
- 5.5.5.4 Rest of Middle East and Africa
- 5.5.1 North America
6 Competitive Landscape
- 6.1 Market Concentration
- 6.2 Strategic Moves (M&A, Partnerships, PPAs)
- 6.3 Market Share Analysis (Market Rank/Share for key companies)
- 6.4 Company Profiles (includes Global level Overview, Market level overview, Core Segments, Financials as available, Strategic Information, Products & Services, and Recent Developments)
- 6.4.1 Blue World Technologies ApS
- 6.4.2 Johnson Matthey Plc
- 6.4.3 SFC Energy AG
- 6.4.4 Ballard Power Systems Inc.
- 6.4.5 Horizon Fuel Cell Technologies
- 6.4.6 Oorja Protonics Inc.
- 6.4.7 MeOH Power Inc.
- 6.4.8 TreadStone Technologies Inc.
- 6.4.9 Fujikura Ltd.
- 6.4.10 VIASPACE Inc.
- 6.4.11 Siqens GmbH
- 6.4.12 SerEnergy A/S
- 6.4.13 Sushui Energy Technology
- 6.4.14 Hitachi Zosen Corp.
- 6.4.15 Toshiba Energy Systems & Solutions
- 6.4.16 Panasonic Corp.
- 6.4.17 Plug Power Inc.
- 6.4.18 Protonex Technology Corp.
- 6.4.19 Sony Corp. (Fuel-cell R&D)
- 6.4.20 Tokuyama Corp.
7 Market Opportunities & Future Outlook
- 7.1 White-space & Unmet-Need Assessment