

|
시장보고서
상품코드
2113835
재생의료 : 시장 점유율 분석, 업계 동향 및 통계, 성장 예측(2026-2031년)Regenerative Medicine - Market Share Analysis, Industry Trends & Statistics, Growth Forecasts (2026 - 2031) |
||||||
 Mordor Intelligence
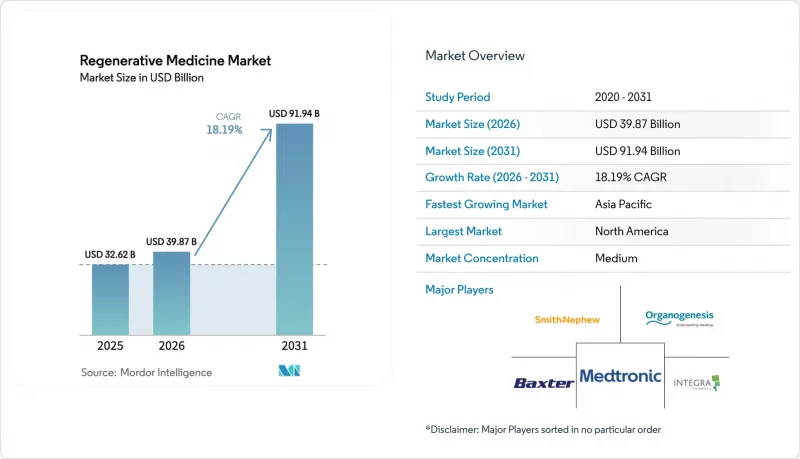
Mordor Intelligence에 의하면, 재생의료 시장 규모는 2025년에 326억 2,000만 달러로 평가되었습니다. 2026년에 398억 7,000만 달러에 달하고, 2031년까지 919억 4,000만 달러에 이를 것으로 예측됩니다.
2026-2031년 동안 연평균 성장률(CAGR) 18.19%로 성장할 것으로 전망됩니다.
본 보고서는 제품 유형별(세포 치료, 유전자 치료, 기타), 치료 분야별(종양학, 근골격계 질환, 기타), 소재별(합성 소재, 생물 유래 소재, 기타), 최종 사용자별(병원, 기타),지역별(북미, 유럽, 아시아태평양, 중동 및 아프리카, 남미)로 분류되어 있습니다. 시장 예측은 금액(미 달러) 기준으로 제시되어 있습니다.
세계의 재생의료 시장 동향 및 인사이트
만성 질환 부담 증가
2021년에는 비감염성 질환으로 인해 전 세계적으로 4,300만 명이 사망했으며, 2024년까지 당뇨병 유병률은 16% 증가하여 성인 5억 3,700만 명에 달했습니다. 이에 따라 보험사들은 평생 인슐린 의존보다는 β세포 기능을 재생시키는 치료법을 우선시하고 있습니다. 2030년까지 근골격계 질환으로 인해 7,800만 명의 미국 성인이 기능 장애를 겪을 것으로 예측되며, 관절 치환술을 미룰 수 있게 해주는 연골 재생 제품에게는 연간 120억 달러 규모 시장 기회가 창출되고 있습니다. 혈액 악성 종양은 이러한 변화를 여실히 보여주고 있습니다. 미만성 대세포형 B세포 림프종의 5년 전체 생존율은 CAR-T 요법을 통해 50%를 넘어섰지만, 구제 화학요법에서는 15%에 그치고 있어, 이에 따라 일련의 재생의료적 개입 대상이 되는 환자 집단이 확대되고 있습니다. 심혈관 프로그램은 매출 측면에서 종양학에 뒤처지고 있지만, 동종 중간엽 줄기세포 주입 후 중대한 이상반응이 37% 감소한 것으로 나타났으며, 이는 심실 보조 장치에 대한 근치적 보조 요법로의 전환을 시사합니다. 인구 고령화와 다중 질환 병존 증가에 따라, 지속 가능한 일회성 치료법에 대한 수요가 재생의료 시장의 성장 궤도를 뒷받침하고 있습니다.
세포 및 유전자 치료의 승인 및 보험 적용 가속화
미국 식품의약국(FDA)은 2024년, 활막육종에 대한 최초의 고형암용 CAR-T 요법을 포함한 8가지 재생의료 첨단 요법을 승인했습니다. 한편, 유럽의약품청(EMA)은 같은 해, 메타크로마틱 백질 이영양증에 대한 최초의 체외 요법에 조건부 승인을 부여했습니다. CMS(미국 의료보험 및 의료보조 서비스 센터)는 전국 보험 적용 결정(NCD) 110.23을 확대하여 골수이형성증후군에 대한 동종 조혈모세포 이식을 포함하기로 했으며, 이에 따라 약 1만 5,000명의 메디케어 수혜자가 추가되고 연간 4억 5,000만 달러의 환급이 늘어났습니다. 새로운 ‘신기술에 대한 과도기적 보험 적용(Transitional Coverage for Emerging Technologies)’ 규정에 따라, FDA 승인 후 6개월 이내에 메디케어의 과도기적 결제가 보장됨으로써, 과거 도입을 지연시켰던 시장 출시까지의 공백이 단축되었습니다. 현재 35개 주의 메디케이드 프로그램이 ‘세포 및 유전자 치료 접근 모델’에 따라 위험을 공동 부담하고 있으며, 겸상적혈구증 치료를 위해 200만 미달러가 넘는 치료비를 공동 부담하고 있습니다. 중국 규제 당국은 2024년에 6개의 국산 CAR-T 제품을 승인했으며, 그 가격은 유럽 및 미국의 기준 가격보다 60% 낮게 책정되어 18개 성립 병원에서 도입이 촉진되고 있습니다.
고액의 치료비와 보험 적용 범위 제한
자가 유래 CAR-T 제제의 가격은 37만 3,000-51만 5,000달러로 추정되며, 입원비와 이상반응 관리비를 포함하면 총 치료비는 120만 달러에 달할 가능성이 있습니다. 2024년에는 환자 이탈을 우려한 미국 민간 보험사의 40%가 이러한 비용의 지급을 거부해, 그 고액이 문제가 되었습니다. 350만 달러에 달하는 혈우병 유전자 치료의 경우, 10년에 걸친 상각이 필요하지만, 그 지속성에 관한 데이터가 제한적이라는 점을 감안할 때, 많은 지급 기관은 이러한 약속을 고위험으로 간주하고 있습니다. 미국 15개 주의 메디케이드 사전 승인 규정에 따르면, 이전의 두 가지 치료법이 실패한 것이 조건으로 되어 있어, 이로 인해 치료 접근이 4-6개월 지연될 뿐만 아니라, 병세가 악화된 환자들이 제외되고 맙니다. 신흥 시장에서는 본인 부담금이 가구 연소득의 10배 이상에 달하기 때문에 치료를 받는 것은 극히 일부의 부유층으로 한정되어 있습니다. 치료 효과를 얻지 못했을 경우 가격의 50-80%를 환불하는 성과 연동형 계약은 지불자의 리스크를 경감시키는 한편, 수익의 변동성을 초래하여 자금 조달을 어렵게 만들고 있습니다. 2024년 Bluebird Bio가 4억 5,000만 달러의 자금 조달 규모를 축소한 사례가 이를 잘 보여줍니다.
부문별 분석
가장 빠르게 발전하고 있는 제품 유형인 유전자 치료는 2031년까지 연평균 성장률(CAGR) 20.73%를 나타낼 것으로 예측됩니다. 이는 2025년 론자(Lonza)의 휴스턴 캠퍼스에서 AAV 역가가 4배 증가한 바이러스 벡터의 강화가 원동력이 되고 있습니다. 세포 치료는 여전히 매출의 대부분을 차지하고 있으며, 2025년에는 상용 CAR-T 제품을 통해 치료를 받은 환자 수가 1만 8,000명에 달함에 따라 해당 연도 매출의 47.81%를 차지했습니다. 후기 임상시험 단계에 있는 동종 CAR-T 플랫폼은 제조 주기를 기존 2주에서 48시간으로 단축할 수 있을 것으로 예상되며, 이로 인해 기성 제품이 자가 유래 제품 시장 점유율을 잠식할 입장에 서 있습니다. 혈소판 농축 혈장(다혈소판 혈장)은 여전히 틈새 시장이지만 수익성이 높은 선택지이며, 미국 보험사의 22%가 정형외과용 주사에 대해 보험 적용을 하고 있습니다.
세포 치료의 단기적 성장은 초기 치료 단계의 혈액 질환에 대한 적응증 확대와 2024년에 달성된 고형암에 대한 첫 승인을 좌우할 것입니다. 한편, 줄기세포 하위 부문은 일본의 iPS 세포 규모 확대 구상의 혜택을 받고 있습니다. 유전자 치료 파이프라인은 검증 절차의 수를 줄여주는 플랫폼 제조 지침 덕분에 혈우병 및 망막 질환에서 신경퇴행성 질환 및 대사성 질환으로 다양화되고 있습니다. 조직 공학 기업들은 CRISPR로 편집된 세포를 수용할 수 있는 모듈식 스캐폴드 개발을 추진하고 있으며, 재생 의료 시장에서 기존 부문의 경계를 모호하게 만드는 하이브리드 제품을 만들어내고 있습니다. 이러한 동향들이 맞물려, 유전자 치료가 속도 면에서 다른 부문을 능가하고 있는 모든 치료법에 걸쳐 견조한 투자가 유지되고 있습니다.
신경 질환 부문은 파킨슨병 3상 임상시험에서 AAV-GDNF 벡터와,뇌부신백질이영양증에 대한 Bluebird Bio의 Lenti-D의 미국 내 적용 범위 확대에 힘입어 연평균 성장률(CAGR) 22.08%를 기록하며, 치료 부문 중 가장 빠른 성장률을 보일 것으로 전망됩니다. 종양학은 계속해서 수익의 주축이 되어 2025년 매출의 34.52%를 차지했지만, 혈액 질환 적응증이 포화 상태에 가까워지고 고형암의 생물학적 특성이 면역 억제의 장벽이 되기 때문에 그 성장세는 완만해질 것입니다. 근골격계 부문은 퇴행성 관절염 유병률 증가에 따라 꾸준히 확대되고 있으며, 상처 치료 매출은 어피니티(Affinity)사의 제품 출시로 가속화되고 있습니다.
종양학 부문의 향후 성장은 종양 미세환경 조절제 및 육종과 교모세포종을 표적으로 하는 이중 표적 CAR 아키텍처에 달려 있습니다. 신경학 부문에서는 실제 임상에서 지속성에 관한 데이터가 고가의 단회 투여 요법과 만성적인 저분자 치료의 비교에 있어 보험사의 수용을 결정짓게 될 것입니다. 순환기 부문의 벤처 기업들은 기계적 기기와 통합되는 동종 유래 중간엽 세포로 무게중심을 옮기며, 단독 근치 치료가 아닌 보조적 적응증 개발을 추구하고 있습니다. 전반적으로 치료법의 다양화로 인해 재생의료 시장 전체의 성장은 단일 적응증에 따른 변동의 영향을 덜 받게 되었습니다.
지역별 분석
북미는 2025년 매출의 44.16%를 차지했습니다. 이는 여러 유형의 혈액암에 대한 CAR-T 요법의 보험 적용을 인정하는 CMS(미국 의료보험서비스센터)의 규정과, FDA 승인 후 6개월 이내에 잠정적인 결제를 보장하는 ‘신기술에 대한 잠정적 보험 적용(Transitional Coverage for Emerging Technologies)’ 제도에 힘입은 결과입니다. 22개 의료 시스템에서 채택된 성과 연계형 계약은 예산에 미치는 영향을 완화하고 환자의 접근성 확대를 촉진하고 있습니다. 캐나다에서는 구매 수량 확약을 통해 40%의 가격 양보를 협상한 반면, 멕시코에서는 2건의 CAR-T 승인이 내려졌으나 본인 부담금이 20만 달러를 초과하여 경제적 부담이라는 과제에 직면해 있습니다.
연평균 성장률(CAGR) 23.76%로 가장 빠르게 성장하고 있는 아시아태평양에서는 중국에서 6개의 국내 CAR-T 치료법이 승인되었고, 가격이 120만 위안(16만 5,000달러)으로 책정됨에 따라 18개 성립병원에서 도입이 가속화되었습니다. 일본에서는 iPS 세포 유래 치료법 4건이 조건부 승인을 받아 승인까지 소요되는 기간이 3년 단축되었습니다. 또한, 인도의 18개월짜리 1상·2상 임상시험 단축 절차 덕분에 하이데라바드와 방갈로르의 CDMO 클러스터에 21억 달러의 외국인 직접 투자가 유치되었습니다. 싱가포르의 90일 심사 규정은 투아스 바이오메디컬 파크로의 고적층 제조 유치로 이어지고 있는 반면, 한국에서는 CAR-T의 제조 비용이 저렴하다는 점이 동남아시아로의 수출 기회를 넓혀가고 있습니다.
유럽은 2025년 매출의 22.8%를 차지하며, 이는 ‘렌멜디(Lenmeldy)’의 조건부 승인 및 6개월간 관해율에 연동된 각국의 성과 기반 계약에 힘입은 결과입니다. 영국의 ‘의약품 조기 접근 제도(Early Access to Medicines Scheme)’ 확대로 인해 수익이 18개월 앞당겨졌으며, 독일의 리베이트 모델은 공급업체 간의 금액 기준 경쟁을 촉진하고 있습니다. 이탈리아와 스페인에서는 소아 적응증에 대한 완전한 접근성을 유지하면서, 시장 진입 관리 협정을 통해 유전자 치료에 대한 지출 상한선을 설정하고 있습니다. 중동 및 아프리카에서는 샌드박스 제도에 따른 인센티브가 매출의 4.6%를 차지하고 있으며, 특히 아랍에미리트(UAE)에서는 이러한 인센티브에 대한 의존도가 두드러집니다. 반면, 남아프리카공화국에서는 승인 건수가 제한적입니다. 또한, 남미의 3.9%라는 점유율은 비용 장벽으로 인해 브라질의 고도로 복잡한 치료를 수행하는 시설에 집중되어 있습니다.
전반적으로 재생의료 시장에는 지역별 차이가 나타나는데, 북미에서는 환급 범위의 확대가 성장을 견인하고, 아시아태평양에서는 비용 혁신이 성장을 뒷받침하며, 유럽에서는 시장 진입 관리 협정이 시장 확대를 억제하고 있습니다. 공급망의 현지화-중국의 AAV 제조 시설, 일본의 iPS 세포 공장, 미국의 바이오 프린팅 거점을 통해 생산은 성장이 가장 두드러지는 수요 거점에 더욱 확고히 자리 잡고 있습니다.
기타 혜택
- 엑셀 형식 시장 예측(ME) 시트
- 3개월간의 애널리스트 지원
자주 묻는 질문
목차
제1장 서론
제2장 조사 방법
제3장 주요 요약
제4장 시장 구도
제5장 시장 규모 및 성장 예측
제6장 경쟁 구도
제7장 시장 기회 및 향후 전망
KTH 26.08.26According to Mordor Intelligence, the regenerative medicine market size is projected to be USD 32.62 billion in 2025, USD 39.87 billion in 2026, and reach USD 91.94 billion by 2031, growing at a CAGR of 18.19% from 2026 to 2031.
This report is Segmented by Product Type (Cell Therapy, Gene Therapy, and More), Therapeutic (Oncology, Musculoskeletal Disorders, and More), Material (Synthetic Materials, Biologically Derived Materials, and More), End User (Hospitals, and More), and Geography (North America, Europe, Asia-Pacific, Middle East & Africa, South America). The Market Forecasts are Provided in Terms of Value (USD).
Global Regenerative Medicine Market Trends and Insights
Rising Chronic Disease Burden
Non-communicable diseases caused 43 million deaths worldwide in 2021, and diabetes prevalence rose 16% to 537 million adults by 2024, prompting payers to prioritize therapies that regenerate beta-cell function over lifelong insulin dependence. Musculoskeletal disorders are projected to impair 78 million U.S. adults by 2030, opening a USD 12 billion annual opportunity for cartilage-repair products that can defer joint-replacement surgery. Hematologic malignancies illustrate the shift: five-year overall survival for diffuse large B-cell lymphoma surpassed 50% with CAR-T, compared with 15% on salvage chemotherapy, enlarging the patient cohort eligible for successive regenerative interventions. Cardiovascular programs trail oncology in revenue but demonstrated a 37% reduction in major adverse events after allogeneic mesenchymal stem-cell infusion, suggesting a move toward curative adjuncts to ventricular-assist devices. As populations age and multimorbidity increases, demand for durable, one-time treatments underpins the growth trajectory of the regenerative medicine market.
Accelerating Approvals & Reimbursement of Cell/Gene Therapies
The U.S. FDA cleared eight regenerative medicine advanced therapies in 2024, including the first solid-tumor CAR-T therapy for synovial sarcoma. Meanwhile, the European Medicines Agency granted conditional approval for the first ex vivo therapy for metachromatic leukodystrophy that same year. CMS expanded National Coverage Determination 110.23 to include allogeneic stem cell transplants for myelodysplastic syndrome, adding approximately 15,000 Medicare beneficiaries and USD 450 million in annual reimbursement. A new Transitional Coverage for Emerging Technologies rule promises provisional Medicare payment within six months of FDA clearance, compressing the commercialization gap that once slowed uptake. Thirty-five state Medicaid programs now pool risk under the Cell and Gene Therapy Access Model, collectively funding treatments priced above USD 2 million for the treatment of sickle-cell disease. China's regulator approved six domestic CAR-T products in 2024, priced 60% below Western benchmarks, catalyzing adoption across 18 provincial hospitals.
High Therapy Cost & Limited Payer Coverage
Autologous CAR-T products are listed at USD 373,000-515,000, and total care can reach USD 1.2 million once hospitalization and adverse-event management are factored in. These costs, which 40% of U.S. commercial insurers rejected in 2024 due to concerns about patient churn, are high. Hemophilia gene therapies, for USD 3.5 million, require a decade-long amortization, a commitment that many payers view as risky, given the limited durability data. Medicaid prior-authorization rules in 15 U.S. states mandate failure of two earlier regimens, delaying access by four to six months, and excluding patients with deteriorating conditions. In emerging markets, out-of-pocket expenses exceed annual household income by over ten times, restricting uptake to a narrow, affluent cohort. While outcome-based contracts that rebate 50-80% of price upon non-response mitigate payer risk, they introduce revenue volatility that complicates fundraising, as shown by Bluebird Bio's discounted USD 450 million cash call in 2024.
Other drivers and restraints analyzed in the detailed report include:
- Advances in Stem-Cell Bioprocessing Scalability
- AI-Enabled Closed-System Manufacturing Cuts Cost of Goods
- Multi-Jurisdiction Regulatory Complexity
For complete list of drivers and restraints, kindly check the Table Of Contents.
Segment Analysis
Gene therapy, the fastest-advancing product type, is projected to log a 20.73% CAGR through 2031, driven by viral-vector intensification that increased AAV titers fourfold at Lonza's Houston campus in 2025. Cell therapy still dominates revenue, capturing 47.81% in 2025 thanks to 18,000 patients treated with commercial CAR-T products that year. Allogeneic CAR-T platforms in late-phase trials promise 48-hour manufacturing cycles, down from two weeks, positioning off-the-shelf products to erode the market share of autologous products. Platelet-rich plasma remains a niche but profitable option, with 22% of U.S. insurers reimbursing orthopedic injections.
Cell therapy's near-term growth hinges on label expansions into earlier-line hematologic settings and the first solid-tumor approval achieved in 2024, while stem-cell subsegments benefit from Japan's iPSC scale-up initiative. Gene-therapy pipelines are diversifying from hemophilia and retinal disorders into neurodegeneration and metabolic diseases, thanks to platform manufacturing guidance that reduces the number of validation steps. Tissue-engineering firms pursue modular scaffolds that accept CRISPR-edited cells, creating hybrid products that blur traditional segment boundaries in the regenerative medicine market. Together, these dynamics maintain robust investment across modalities, even as gene therapy outpaces the field in terms of velocity.
Neurological disorders are projected to grow at a 22.08% CAGR, the fastest therapeutic rate, propelled by AAV-GDNF vectors in Phase III Parkinson's trials and by Bluebird Bio's broader U.S. coverage for Lenti-D in cerebral adrenoleukodystrophy. Oncology remains the revenue anchor, accounting for 34.52% of 2025 sales; however, its growth moderates as hematologic indications saturate and solid-tumor biology poses immunosuppressive barriers. Musculoskeletal segments expand steadily on rising osteoarthritis prevalence, while wound-care revenues accelerate following Affinity's commercial launch.
Oncology's next leg of growth hinges on tumor-microenvironment modulators and dual-target CAR architectures aimed at sarcoma and glioblastoma. In neurology, real-world durability data will determine payer acceptance of high-priced one-time therapies versus chronic small-molecule regimens. Cardiovascular ventures pivot to allogeneic mesenchymal cells that integrate with mechanical devices, pursuing adjunct indications rather than standalone cures. Collectively, therapeutic diversification insulates the overall regenerative medicine market growth from the volatility of single indications.
Complete Report Scope:
- By Product Type
- Cell Therapy
- Autologous
- Allogeneic
- Stem Cell Therapy
- Embryonic Stem Cell
- Adult Stem Cell
- Induced Pluripotent Stem Cell
- Gene Therapy
- Viral Vector-based
- Non-viral Vector-based
- Tissue Engineering
- Scaffolds
- Biomaterials
- Engineered Tissue Constructs
- Platelet-Rich Plasma
- Cell Therapy
- By Therapeutic
- Oncology
- Musculoskeletal Disorders
- Wound Care & Dermatology
- Cardiovascular Diseases
- Neurology
- Ophthalmology
- Other Therapeutics
- By Material
- Synthetic Materials
- Biodegradable Polymers
- Hydrogel Materials
- Artificial Vascular Graft Materials
- Biologically Derived Materials
- Collagen
- Xenogeneic Materials
- Genetically Engineered Materials
- DNA Vectors
- 3-D Polymer Technology
- Pharmaceuticals (Small Molecule & Biologic)
- Synthetic Materials
- By End User
- Hospitals
- Specialty Clinics
- Academic & Research Institutes
- Other End Users
- By Geography
- North America
- United States
- Canada
- Mexico
- Europe
- Germany
- United Kingdom
- France
- Italy
- Spain
- Rest of Europe
- Asia-Pacific
- China
- Japan
- India
- Australia
- South Korea
- Rest of Asia-Pacific
- Middle East & Africa
- GCC
- South Africa
- Rest of Middle East & Africa
- South America
- Brazil
- Argentina
- Rest of South America
- North America
Geography Analysis
North America captured 44.16% of the 2025 revenue, supported by CMS rules that reimburse CAR-T for multiple lines of hematologic cancers and by the Transitional Coverage for Emerging Technologies pathway, which guarantees provisional payment within six months of FDA approval. Outcome-based contracts adopted by 22 health systems mitigate budget impact and foster broader patient access. Canada negotiated 40% pricing concessions through volume commitments, while Mexico granted two CAR-T approvals but faces affordability constraints due to out-of-pocket costs exceeding USD 200,000.
The Asia-Pacific, the fastest-growing region at a 23.76% CAGR, benefited from six domestic CAR-T approvals in China, priced at CNY 1.2 million (USD 165,000), accelerating adoption across 18 provincial hospitals. Japan's conditional approvals of four iPSC-derived therapies shorten timelines by three years, and India's 18-month Phase I-II path wooed USD 2.1 billion in foreign direct investment to Hyderabad and Bengaluru CDMO clusters. Singapore's 90-day review rule draws high-value manufacturing into Tuas Biomedical Park, while South Korea's lower CAR-T production costs unlock export opportunities to Southeast Asia.
Europe held 22.8% of 2025 revenue, underpinned by conditional Lenmeldy approval and national outcome-based contracts that tied reimbursement to six-month remission rates. The United Kingdom's expanded Early Access to Medicines Scheme brings forward revenue by 18 months, and Germany's rebate model spurs value-based competition among suppliers. Italy and Spain capped gene-therapy expenditures via managed-entry agreements that still provide full access to pediatric indications. In the Middle East and Africa, sandbox incentives account for 4.6% of revenue, with reliance on these incentives being particularly notable in the UAE, and limited approvals are available in South Africa. Meanwhile, South America's 3.9% share is concentrated in Brazil's high-complexity centers due to cost barriers.
Overall, the regenerative medicine market exhibits regional divergence, with reimbursement depth driving growth in North America, cost innovation fueling growth in the Asia-Pacific, and managed-entry agreements moderating expansion in Europe. Supply-chain localization - AAV suites in China, iPSC factories in Japan, and bio-printing hubs in the United States - further anchor production to the fastest-growing demand centers.
- AlloSource
- Anterogen Co., Ltd.
- Athersys, Inc.
- bluebird bio
- Bristol-Myers Squibb
- Baxter
- CORESTEM Inc.
- CRISPR Therapeutic
- Gilead Sciences
- Humacyte
- Integra LifeSciences
- Lonza Group
- Medtronic
- Mesoblast Limited
- MiMedx Group
- Novartis
- Organogenesis
- Osiris Therapeutics
- Rocket Pharmaceuticals
- Smiths Group
- Stryker
- Takeda Pharmaceutical Co.
- Vericel
Additional Benefits:
- The market estimate (ME) sheet in Excel format
- 3 months of analyst support
TABLE OF CONTENTS
1 Introduction
- 1.1 Study Assumptions & Market Definition
- 1.2 Scope of the Study
2 Research Methodology
3 Executive Summary
4 Market Landscape
- 4.1 Market Overview
- 4.2 Market Drivers
- 4.2.1 Rising Chronic Disease Burden
- 4.2.2 Accelerating Approvals & Reimbursement of Cell/Gene Therapies
- 4.2.3 Advances in Stem-Cell Bioprocessing Scalability
- 4.2.4 AI-Enabled Closed-System Manufacturing Cuts Cost of Goods
- 4.2.5 Regulatory Sandboxes Attracting FDI
- 4.2.6 Battlefield Bioprinting Spin-Offs for Civilian Trauma Care
- 4.3 Market Restraints
- 4.3.1 High Therapy Cost & Limited Payer Coverage
- 4.3.2 Multi-Jurisdiction Regulatory Complexity
- 4.3.3 Viral-Vector Supply Bottlenecks
- 4.3.4 Non-Biologic Molecular Alternatives Shrinking Addressable TAM
- 4.4 Value / Supply-Chain Analysis
- 4.5 Regulatory Landscape
- 4.6 Technological Outlook
- 4.7 Porter's Five Forces Analysis
- 4.7.1 Threat of New Entrants
- 4.7.2 Bargaining Power of Buyers
- 4.7.3 Bargaining Power of Suppliers
- 4.7.4 Threat of Substitutes
- 4.7.5 Competitive Rivalry
5 Market Size & Growth Forecasts
- 5.1 By Product Type
- 5.1.1 Cell Therapy
- 5.1.1.1 Autologous
- 5.1.1.2 Allogeneic
- 5.1.1.3 Stem Cell Therapy
- 5.1.1.3.1 Embryonic Stem Cell
- 5.1.1.3.2 Adult Stem Cell
- 5.1.1.3.3 Induced Pluripotent Stem Cell
- 5.1.2 Gene Therapy
- 5.1.2.1 Viral Vector-based
- 5.1.2.2 Non-viral Vector-based
- 5.1.3 Tissue Engineering
- 5.1.3.1 Scaffolds
- 5.1.3.2 Biomaterials
- 5.1.3.3 Engineered Tissue Constructs
- 5.1.4 Platelet-Rich Plasma
- 5.1.1 Cell Therapy
- 5.2 By Therapeutic
- 5.2.1 Oncology
- 5.2.2 Musculoskeletal Disorders
- 5.2.3 Wound Care & Dermatology
- 5.2.4 Cardiovascular Diseases
- 5.2.5 Neurology
- 5.2.6 Ophthalmology
- 5.2.7 Other Therapeutics
- 5.3 By Material
- 5.3.1 Synthetic Materials
- 5.3.1.1 Biodegradable Polymers
- 5.3.1.2 Hydrogel Materials
- 5.3.1.3 Artificial Vascular Graft Materials
- 5.3.2 Biologically Derived Materials
- 5.3.2.1 Collagen
- 5.3.2.2 Xenogeneic Materials
- 5.3.3 Genetically Engineered Materials
- 5.3.3.1 DNA Vectors
- 5.3.3.2 3-D Polymer Technology
- 5.3.4 Pharmaceuticals (Small Molecule & Biologic)
- 5.3.1 Synthetic Materials
- 5.4 By End User
- 5.4.1 Hospitals
- 5.4.2 Specialty Clinics
- 5.4.3 Academic & Research Institutes
- 5.4.4 Other End Users
- 5.5 By Geography
- 5.5.1 North America
- 5.5.1.1 United States
- 5.5.1.2 Canada
- 5.5.1.3 Mexico
- 5.5.2 Europe
- 5.5.2.1 Germany
- 5.5.2.2 United Kingdom
- 5.5.2.3 France
- 5.5.2.4 Italy
- 5.5.2.5 Spain
- 5.5.2.6 Rest of Europe
- 5.5.3 Asia-Pacific
- 5.5.3.1 China
- 5.5.3.2 Japan
- 5.5.3.3 India
- 5.5.3.4 Australia
- 5.5.3.5 South Korea
- 5.5.3.6 Rest of Asia-Pacific
- 5.5.4 Middle East & Africa
- 5.5.4.1 GCC
- 5.5.4.2 South Africa
- 5.5.4.3 Rest of Middle East & Africa
- 5.5.5 South America
- 5.5.5.1 Brazil
- 5.5.5.2 Argentina
- 5.5.5.3 Rest of South America
- 5.5.1 North America
6 Competitive Landscape
- 6.1 Market Concentration
- 6.2 Market Share Analysis
- 6.3 Company Profiles (includes Global level Overview, Market-level Overview, Core Segments, Financials, Strategic Information, Market Rank/Share, Products & Services, Recent Developments)
- 6.3.1 AlloSource
- 6.3.2 Anterogen Co., Ltd.
- 6.3.3 Athersys, Inc.
- 6.3.4 bluebird bio
- 6.3.5 Bristol-Myers Squibb
- 6.3.6 Baxter International Inc.
- 6.3.7 CORESTEM Inc.
- 6.3.8 CRISPR Therapeutics
- 6.3.9 Gilead Sciences (Kite Pharma)
- 6.3.10 Humacyte Inc.
- 6.3.11 Integra LifeSciences Holdings Corporation
- 6.3.12 Lonza Group
- 6.3.13 Medtronic
- 6.3.14 Mesoblast Limited
- 6.3.15 MiMedx Group
- 6.3.16 Novartis AG
- 6.3.17 Organogenesis Holdings Inc.
- 6.3.18 Osiris Therapeutics
- 6.3.19 Rocket Pharmaceuticals
- 6.3.20 Smith & Nephew plc
- 6.3.21 Stryker Corporation
- 6.3.22 Takeda Pharmaceutical Co.
- 6.3.23 Vericel Corporation
7 Market Opportunities & Future Outlook
- 7.1 White-space & Unmet-need Assessment


