

|
시장보고서
상품코드
2113998
주택용 배터리 : 시장 점유율 분석, 업계 동향과 통계, 성장 예측(2026-2031년)Residential Battery - Market Share Analysis, Industry Trends & Statistics, Growth Forecasts (2026 - 2031) |
||||||
 Mordor Intelligence
Mordor Intelligence에 따르면 주택용 배터리 시장 규모는 2026년에 260억 2,000만 달러로 추정되고 있으며, 예측 기간(2026-2031년)에 CAGR 17.36%로 확대하며, 2031년에는 579억 3,000만 달러에 달할 것으로 전망되고 있습니다.
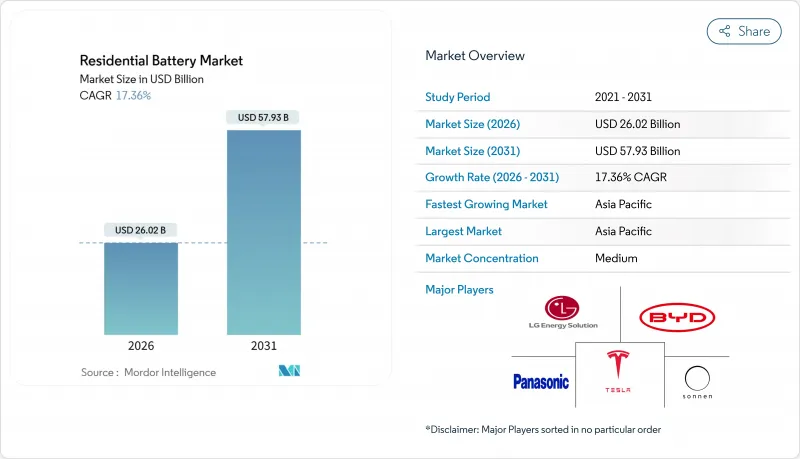
이 보고서는 배터리 유형(리튬이온, 납축전지, 플로우 배터리, 나트륨이온 배터리 및 니켈계 배터리), 용도(자가 소비·백업, 가상발전소/그리드 서비스, 오프그리드/농촌 전기화),판매 채널(소비자 직판 및 설치 업체/판매 대리점 주도), 지역(북미, 유럽, 아시아태평양, 남미, 중동 및 아프리카)별로 분류되어 있습니다.
전 세계 가정용 배터리 시장의 동향 및 인사이트
독일 및 호주에서 옥상 태양광발전과 배터리 병설 의무화가 급증
독일의 KfW 442는 2024년에 태양광발전 및 배터리 세트 도입에 102억 유로(111억 달러)를 배정하여, 10kWh 시스템의 순비용을 약 25% 절감하고 투자 회수 기간을 12년 7년으로 단축했습니다. 호주의 남호주주 VPP(가상발전소)와 뉴사우스웨일스주의 피크 수요 대응 제도를 합치면, 배터리 초기 비용의 15%-20%를 3년 이내에 회수할 수 있습니다. 이러한 인센티브 덕분에 배터리는 단순한 선택적 복원력 툴에서 수익을 창출하는 전력망 자산으로 전환되고 있으며, 오스트리아와 네덜란드에서는 이미 이 모델이 도입되었습니다. 독일 연방망청(Bundesnetzagentur)에 따르면 계통 서비스용 배터리는 태양광발전만 사용하는 시스템에 비해 40% 더 높은 고정가격임베디드제도(FIT) 혜택을 받을 수 있으므로 설치 업체들은 양방향 인버터의 표준화를 추진하고 있습니다. 그 결과, 바이에른주의 설치 업체에 따르면 배터리 설치율은 2023년 38%에서 2025년에는 71%로 상승할 것으로 보고되고 있으며, 이는 가정용 배터리 시장에서 결정적인 전환점이 되고 있습니다.
미국 인플레이션 감축법(Inflation Reduction Act)에 따른 배터리 30% 투자세액공제(ITC) 연장
미국 국세청(IRS)은 2023년에 연장된 30% 투자 세액 공제(ITC)에 따라 태양광발전 시스템과 결합된 장치를 제외한 독립형 축전지에 관한 4만 8,840건의 신청을 처리했습니다. 2032년까지 세액 공제가 확정됨에 따라 테슬라 등 제조사들은 2024년 4분기까지 네바다주 기가팩토리에서 ‘파워월 3(Powerwall 3)’의 연간 생산량을 50만 대 규모로 확대했습니다. 제네락(Genelac)사는 2024년 3분기에 1억 5,700만 달러의 에너지 저장 관련 매출을 기록하여 전년 동기 대비 76% 급증했습니다. 이러한 성장은 ITC(투자세액공제) 대상인 PWRcell 시스템 덕분으로 분석됩니다. 이 독립적인 세액 공제 덕분에 옥상 태양광발전보다 백업 전원을 선호하는 고위도 지역의 주택 소유자들 사이에서 수요가 촉진되고 있습니다. 한편, 캐나다 온타리오주와 브리티시컬럼비아주는 미국의 생산 확대에 발맞춰 20%-25%의 매칭 리베이트 제도를 도입했습니다. 그 결과, 주택용 배터리 시장의 설치 지역이 더욱 광범위하게 확대되면서 생산 주기와 재고 계획이 원활해졌습니다.
EU 전역에서 증가하는 계통 연계 및 허가 신청 대기 건수
독일 연방네트워크청(Bundesnetzagentur)에 따르면 2024년 현재 30만 건의 신청이 적체되어 있으며, 승인까지 걸리는 기간의 중앙값은 28주에 달합니다. 배전 사업자들은 바이에른주와 노르트라인베스트팔렌주의 송전선 과부하를 이유로 꼽고 있으며, 변압기 업그레이드를 요구받는 경우가 많아 프로젝트 비용을 상승시키고 있습니다. 스페인과 네덜란드에서도 유사한 정체 현상이 나타나고 있으며, 네덜란드의 사업자인 리안더(Liander)는 2024년 12개 지자체에서 신규 주택용 계통 연계 신청을 일시 중단했습니다. 설치 업체들은 현재 최대 9개월 분의 재고를 보유하고 있으며, 운전 자금 수요가 증가하고 있을 뿐만 아니라, 이익률이 낮은 업체들은 주거용 배터리 시장에서 밀려나고 있습니다.
부문 분석
2025년에는 리튬이온 배터리의 각종 유형이 주택용 배터리 시장에서 72.9%의 점유율을 차지할 것이며, 이 부문에서 LFP로의 전환에 따라 UL 9540A 및 IEC 63056 규격에 기반한 안전 기준 준수가 강화되었습니다. LFP의 6,000-8,000 사이클 수명과 코발트를 포함하지 않는 부품 구성으로 인해 균등화 저장 비용이 절감되므로, LFP 어레이의 주거용 배터리 시장 규모는 2031년까지 꾸준히 확대될 전망입니다. BYD와 LG 에너지 솔루션은 2024년에 주력 제품 라인을 LFP로 전환하여 소방 당국의 배치 기준을 충족하는 동시에 니켈·망간·코발트계 경쟁 제품보다 15% 저렴한 가격을 실현했습니다.
나트륨 이온 배터리나 니켈 리치 배터리는 현재 점유율이 미미하지만, 연평균 성장률(CAGR) 19.4%가 예상되며, 이는 배터리 유형 중 가장 높은 성장률입니다. CATL이 2024년에 발표한 200 Wh/kg의 나트륨 이온 배터리는 리튬을 포함하지 않아 중요 광물 리스크에 대한 헤지 효과가 기대되지만, 전류 밀도의 제한으로 인해 일반적인 케이스에서 팩 용량은 8-10kWh에 그치고 있습니다. 흐름형 배터리의 점유율은 여전히 2% 미만에 머물러 있으며, 며칠 동안 지속되는 농촌 지역의 오프그리드 용도로만 제한되어 있습니다. 또한 가정용 배터리 시장에서 투자 회수 기준이 엄격해짐에 따라 납축전지의 18% 점유율은 감소 추세를 이어가고 있습니다.
지역별 분석
아시아태평양은 2025년에 매출 점유율 53.3%를 차지하며 가정용 배터리 시장을 주도하고 있으며, 2031년까지 연평균 성장률(CAGR) 18.8%로 확대될 전망입니다. 중국만 해도 PylonTech와 Alpha-ESS의 1kWh당 220달러 미만의 LFP 팩에 힘입어, 2024년에 3GWh를 넘는 가정용 에너지 저장 시스템이 도입되었습니다. 일본의 애그리게이터는 2024년 중반까지 8만 대의 배터리를 VPP에 등록하여, 가구당 연간 3만-5만 엔(200-340달러)의 수익을 올리고 있습니다. 한국에서는 재생에너지 인증서(REC)의 배율이 5.5배로 설정됨에 따라 서울 지역의 투자 회수 기간이 7년으로 단축되었습니다. 한편, 호주의 VPP 모델은 피크 발전소 투자를 미루고 있으며, 이 지역 전체에서 주거용 배터리 시장이 정책 주도 하에 탄력을 받고 있음이 부각되고 있습니다.
북미는 2025년에 약 28%의 점유율을 차지했습니다. 미국 국세청(IRS)은 2023년에 4만 8,840건의 독립형 ITC 신청을 기록했으며, 캘리포니아주에서는 NEM 3.0 도입 후 배터리 보급률이 6배로 급증했습니다. 텍사스주도 ERCOT의 실시간 요금 제도의 지원을 받아 2024년에는 25,000가구에 가정용 배터리를 보급하는 성과를 거두었습니다. 캐나다에서는 20%-25%와의 비교적 소극적인 리베이트 제도에도 불구하고 2024년에는 최대 1만 건의 보급 실적을 기록했습니다. 멕시코와 카리브해 지역은 여전히 초기 단계이지만, 초기 시범 사업이 전개되고 있습니다.
유럽은 2025년에 약 16%의 점유율을 차지했습니다. 독일의 KfW 442 보조금(102억 유로)이 도입을 가속화했으나, 계통 연계 대기 줄이 길어지면서 가동 시작까지 걸리는 시간이 늘어나고 있습니다. 영국의 ‘스마트 수출 보증(Smart Export Guarantee)’은 경제성이 낮아 2024년 도입 건수는 고작 1만 5,000건에 그쳤습니다. 스페인에서는 8개 주에서 송전망 연결이 일시 중단되어 수요가 오프그리드 방식으로 전환되고 있습니다. 그럼에도 불구하고 SonnenCommunity와 같은 피어 투 피어(P2P) 모델은 5만 가구에 보급되어, 규제가 분열된 상황에서도 대안적인 수익 경로를 제시하고 있습니다.
남미 및 중동 및 아프리카의 시장 점유율은 합쳐서 3% 미만에 그치고 있지만, 지역별로 급속한 성장을 기록하고 있습니다. 브라질에서는 넷 미터링 제도 개혁을 거쳐 2024년에 도입률이 5%에서 12%로 상승했습니다. 또한 남아프리카공화국에서는 계획 정전 위기를 계기로 도시 지역의 주택 소유자들이 비싼 가격에도 불구하고 테슬라의 ‘Powerwall’과 화웨이의 ‘LUNA2000’을 도입하기 시작했습니다. 걸프협력회의(GCC) 국가들에서는 소매 전기 요금이 저렴하므로 시범 프로그램이 소규모로 계속 진행되고 있습니다.
기타 혜택:
- 엑셀 형식의 시장 예측(ME) 시트
- 3개월간의 애널리스트 지원
자주 묻는 질문
목차
제1장 서론
제2장 조사 방법
제3장 개요
제4장 시장 구도
제5장 시장 규모와 성장 예측
제6장 경쟁 구도
제7장 시장 기회와 향후 전망
KSA 26.08.25According to Mordor Intelligence, the residential battery market size is estimated at USD 26.02 billion in 2026, and is expected to reach USD 57.93 billion by 2031, at a CAGR of 17.36% during the forecast period (2026-2031).
This report is Segmented by Battery Type (Li-Ion, Lead Acid, Flow Batteries, and Sodium-Ion and Nickel-Based), Application (Self-Consumption and Backup, Virtual Power Plant/Grid Services, and Off-Grid/Rural Electrification), Sales Channel (Direct-To-Consumer and Installer/Distributor-Led), and Geography (North America, Europe, Asia-Pacific, South America, and Middle East and Africa).
Global Residential Battery Market Trends and Insights
Surging Rooftop-PV Pairing Mandates in Germany & Australia
Germany's KfW 442 allocated EUR 10.2 billion (USD 11.1 billion) for solar-battery bundles in 2024, lowering the net cost of a 10 kWh system by roughly 25% and shortening payback from 12 to 7 years. Australia's South Australia VPP and New South Wales peak-demand scheme together recoup 15%-20% of the upfront battery cost within three years. These incentives convert batteries from optional resilience tools into revenue-generating grid assets, a template Austria and the Netherlands are already replicating. Germany's Bundesnetzagentur notes grid-service batteries earn feed-in tariffs 40% above solar-only arrays, pushing installers to standardize bidirectional inverters. As a result, Bavarian installers report battery attachment rates rising from 38% in 2023 to 71% in 2025, marking a decisive inflection in the residential battery market.
U.S. Inflation Reduction Act 30% ITC Extension to Batteries
The Internal Revenue Service processed 48,840 standalone battery claims under the extended 30% ITC in 2023, excluding solar-paired units. With credit certainty until 2032, manufacturers such as Tesla ramped Powerwall 3 output to a 500,000-unit annual rate at Gigafactory Nevada by Q4 2024. Generac recorded USD 157 million in Q3 2024 storage revenue, a 76% year-on-year jump, attributing growth to ITC-eligible PWRcell systems. The standalone credit uncorks demand among northern-latitude homeowners who favor backup over rooftop solar, while Canada's Ontario and British Columbia launched 20%-25% matching rebates that piggyback on U.S. volume scaling. Consequently, the residential battery market sees a wider geographic spread of installations, smoothing production cycles and inventory planning.
Rising Grid-connection & Permitting Queues across EU
Germany's Bundesnetzagentur logged a 300,000-application backlog in 2024, stretching median approvals to 28 weeks. Distribution operators cite feeder overloads in Bavaria and North Rhine-Westphalia, often demanding transformer upgrades that inflate project cost. Spain and the Netherlands face similar standstills; Dutch operator Liander paused new residential interconnections in 12 municipalities during 2024. Installers now carry inventory for up to nine months, raising working-capital needs and squeezing thin-margin players out of the residential battery market.
Other drivers and restraints analyzed in the detailed report include:
- California NEM 3.0 Sharpening Self-Consumption Economics
- Japanese FIP Scheme Rewarding Behind-the-Meter VPP Aggregation
- Fire-safety Codes Tightening for Indoor Installations (UL 9540A, IEC 63056)
For complete list of drivers and restraints, kindly check the Table Of Contents.
Segment Analysis
Lithium-ion variants secured 72.9% residential battery market share in 2025, with the segment's pivot toward LFP elevating safety compliance under UL 9540A and IEC 63056 norms. LFP's 6,000-8,000-cycle life and cobalt-free bill of materials reduce levelized storage cost, so the residential battery market size for LFP arrays is set to widen steadily through 2031. BYD and LG Energy Solution transitioned flagship lines to LFP in 2024, undercutting nickel-manganese-cobalt rivals by 15% while meeting fire-marshal spacing codes.
Sodium-ion and nickel-rich chemistries, though holding modest base shares, are slated for a 19.4% CAGR, the swiftest in the battery-type spectrum. CATL's 200 Wh/kg sodium-ion cells, announced in 2024, promise a lithium-free hedge against critical-mineral risk, although current density caps limit packs to 8-10 kWh for typical enclosures. Flow batteries remain below 2% share, reserved for multi-day rural off-grid uses, and lead-acid's 18% share continues its attrition trajectory as the residential battery market tightens payback thresholds.
Complete Report Scope:
- By Battery Type
- Li-ion (LFP, NMC)
- Lead-acid (AGM, GEL)
- Flow Batteries (Vanadium, Zinc-Br)
- Sodium-ion and Nickel-based
- By Application
- Self-Consumption and Backup
- Virtual Power Plant/Grid Services
- Off-Grid/Rural Electrification
- By Sales Channel
- Direct-to-Consumer (E-commerce/OEM)
- Installer/Distributor-Led
- By Geography
- North America
- United States
- Canada
- Mexico
- Europe
- United Kingdom
- Germany
- France
- Spain
- Nordic Countries
- Russia
- Rest of Europe
- Asia-Pacific
- China
- India
- Japan
- South Korea
- ASEAN Countries
- Rest of Asia-Pacific
- South America
- Brazil
- Argentina
- Colombia
- Rest of South America
- Middle East and Africa
- United Arab Emirates
- Saudi Arabia
- Egypt
- South Africa
- Rest of Middle East and Africa
- North America
Geography Analysis
Asia-Pacific dominated the residential battery market size with a 53.3% revenue share in 2025 and is heading for an 18.8% CAGR through 2031. China alone installed more than 3 GWh of household storage in 2024, buoyed by sub-USD 220 /kWh LFP packs from PylonTech and Alpha-ESS. Japan's aggregators enrolled 80,000 batteries into VPPs by mid-2024, earning JPY 30,000-50,000 (USD 200-340) per home annually. South Korea's 5.5X REC multiplier compresses payback to seven years in Seoul, while Australia's VPP model defers peaker-plant investments, underscoring the residential battery market's policy-driven momentum across the region.
North America captured a roughly 28% share in 2025. The IRS recorded 48,840 standalone ITC claims in 2023, and California's battery attachment rate surged sixfold post-NEM 3.0. Texas followed with 25,000 home batteries in 2024, propelled by real-time tariffs from ERCOT. Canada's more modest 20%-25% rebates still yielded up to 10,000 installs in 2024. Mexico and the Caribbean remain nascent but display early pilot activity.
Europe held about a 16% share in 2025. Germany's EUR 10.2 billion KfW 442 subsidy quickened adoption, but grid-connection queues lengthen commissioning times. The U.K.'s Smart Export Guarantee offers softer economics, totaling only 15,000 installs in 2024. Spain's grid moratorium in eight provinces diverts demand to off-grid schemes. Nonetheless, peer-to-peer models such as SonnenCommunity reach 50,000 households, showcasing alternative revenue pathways amid fragmented regulation.
South America and the Middle East & Africa jointly remain under 3% market share but record rapid localized growth. Brazil's attachment rate moved from 5% to 12% in 2024 after net-metering reforms, and South Africa's load-shedding crisis convinced urban homeowners to adopt Tesla Powerwall and Huawei LUNA2000 units despite premium pricing. Gulf Cooperation Council pilot programs continue at a small scale due to low retail tariffs.
- Tesla Inc.
- LG Energy Solution Ltd
- Panasonic Holdings Corp.
- Samsung SDI Co. Ltd
- BYD Co. Ltd
- Sonnen GmbH
- SENEC GmbH
- Enphase Energy Inc.
- SolarEdge Technologies Inc.
- Generac Power Systems Inc.
- Pylon Technologies Co. Ltd
- Eguana Technologies Inc.
- Alpha-ESS Co. Ltd
- Delta Electronics Inc.
- VARTA AG
- Huawei Digital Power Tech Co. Ltd
- FIMER SpA
- Amara Raja Batteries Ltd
- Siemens AG
- Eaton Corporation plc
Additional Benefits:
- The market estimate (ME) sheet in Excel format
- 3 months of analyst support
TABLE OF CONTENTS
1 Introduction
- 1.1 Study Assumptions & Market Definition
- 1.2 Scope of the Study
2 Research Methodology
3 Executive Summary
4 Market Landscape
- 4.1 Market Overview
- 4.2 Market Drivers
- 4.2.1 Surging rooftop-PV pairing mandates in Germany & Australia
- 4.2.2 IRA Tax Credits Catalyze North American Market Transformation
- 4.2.3 California NEM 3.0 sharpening self-consumption economics
- 4.2.4 Japanese FIP scheme rewarding behind-the-meter VPP aggregation
- 4.2.5 South-Korean REC multipliers for residential ESS
- 4.2.6 Dramatic Li-ion $/kWh cost drop below USD 250 for <15 kWh packs
- 4.3 Market Restraints
- 4.3.1 Grid Connection Bottlenecks Threaten European Deployment Targets
- 4.3.2 Evolving Safety Standards Increase Compliance Costs and Complexity
- 4.3.3 Limited second-life battery availability until 2027
- 4.3.4 Li-ion supply-chain exposure to critical-minerals price shocks
- 4.4 Supply-Chain Analysis
- 4.5 Regulatory Outlook
- 4.6 Technological Outlook
- 4.7 Porter's Five Forces
- 4.7.1 Bargaining Power of Suppliers
- 4.7.2 Bargaining Power of Consumers
- 4.7.3 Threat of New Entrants
- 4.7.4 Threat of Substitutes
- 4.7.5 Intensity of Competitive Rivalry
5 Market Size & Growth Forecasts
- 5.1 By Battery Type
- 5.1.1 Li-ion (LFP, NMC)
- 5.1.2 Lead-acid (AGM, GEL)
- 5.1.3 Flow Batteries (Vanadium, Zinc-Br)
- 5.1.4 Sodium-ion and Nickel-based
- 5.2 By Application
- 5.2.1 Self-Consumption and Backup
- 5.2.2 Virtual Power Plant/Grid Services
- 5.2.3 Off-Grid/Rural Electrification
- 5.3 By Sales Channel
- 5.3.1 Direct-to-Consumer (E-commerce/OEM)
- 5.3.2 Installer/Distributor-Led
- 5.4 By Geography
- 5.4.1 North America
- 5.4.1.1 United States
- 5.4.1.2 Canada
- 5.4.1.3 Mexico
- 5.4.2 Europe
- 5.4.2.1 United Kingdom
- 5.4.2.2 Germany
- 5.4.2.3 France
- 5.4.2.4 Spain
- 5.4.2.5 Nordic Countries
- 5.4.2.6 Russia
- 5.4.2.7 Rest of Europe
- 5.4.3 Asia-Pacific
- 5.4.3.1 China
- 5.4.3.2 India
- 5.4.3.3 Japan
- 5.4.3.4 South Korea
- 5.4.3.5 ASEAN Countries
- 5.4.3.6 Rest of Asia-Pacific
- 5.4.4 South America
- 5.4.4.1 Brazil
- 5.4.4.2 Argentina
- 5.4.4.3 Colombia
- 5.4.4.4 Rest of South America
- 5.4.5 Middle East and Africa
- 5.4.5.1 United Arab Emirates
- 5.4.5.2 Saudi Arabia
- 5.4.5.3 Egypt
- 5.4.5.4 South Africa
- 5.4.5.5 Rest of Middle East and Africa
- 5.4.1 North America
6 Competitive Landscape
- 6.1 Market Concentration
- 6.2 Strategic Moves (M&A, Partnerships, PPAs)
- 6.3 Market Share Analysis (Market Rank/Share for key companies)
- 6.4 Company Profiles (includes Global level Overview, Market level overview, Core Segments, Financials as available, Strategic Information, Products & Services, and Recent Developments)
- 6.4.1 Tesla Inc.
- 6.4.2 LG Energy Solution Ltd
- 6.4.3 Panasonic Holdings Corp.
- 6.4.4 Samsung SDI Co. Ltd
- 6.4.5 BYD Co. Ltd
- 6.4.6 Sonnen GmbH
- 6.4.7 SENEC GmbH
- 6.4.8 Enphase Energy Inc.
- 6.4.9 SolarEdge Technologies Inc.
- 6.4.10 Generac Power Systems Inc.
- 6.4.11 Pylon Technologies Co. Ltd
- 6.4.12 Eguana Technologies Inc.
- 6.4.13 Alpha-ESS Co. Ltd
- 6.4.14 Delta Electronics Inc.
- 6.4.15 VARTA AG
- 6.4.16 Huawei Digital Power Tech Co. Ltd
- 6.4.17 FIMER SpA
- 6.4.18 Amara Raja Batteries Ltd
- 6.4.19 Siemens AG
- 6.4.20 Eaton Corporation plc
7 Market Opportunities & Future Outlook
- 7.1 White-space & Unmet-Need Assessment


