

|
시장보고서
상품코드
2114088
광 스펙트럼 분석기(OSA) : 시장 점유율 분석, 업계 동향 및 통계, 성장 예측(2026-2031년)Optical Spectrum Analyzer (OSA) - Market Share Analysis, Industry Trends & Statistics, Growth Forecasts (2026 - 2031) |
||||||
 Mordor Intelligence
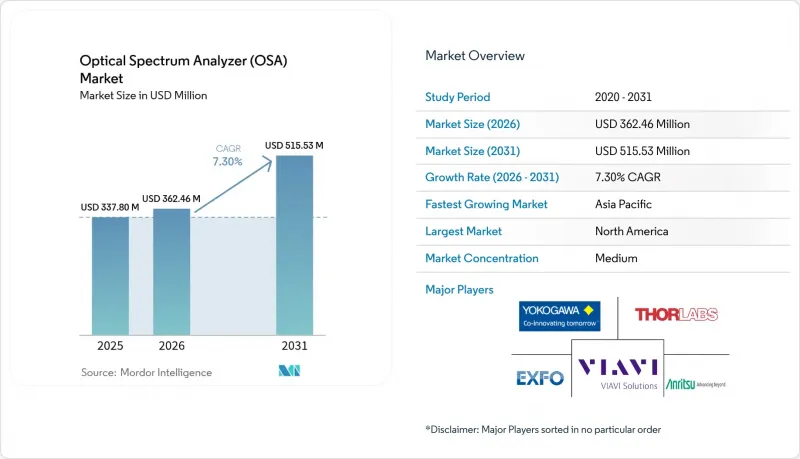
Mordor Intelligence에 의하면, 광학 스펙트럼 analyzer 시장 규모는 2025년 3억 3,780만 달러에서 2026년에는 3억 6,246만 달러에 이르고, 2026-2031년 CAGR 7.30%로 성장을 지속하여 2031년에는 5억 1,553만 달러에 달할 것으로 예측됩니다.
본 보고서는 유형별(휴대용, 핸드헬드, 벤치탑), 모드별(분광기 모드, 파장계 모드), 파장 범위별(400-700 nm(가시광선), 700-1700 nm(근적외선),및 1,700-2,400nm(단파장 적외선))), 최종 사용자 산업(통신 사업자 및 OEM, 소비자용 전자기기 및 포토닉스 디바이스, 기타), 그리고 지역별로 분류되어 있습니다. 시장 예측은 금액(달러) 기준으로 제시되어 있습니다.
세계 광 스펙트럼 분석기(OSA) 시장 동향 및 인사이트
400/800G 코히런트 광 네트워크의 확대
클라우드 사업자들이 데이터센터 간 상호 연결 규모를 확대함에 따라, 400G 및 800G 코히런트 포트의 도입이 급증하고 있습니다. Cignal AI는 400G 플러그인 포트의 도입이 2026년에 정점을 찍은 후, 800G의 채택이 진행될 것으로 예측했습니다. 이러한 고차 변조 방식에는 서브피코미터급의 분해능과 낮은 편광 의존 손실이 요구되어, 고정밀 OSA에 대한 수요를 다시 한 번 끌어올리고 있습니다. 각 벤더들은 이러한 동향에 대응하기 위해 더 빠른 코히런트 수신기, 자동 분산 보상 분석 기능 및 더 넓은 스윕 대역폭을 제품에 통합하고 있습니다. 네트워크가 1.6T 인터페이스로 전환됨에 따라, 더 좁은 채널 간격에서 광 신호 대 잡음비(OSNR)를 검증하기 위해서는 실시간 디지털 신호 처리(DSP) 기능을 갖춘 연속 스윕 측정기가 필수적입니다.
5G/6G 프론트홀 및 백홀 DWDM 링크의 구축
현재 DWDM은 밀집된 도시 지역의 5G 프론트홀 기반이 되고 있으며, 초기 단계의 6G 현장 시험에서는 이미 50GHz 미만의 채널 분해능이 요구되고 있습니다. 조사에 따르면, 모바일 백홀 및 프론트홀 매출은 2030년까지 563억 4,000만 달러에 달할 것으로 예상되며, 이는 전례 없는 규모의 광 테스트 수요를 의미합니다. 1550nm C-밴드 채널용으로 보정된 OSA 외에도, 1310nm P2P 광섬유 및 자유 공간 광학(FSO) 피드를 포괄하는 확장 범위의 측정기가 도입되고 있습니다. 통신 사업자들은 원격 클라우드 대시보드가 통합된 핸드헬드형 설계를 선호하고 있으며, 이를 통해 기지국 가동 시 즉시 스펙트럼 스냅샷을 확보할 수 있게 됩니다. 광 스펙트럼 분석기 시장에서는 수동형 광 네트워크(PON) 파워 미터와의 번들 판매가 증가하고 있어, 원스톱 진단 키트가 형성되고 있습니다.
서브피코미터 분해능을 갖춘 OSA의 고액 초기 투자 및 교정 비용
서브피코미터급 계측기는 대당 10만 달러를 초과하는 경우가 많으며, ±0.03nm의 절대 정확도를 유지하기 위해 정기적인 공장 교정이 필요합니다. 이러한 지속적인 비용은 가격에 민감한 지역의 중소규모 연구소 및 네트워크 사업자에게 장벽이 되고 있습니다. EXFO에 따르면, ±0.5 dB의 전력 정밀도를 유지하려면 일반적으로 전문 업체의 재교정 서비스가 필요합니다. 각 벤더사는 총 소유 비용을 절감하기 위해 구독형 교정 프로그램이나 모듈식 광 카트리지 도입을 시도하고 있지만, 비용을 중시하는 구매자들 사이에서는 여전히 도입이 제한적이어서 100GHz 미만의 채널 간격을 가진 부문의 성장을 저해하고 있습니다.
부문 분석
2025년에는 벤치탑형 장비가 타의 추종을 불허하는 동적 범위와 스윕 분해능 덕분에 총 매출의 69.35%를 차지했습니다. 하이엔드 코히런트 네트워크 구축에 있어서는 도입 전 특성 평가 및 제조 시 품질 관리(QC)를 위해 이러한 실험실 등급 플랫폼이 계속해서 활용되고 있습니다. 반면, 핸드헬드 부문은 연평균 성장률(CAGR) 10.05%로 확대되고 있으며, 이는 전체 광 스펙트럼 분석기 시장의 성장률을 3퍼센트 포인트 가까이 상회하는 수치입니다. MEMS 기반 회절 격자 및 GPU를 이용한 신호 재구성 기술의 발전에 힘입어, 핸드헬드 모델의 광 스펙트럼 분석기 시장 규모는 연평균 성장률(CAGR) 10.05%를 나타낼 것으로 예측됩니다.
휴대용 설계에는 클라우드 네이티브 대시보드, Wi-Fi 백홀, AI를 활용한 이벤트 어노테이션이 통합되어 있어 현장 기술자가 트레이스 데이터를 트러블 티켓 시스템에 직접 업로드할 수 있게 되었습니다. 패턴 인코딩된 개구부를 채택한 계산형 분광기는 무게 1kg 미만의 케이스로 0.1nm의 분해능을 실현하고 있습니다. 또한, 각 벤더들은 견고한 케이스에 벤치탑 수준의 정밀도를 갖춘 하이브리드형 ‘휴대용 벤치’ 측정기를 추진하고 있으며, 미드티어 시장에서 채택이 확대되고 있습니다. 이러한 변화는 광 스펙트럼 분석기 시장 전체에서 분해능, 예산, 기동성 간의 장기적인 균형 조정이 이루어지고 있음을 보여줍니다.
분광기 모드는 C-밴드 및 L-밴드에 걸친 전력 스펙트럼 밀도의 전체적인 상황을 파악할 수 있기 때문에 매출의 64.40%를 차지했습니다. DWDM의 채널 수가 증가함에 따라, 엔지니어들은 부하 상태에서의 드리프트를 감지하기 위해 분광기를 이용한 스윕 측정과 실시간 파장계를 이용한 스냅샷 측정을 결합하는 경우가 늘고 있습니다. 현재 연평균 8.95%의 성장률을 기록하고 있는 파장계 제품은 안정화된 파브리-페로 기준 광원과 고속 포토다이오드 어레이를 결합하여 200밀리초 이내에 ±0.01nm의 정확도를 실현하고 있습니다.
광 채널 턴업에서는 상세한 분광기 분석을 수행하기 전에 먼저 파장계를 통한 점검부터 시작하는 경우가 많으며, 이러한 워크플로가 듀얼 모드 장비의 보급을 뒷받침하고 있습니다. 키사이트가 최근 발표한 테스터는 두 가지 측정 경로를 모두 내장하고 있으며, AI를 활용한 합격/불합격 판정 기능을 추가함으로써 인증 시간을 단축하고 있습니다. 알고리즘 기술을 통해 누락된 검출 소자의 영향을 보정하고, 정밀도를 유지하면서 비용을 절감할 수 있기 때문에 광 스펙트럼 분석기 업계에서는 향후 더욱 심화된 융합이 이루어질 것으로 전망됩니다.
지역별 분석
2025년, 북미는 매출의 32.70%를 차지했습니다. 이는 고밀도 하이퍼스케일 데이터센터 클러스터와 연방 정부의 지원을 받는 양자 연구 허브가 주도한 결과입니다. 800G 트랜시버에 광 계층 규정 준수를 의무화하는 규제로 인해 조달 추세가 더욱 강화되고 있습니다. 또한, Ciena사의 8192 코히런트 라우터 출시는 인라인 분광 검증에 대한 수요를 더욱 촉진하고 있습니다. 지역 제조업체들도 부품 공급 위험을 완화하기 위해 고안된 리쇼어링(국내 복귀) 인센티브의 혜택을 누리고 있습니다.
아시아태평양은 가장 빠른 성장 궤도를 보이고 있으며, 2031년까지 연평균 성장률(CAGR) 8.78%로 성장할 전망입니다. 대규모 5G 구축, 포토닉 칩 파운드리 생산 능력 확대, 그리고 ‘중국 제조 2025’와 같은 국가 프로그램이 고정밀 테스트 장비에 대한 현지 투자를 뒷받침하고 있습니다. 아시아태평양의 광 스펙트럼 분석기 시장 규모는 통신 사업자들이 백홀 네트워크의 고밀도화를 추진하고, 대학들이 PIC(집적 광자 회로) 연구를 확대함에 따라 2031년까지 급속히 성장할 것으로 예측됩니다.
유럽은 협력적인 연구개발(R&D) 자금, 에코디자인 규제, 그리고 네덜란드와 독일의 집적 포토닉스 클러스터를 통해 견고한 입지를 유지하고 있습니다. 엄격한 탄소 감축 목표로 인해 통신 사업자들은 에너지 효율이 뛰어난 코히런트 광 기술을 채택해야 하는 상황에 놓여 있으며, 이를 도입하기 위해서는 치밀한 스펙트럼 균형 조정이 필요합니다. 중동 및 아프리카, 남미에서도 성장세가 가속화되고 있으며, 이들 지역에서는 새로운 광섬유 프로젝트가 구식 구리선 인프라를 비약적으로 대체하고 있습니다. 투자 규모는 작지만, 각 네트워크 단계별로 초기 장비 주문이 대량으로 이루어짐에 따라 전 세계 광 스펙트럼 분석기 시장 규모가 확대되고 있습니다.
기타 혜택:
- 엑셀 형식 시장 예측(ME) 시트
- 3개월간의 애널리스트 지원
자주 묻는 질문
목차
제1장 서론
제2장 조사 방법
제3장 주요 요약
제4장 시장 구도
제5장 시장 규모와 성장 예측
제6장 경쟁 구도
제7장 시장 기회와 향후 전망
LSH 26.08.25According to Mordor Intelligence, the optical spectrum analyzer market size is expected to grow from USD 337.8 million in 2025 to USD 362.46 million in 2026 and is forecast to reach USD 515.53 million by 2031 at 7.30% CAGR over 2026-2031.
This report is Segmented by Type (Portable, Handheld, and Benchtop), Mode Type (Spectrometer Mode, and Wavelength Meter Mode), Wavelength Range (400-700 Nm (Visible), 700-1700 Nm (Near-IR), and 1700-2400 Nm (SWIR)), End-User Industry (Telecommunication Operators and OEMs, Consumer Electronics and Photonics Devices, and More), and Geography. The Market Forecasts are Provided in Terms of Value (USD).
Global Optical Spectrum Analyzer (OSA) Market Trends and Insights
Expansion of 400/800 G Coherent Optical Networks
Installations of 400 G and 800 G coherent ports are rising sharply as cloud operators extend datacenter-interconnect footprints. Cignal AI expects 400 G pluggable port deployments to peak in 2026, followed by 800 G adoption.These higher-order modulation formats require sub-picometer resolution and low polarization-dependent loss, driving renewed demand for high-accuracy OSAs. Vendors are embedding faster coherent receivers, automated dispersion-compensation analytics, and broader sweep bandwidths to keep pace. As networks migrate toward 1.6 T interfaces, continuous-sweep instruments with real-time digital signal processing (DSP) become indispensable for validating optical signal-to-noise ratio (OSNR) under tighter channel spacing.
Roll-out of 5G/6G Fronthaul & Backhaul DWDM Links
DWDM now underpins 5G fronthaul in dense urban clusters, and early 6G field trials already demand channel granularity below 50 GHz. Research predicts mobile backhaul and fronthaul revenue to reach USD 56.34 billion by 2030, implying unprecedented optical-testing volume.OSAs calibrated for 1550 nm C-band channels are being supplemented with extended-range units that cover 1310 nm P2P fiber and free-space optics feeds. Operators favor handheld designs that integrate remote cloud dashboards, enabling immediate spectral snapshots during tower turn-ups. The optical spectrum analyzer market is seeing increased bundling with passive optical network (PON) power meters, creating one-stop diagnostic kits.
High capital and calibration cost of sub-pm resolution OSAs
Sub-picometer instruments often exceed USD 100,000 per unit and demand periodic factory calibration to maintain +-0.03 nm absolute accuracy. These recurring expenses deter smaller labs and network operators in price-sensitive regions. EXFO notes that maintaining +-0.5 dB power accuracy typically requires specialist recalibration services. Vendors are experimenting with subscription-based calibration programs and modular optics cartridges to lower ownership cost, yet adoption remains constrained among cost-conscious buyers, tempering growth in segments below 100 GHz channel spacing.
Other drivers and restraints analyzed in the detailed report include:
- Miniaturisation Enabling Field-Deployable OSAs
- Silicon Photonics and Quantum Optics R&D Funding Upsurge
- Alternative real-time spectrum monitoring (software-defined) solutions
For complete list of drivers and restraints, kindly check the Table Of Contents.
Segment Analysis
Benchtop units contributed to 69.35% of total revenue, in 2025, thanks to unmatched dynamic range and sweep resolution. High-end coherent network rollouts continue to rely on these laboratory-grade platforms for pre-deployment characterization and manufacturing QC. Yet the handheld segment is expanding at a 10.05% CAGR, nearly three percentage points above the overall optical spectrum analyzer market. The optical spectrum analyzer market size for handheld models is forecast to register a CAGR of 10,05%, propelled by MEMS-based gratings and GPU-accelerated signal reconstruction.
Portable designs integrate cloud-native dashboards, Wi-Fi backhaul, and AI-powered event annotation, letting field technicians upload traces directly into trouble-ticket systems. Computational spectrometers using pattern-encoded apertures now achieve 0.1 nm resolution in chassis weighing under 1 kg.Vendors also push hybrid "portable-bench" instruments delivering benchtop-level accuracy in a rugged case, widening mid-tier adoption. These shifts indicate a long-run balancing act between resolution, budget, and mobility across the optical spectrum analyzer market.
Spectrometer mode generated 64.40% of revenue, because it delivers a full view of power spectral density across C- and L-bands. As DWDM channel counts rise, engineers increasingly pair spectrometer sweeps with real-time wavelength-meter snapshots to catch drift under load. Wavelength-meter products, now growing at 8.95% annually, combine stabilized Fabry-Perot references with fast photodiode arrays, producing +-0.01 nm accuracy within 200 ms.
Optical channel turn-up often begins with a wavelength-meter check before deeper spectrometer analysis, a workflow that is fostering dual-mode instruments. Keysight's recent tester embeds both measurement paths, adding AI-driven pass-fail analytics that trim certification time. The optical spectrum analyzer industry is likely to see further convergence, as algorithmic techniques compensate for missing detector elements, compressing cost while maintaining precision.
Complete Report Scope:
- By Type
- Portable
- Handheld
- Benchtop
- By Mode Type
- Spectrometer Mode
- Wavelength Meter Mode
- By Wavelength Range
- 400-700 nm (Visible)
- 700-1700 nm (Near-IR)
- 1700-2400 nm (SWIR)
- By End-user Industry
- Telecommunication Operators and OEMs
- Healthcare and Life-Sciences Instrumentation
- Consumer Electronics and Photonics Devices
- Industrial and Manufacturing QA/QC
- Aerospace and Defence Optoelectronics
- Academic and Government Research Labs
- By Geography
- North America
- United States
- Canada
- Mexico
- Europe
- Germany
- United Kingdom
- France
- Italy
- Spain
- Rest of Europe
- Asia-Pacific
- China
- Japan
- South Korea
- India
- South East Asia
- Rest of Asia-Pacific
- South America
- Brazil
- Rest of South America
- Middle East and Africa
- Middle East
- United Arab Emirates
- Saudi Arabia
- Rest of Middle East
- Africa
- South Africa
- Rest of Africa
- Middle East
- North America
Geography Analysis
North America contributed 32.70% of revenue in 2025, anchored by dense hyperscale datacenter clusters and federally backed quantum-research hubs. Regulatory mandates that embed optical-layer compliance in 800 G transceivers reinforce procurement momentum, while Ciena's 8192 coherent router launch further stimulates demand for inline spectral verification. Regional manufacturers also benefit from reshoring incentives designed to de-risk component supply.
Asia Pacific shows the fastest trajectory, advancing at an 8.78% CAGR to 2031. Massive 5G rollouts, rising photonic-chip foundry capacity, and national programs such as "Made in China 2025" are propelling local spending on high-precision test gear. The optical spectrum analyzer market size for Asia Pacific is projected to grow rapidly by 2031 as carriers densify backhaul networks and universities escalate PIC research.
Europe maintains strong standing through concerted R&D funding, eco-design regulations, and integrated photonics clusters in the Netherlands and Germany. Strict carbon-reduction goals push operators to adopt energy-efficient coherent optics, a move that requires meticulous spectral balancing during deployment. Momentum also builds in the Middle East, Africa, and South America, where greenfield fiber projects leapfrog older copper infrastructure. While spending is smaller, high initial equipment orders accompany each network phase, expanding the global optical spectrum analyzer market footprint.
- Yokogawa Test and Measurement Corp.
- Keysight Technologies Inc.
- VIAVI Solutions Inc.
- EXFO Inc.
- Anritsu Corp.
- Thorlabs Inc.
- Coherent (II-VI Inc.)
- Luna Innovations Inc.
- Quantifi Photonics Ltd.
- Apex Technologies
- Aragon Photonics Labs
- ID Photonics GmbH
- VeEX Inc.
- Timbercon Inc.
- Optoplex Corp.
- AMS Technologies AG
- Bristol Instruments Inc.
- Advanced Photonix (Luna)
- Finisar Corp.
- Spectris PLC
Additional Benefits:
- The market estimate (ME) sheet in Excel format
- 3 months of analyst support
TABLE OF CONTENTS
1 INTRODUCTION
- 1.1 Study Assumptions and Market Definition
- 1.2 Scope of the Study
2 RESEARCH METHODOLOGY
3 EXECUTIVE SUMMARY
4 MARKET LANDSCAPE
- 4.1 Market Overview
- 4.2 Market Drivers
- 4.2.1 Expansion of 400/800 G Coherent Optical Networks
- 4.2.2 Roll-out of 5G/6G Fronthaul and Backhaul DWDM Links
- 4.2.3 Miniaturisation Enabling Field-Deployable OSAs
- 4.2.4 Silicon Photonics and Quantum Optics R&D Funding Upsurge
- 4.2.5 Mandatory Optical-Layer Compliance in Data-Centre Transceivers (United States and EU)
- 4.3 Market Restraints
- 4.3.1 High Capital and Calibration Cost of Sub-pm Resolution OSAs
- 4.3.2 Performance Limits of Handheld Units for Coherent Systems
- 4.3.3 Alternative Real-time Spectrum Monitoring (SWI-based) Solutions
- 4.3.4 Tariff-Driven Photonic Component Supply-Chain Volatility
- 4.4 Industry Ecosystem Analysis
- 4.5 Technological Outlook
- 4.6 Porter's Five Forces Analysis
- 4.6.1 Threat of New Entrants
- 4.6.2 Bargaining Power of Buyers
- 4.6.3 Bargaining Power of Suppliers
- 4.6.4 Threat of Substitutes
- 4.6.5 Intensity of Rivalry
5 MARKET SIZE AND GROWTH FORECASTS (VALUES)
- 5.1 By Type
- 5.1.1 Portable
- 5.1.2 Handheld
- 5.1.3 Benchtop
- 5.2 By Mode Type
- 5.2.1 Spectrometer Mode
- 5.2.2 Wavelength Meter Mode
- 5.3 By Wavelength Range
- 5.3.1 400-700 nm (Visible)
- 5.3.2 700-1700 nm (Near-IR)
- 5.3.3 1700-2400 nm (SWIR)
- 5.4 By End-user Industry
- 5.4.1 Telecommunication Operators and OEMs
- 5.4.2 Healthcare and Life-Sciences Instrumentation
- 5.4.3 Consumer Electronics and Photonics Devices
- 5.4.4 Industrial and Manufacturing QA/QC
- 5.4.5 Aerospace and Defence Optoelectronics
- 5.4.6 Academic and Government Research Labs
- 5.5 By Geography
- 5.5.1 North America
- 5.5.1.1 United States
- 5.5.1.2 Canada
- 5.5.1.3 Mexico
- 5.5.2 Europe
- 5.5.2.1 Germany
- 5.5.2.2 United Kingdom
- 5.5.2.3 France
- 5.5.2.4 Italy
- 5.5.2.5 Spain
- 5.5.2.6 Rest of Europe
- 5.5.3 Asia-Pacific
- 5.5.3.1 China
- 5.5.3.2 Japan
- 5.5.3.3 South Korea
- 5.5.3.4 India
- 5.5.3.5 South East Asia
- 5.5.3.6 Rest of Asia-Pacific
- 5.5.4 South America
- 5.5.4.1 Brazil
- 5.5.4.2 Rest of South America
- 5.5.5 Middle East and Africa
- 5.5.5.1 Middle East
- 5.5.5.1.1 United Arab Emirates
- 5.5.5.1.2 Saudi Arabia
- 5.5.5.1.3 Rest of Middle East
- 5.5.5.2 Africa
- 5.5.5.2.1 South Africa
- 5.5.5.2.2 Rest of Africa
- 5.5.5.1 Middle East
- 5.5.1 North America
6 COMPETITIVE LANDSCAPE
- 6.1 Market Concentration
- 6.2 Strategic Moves
- 6.3 Market Share Analysis
- 6.4 Company Profiles (includes Global level Overview, Market level overview, Core Segments, Financials as available, Strategic Information, Market Rank/Share for key companies, Products and Services, and Recent Developments)
- 6.4.1 Yokogawa Test and Measurement Corp.
- 6.4.2 Keysight Technologies Inc.
- 6.4.3 VIAVI Solutions Inc.
- 6.4.4 EXFO Inc.
- 6.4.5 Anritsu Corp.
- 6.4.6 Thorlabs Inc.
- 6.4.7 Coherent (II-VI Inc.)
- 6.4.8 Luna Innovations Inc.
- 6.4.9 Quantifi Photonics Ltd.
- 6.4.10 Apex Technologies
- 6.4.11 Aragon Photonics Labs
- 6.4.12 ID Photonics GmbH
- 6.4.13 VeEX Inc.
- 6.4.14 Timbercon Inc.
- 6.4.15 Optoplex Corp.
- 6.4.16 AMS Technologies AG
- 6.4.17 Bristol Instruments Inc.
- 6.4.18 Advanced Photonix (Luna)
- 6.4.19 Finisar Corp.
- 6.4.20 Spectris PLC
7 MARKET OPPORTUNITIES AND FUTURE OUTLOOK
- 7.1 White-space and Unmet-Need Assessment


