

|
시장보고서
상품코드
2114581
단클론항체 치료제 시장 : 시장 점유율 분석, 업계 동향 및 통계, 성장 예측(2026-2031년)Monoclonal Antibody Therapeutics - Market Share Analysis, Industry Trends & Statistics, Growth Forecasts (2026 - 2031) |
||||||
 Mordor Intelligence
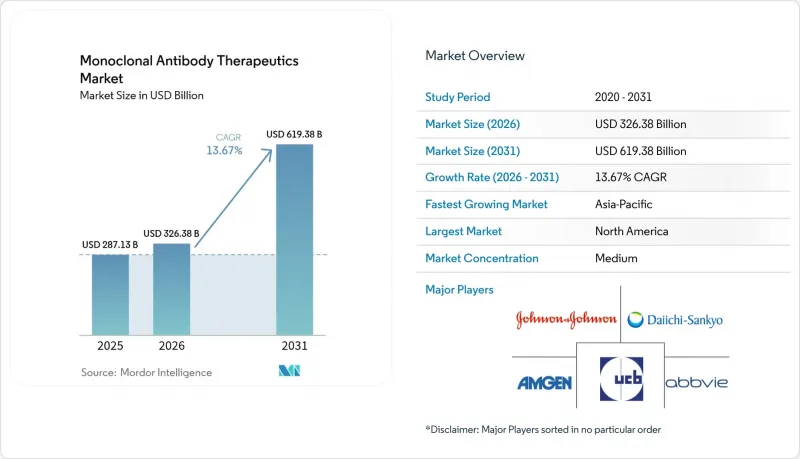
Mordor Intelligence에 의하면, 단클론항체 치료제 시장 규모는 2025년 2,871억 3,000만 달러로 평가되었고, 2026년에는 3,263억 8,000만 달러로 추정되고, 2031년까지 6,193억 8,000만 달러에 이를 것으로 예상되며, 2026-2031년 CAGR 13.67%로 성장할 전망입니다.
본 보고서는 용도별(종양학, 자가면역질환 등), 유래별(인간 등), 생산 플랫폼별(포유류 세포 배양, 미생물 발현 등), 최종 사용자별(병원, 전문 클리닉 등) 및 지역별(북미, 유럽, 아시아태평양, 중동 및 아프리카, 남미)로 분류되어 있습니다. 시장 전망은 금액(달러) 기준으로 제시되어 있습니다.
세계의 단클론항체 치료제 시장 동향 및 인사이트
전 세계적으로 증가하는 암 및 자가면역질환의 질병 부담
2024년에는 암 신규 발병자 수가 2,000만 명에 달할 것으로 예상되며, 자가면역질환 진단 건수는 현재 전 세계적으로 8,000만 명을 초과하고 있습니다. 2025년에는 8종의 새로운 항암 항체가 미국 시장에서 승인되었으며, 생존 기간을 연장하는 한편 환자 1인당 비용을 상승시키는 다단계 치료가 정착되었습니다. 현재의 표준 치료는 PD-1, PD-L1 및 TNF-α 억제제에 의존하고 있으며, 그 유효성과 내약성은 기존의 화학요법을 능가합니다. 자가면역 질환 치료도 IL-23 억제제와 유사한 경로를 따르고 있으며, 만성 질환 환자의 복약 순응도를 높이기 위해 8주마다 투여되고 있습니다. 이러한 거시적인 배경을 고려할 때, 가격의 영향을 고려하기 전부터 단클론항체 치료제 시장은 판매량 확대를 통해 규모를 계속 키워가고 있습니다.
고령 인구 증가
2030년까지 65세 이상 고령자가 세계 인구의 22%를 차지할 것으로 전망됩니다. 고령층에서는 암, 면역 질환 및 노화에 따른 안과 질환의 유병률이 높으며, 이러한 질환의 치료에는 생물학적 조절이 필수적입니다. 가격 규제 움직임이 나타나고 있음에도 불구하고, 2025년 항체 정맥 주사제 관련 메디케어 지출은 480억 달러에 달하며 두 자릿수 성장을 기록했습니다. 편의성은 여전히 최우선으로 여겨지고 있으며, 기존 정맥 주사 제제의 피하 투여 제제는 70세 이상 골다공증 환자들 사이에서 18개월 이내에 35%의 보급률을 달성했습니다. 인구 증가는 단가가 협상을 통해 인하되더라도 단클론항체 치료제 시장 수요를 확실하게 뒷받침하는 요인이 될 것입니다.
고액의 치료비와 보험 급여 관련 과제
1코스당 도매 가격은 8만 달러에서 25만 달러에 달하며, 독일에서는 2025년에 암 치료용 항체의 기준 가격을 22% 인하했습니다. 미국의 ‘인플레이션 억제법’에 따라 3가지 항체가 2026년 리베이트 협상 대상이 되어 정가에서 40% 인하될 가능성이 있어, 제조업체의 수익이 압박받을 우려가 있습니다. 신흥국에서는 더욱 엄격한 가격 상한선이 적용되어 다국적 기업의 수익을 압박하는 한편, 현지에서의 접근성은 확대되고 있습니다. 매출 총이익률을 유지하기 위해 기업들은 엔드포인트가 달성되지 않을 경우 지불자에게 환불하는 ‘가치 기반 계약’에 의존하고 있습니다. 이해관계자들이 예산에 미치는 영향을 면밀히 검토하는 가운데, 성공적인 실세계 데이터 세트가 중요한 근거로 작용하고 있습니다.
부문 분석
2025년 매출액 중 종양학 분야가 46.43%를 차지했으나, 감염병 분야는 정부의 비축 물량 및 팬데믹 보험 프로그램에 힘입어 15.76%라는 가장 높은 연평균 성장률(CAGR)을 나타낼 전망입니다. BARDA(미국 생의학 첨단 연구 개발국)가 호흡기 바이러스 대책에 대한 사전 구매에 12억 달러 이상의 보조금을 지급함에 따라, 감염증 치료용 단클론항체 치료제 시장 규모는 확대될 전망입니다. 정부의 조달은 보험사의 동향에 좌우되지 않고 판매량을 확보할 수 있게 해주므로, 신규 진출기업에게 신뢰할 수 있는 발판이 됩니다.
종양학 분야는 체크포인트 억제 요법의 적응증 확대로 여전히 성장을 이어가고 있지만, 성숙한 종양에서의 포화 상태가 성장 속도를 둔화시키고 있습니다. 자가면역 질환 분야에서는 안정적인 반복 투여가 예상되지만, 안과 분야에서는 투여 간격이 긴 주사제로 인해 바이알 회전율이 제한되어 성장이 둔화되고 있습니다. 신경학 분야는 현재 규모는 작지만, 알츠하이머병에 대한 질병 수정 요법의 성공으로 주목도가 높아지고 있습니다. 각 하위 분야는 단클론항체 치료제 시장을 견인하는 시장 범위의 확대를 여실히 보여주고 있습니다.
휴마나이즈드 항체는 2025년 매출의 49.54%를 차지했으며, 면역원성이 낮고 제조 공정이 확립되어 있어 계속해서 중요한 위치를 차지하고 있습니다. 그럼에도 불구하고, 이중 특이성 항체는 현재 8%에 불과하지만 연평균 성장률(CAGR) 15.89%라는 급속한 성장을 기록하고 있습니다. 이중 표적 작용으로 내성을 회피할 수 있어, 조기에 출시된 제품은 이미 난치성 혈액 질환 분야에서 시장 점유율을 확보하고 있습니다. 현재 1상 임상시험에 진입하는 제품의 62%가 다중 특이성 구조를 가지고 있는 만큼, 이중 특이성 항체의 단클론항체 치료제 시장 내 점유율은 더욱 확대될 전망입니다.
키메라형 제품은 바이오시밀러의 공세로 인해 기세를 잃고 있는 반면, 완전 인간형 항체는 펨브롤리주맙과 같은 블록버스터 제품군을 굳건히 지켜내고 있습니다. 마우스 유래 제품은 단일 투여로 면역 반응의 축적을 피할 수 있는 틈새 영상 진단 용도로 제한되고 있습니다. 이러한 변화는 제조 측면에서의 혁신을 촉구하고 있습니다. 왜냐하면 헤테로다이머를 대규모로 생산할 수 있는 세계 거점은 불과 15곳에 불과하여, 기존 기업들에게 공급 측면에서의 우위를 제공하고 있기 때문입니다.
지역별 분석
북미는 메디케어의 공동 보험 적용과 탄탄한 임상시험 네트워크의 혜택을 받아 2025년 매출의 42.76%를 차지했습니다. 그러나 ‘인플레이션 억제법’에 따라 2026년부터 가격 관리가 도입됨에 따라, 판매 수량에는 영향을 미치지 않겠지만 순이익률은 압박을 받을 전망입니다. 캐나다는 18%에서 25%의 가격 인하를 협상하여 주별 접근성을 확대했습니다. 또한 멕시코는 6종의 항암 항체를 공공 보험 적용 목록에 추가했으나, 1인당 이용률은 낮은 상황입니다.
아시아태평양은 연평균 성장률(CAGR) 14.65%를 기록하며 두드러진 성장 동력으로 자리 잡고 있습니다. 중국은 2025년에 11종의 신규 항체를 승인하고, 13억 명의 주민을 대상으로 하는 국가 보험 급여 목록에 일괄적으로 포함시켰습니다. 인도에서는 저비용 CDMO(위탁 개발·제조) 거점 확충과 수출 친화적인 규제가 맞물려, 현지 기업들이 신흥 지역 전체의 바이오시밀러 수주에서 가치를 창출할 수 있게 되었습니다. 한국의 생산 능력 급증은 단클론항체 치료제 시장을 뒷받침하는 지역적 제조 회랑을 완성하는 것입니다.
2025년 매출에서 유럽이 차지하는 비중은 28%였습니다. 독일, 프랑스, 영국의 의료기술평가(HTA)에 따라 제조업체들은 엄격한 비용 대비 효과 기준을 충족해야 하며, 그 결과 특정 항암제의 경우 평균 22%의 가격 인하가 이루어졌습니다. 자동 대체 규정에 따라 출시 후 1년 이내에 바이오시밀러 시장 점유율이 50% 가까이까지 급속히 확대되고 있습니다. 이러한 역풍에도 불구하고 서유럽은 여전히 조기 출시의 중심지이며, 각국 보험사와의 협상이 타결되면 그 성공이 전 세계적인 보급으로 이어질 것입니다.
기타 혜택 :
- 엑셀 형식 시장 예측(ME) 시트
- 3개월간의 애널리스트 지원
자주 묻는 질문
목차
제1장 서론
제2장 조사 방법
제3장 주요 요약
제4장 시장 구도
제5장 시장 규모 및 성장 예측
제6장 경쟁 구도
제7장 시장 기회 및 향후 전망
AJY 26.08.26According to Mordor Intelligence, the monoclonal antibody therapeutics market size is expected to increase from USD 287.13 billion in 2025 to USD 326.38 billion in 2026 and reach USD 619.38 billion by 2031, growing at a CAGR of 13.67% over 2026-2031.
This report is Segmented by Application (Oncology, Autoimmune Diseases, and More), Source (Human, and More), Production Platform (Mammalian Cell Culture, Microbial Expression, and More), End-User (Hospitals, Specialty Clinics, and More), and Geography (North America, Europe, Asia-Pacific, Middle East & Africa, South America). The Market Forecasts are Provided in Terms of Value (USD).
Global Monoclonal Antibody Therapeutics Market Trends and Insights
Rising Global Disease Burden of Cancer and Autoimmune Disorders
Cancer incidence grew to 20 million new cases in 2024, and autoimmune diagnoses now top 80 million worldwide. Eight novel oncology antibodies cleared the U.S. market in 2025, cementing multi-step sequencing that extends survival but raises per-patient costs. Standard regimens now rely on PD-1, PD-L1, and TNF-alpha blockade that outranks historical chemotherapy in efficacy and tolerability. Autoimmune care follows a similar arc as IL-23 inhibitors, with eight-week dosing to lift adherence among chronic patients. Given this macro backdrop, the monoclonal antibody therapeutics market continues to scale through volume expansion, even before price effects are factored in.
Expanding Geriatric Population Base
Individuals aged 65 and above will represent 22% of global citizens by 2030. Older cohorts carry a higher prevalence of cancers, immune disorders, and age-related ophthalmic conditions that rely on biologic modulation. Medicare spending on infused antibodies reached USD 48 billion in 2025, despite emerging price controls, showing double-digit growth. Convenience remains paramount; subcutaneous versions of legacy infusions achieved 35% penetration among osteoporosis patients aged 70+ within 18 months. The demographic swell safeguards demand for the monoclonal antibody therapeutics market even if unit prices face negotiated reductions.
High Treatment Costs and Reimbursement Challenges
Wholesale prices run from USD 80,000 to USD 250,000 per course, and Germany cut oncology antibody reference prices by 22% in 2025. The U.S. Inflation Reduction Act placed three antibodies into negotiation for 2026 rebates that can slice 40% off list, trimming manufacturer yield. Emerging economies apply even harsher caps which dilute multinational revenue but boost local access. To safeguard gross margin, firms lean on value-based contracts that refund payers if endpoints falter. Successful real-world datasets become crucial evidence as stakeholders scrutinize budget impact.
Other drivers and restraints analyzed in the detailed report include:
- Accelerated Regulatory Approval Pathways for Biologics
- Increasing Preference for Targeted Therapies Over Small Molecules
- Complex Manufacturing and Supply Chain Requirements
For complete list of drivers and restraints, kindly check the Table Of Contents.
Segment Analysis
Oncology accounted for 46.43% of 2025 revenue, yet infectious diseases are forecast to have the fastest 15.76% CAGR, driven by state stockpiles and pandemic insurance programs. The monoclonal antibody therapeutics market size for infectious applications is slated to swell as BARDA awards exceed USD 1.2 billion for pre-purchase of respiratory virus countermeasures. Government procurement secures volumes independent of insurer dynamics, giving newcomers a dependable launchpad.
Oncology still grows due to widening eligibility of checkpoint inhibition, but saturation in mature tumors tempers the pace. Autoimmune conditions add stable repeat dosing, while ophthalmology slows as extended-interval injectables limit vial turns. Neurology remains small today, yet gains mindshare with disease-modifying success in Alzheimer's. Each subfield illustrates the broadening canvas that propels the monoclonal antibody therapeutics market.
Humanized antibodies delivered 49.54% of 2025 sales and stay prominent due to low immunogenicity and known processes. Still, bispecific constructs, though only 8% today, book a rapid 15.89% CAGR. Their dual-target action bypasses resistance, and early launches already seize share in refractory hematologic lines. The monoclonal antibody therapeutics market share for bispecifics is set to widen as 62% of Phase I entrants now carry multi-specific geometry.
Chimeric products lose steam under biosimilar assault, while fully human antibodies defend blockbuster franchises like pembrolizumab. Murine assets fall to niche imaging use where single-dose exposure sidesteps immune buildup. The shift forces manufacturing innovation, since only fifteen global sites can assemble heterodimers at scale, giving incumbents a supply advantage.
Complete Report Scope:
- By Application
- Oncology
- Autoimmune Diseases
- Hematological Diseases
- Infectious Diseases
- Ophthalmology
- Neurology
- Other Applications
- By Source
- Human
- Humanized
- Chimeric
- Murine
- Bispecific / Multispecific
- By Production Platform
- Mammalian Cell Culture (CHO, NS0, HEK-293)
- Microbial Expression (E. Coli, Yeast)
- Transgenic Animals & Plants
- Cell-Free / Continuous Manufacturing
- By End-User
- Hospitals
- Specialty Clinics
- Home-Care / Self-Administration
- Research & Academic Institutes
- Geography
- North America
- United States
- Canada
- Mexico
- Europe
- Germany
- United Kingdom
- France
- Italy
- Spain
- Rest of Europe
- Asia-Pacific
- China
- Japan
- India
- Australia
- South Korea
- Rest of Asia-Pacific
- Middle East & Africa
- GCC
- South Africa
- Rest of Middle East & Africa
- South America
- Brazil
- Argentina
- Rest of South America
- North America
Geography Analysis
North America commanded 42.76% of 2025 revenue, benefiting from Medicare co-insurance coverage and a dense trial network. Yet the Inflation Reduction Act introduces managed pricing from 2026, tightening net yields though not likely dampening volume. Canada negotiated 18% to 25% cuts that widened provincial access, and Mexico listed six oncology antibodies on its public formulary, albeit with lower per-capita utilization.
Asia-Pacific is the standout growth engine at 14.65% CAGR. China approved eleven novel antibodies in 2025 and pooled them into the national reimbursement list that covers 1.3 billion residents. India's low-cost CDMO build-out combines with export-friendly regulation, letting local firms capture value from biosimilar orders across emerging regions. South Korea's capacity surge rounds out a regional manufacturing corridor that underpins the monoclonal antibody therapeutics market.
Europe accounted for 28% of 2025 turnover. Health technology assessments in Germany, France, and the UK force manufacturers to meet strict cost-effectiveness thresholds, prompting 22% average price cuts on select oncology agents. Automatic substitution rules fast-track biosimilar share near 50% within a year of launch. Despite these headwinds, Western Europe remains central for early launches that cascade to global uptake once national payers conclude negotiations.
- Abbvie
- Amgen
- AstraZeneca
- BeiGene
- Boehringer Ingelheim
- Bristol-Myers Squibb
- Daiichi Sankyo
- Eli Lilly and Company
- Roche
- GlaxoSmithKline
- Johnson & Johnson
- Merck
- Merck
- Novartis
- Pfizer
- Regeneron
- Samsung Bioepis
- Sanofi
- Seagen
- UCB
Additional Benefits:
- The market estimate (ME) sheet in Excel format
- 3 months of analyst support
TABLE OF CONTENTS
1 Introduction
- 1.1 Study Assumptions & Market Definition
- 1.2 Scope Of The Study
2 Research Methodology
3 Executive Summary
4 Market Landscape
- 4.1 Market Overview
- 4.2 Market Drivers
- 4.2.1 Rising Global Disease Burden of Cancer And Autoimmune Disorders
- 4.2.2 Expanding Geriatric Population Base
- 4.2.3 Accelerated Regulatory Approval Pathways for Biologics
- 4.2.4 Increasing Preference for Targeted Therapies Over Small Molecules
- 4.2.5 Advancements in Antibody Engineering and Delivery Technologies
- 4.2.6 Growing Biologics Manufacturing Capacity in Emerging Markets
- 4.3 Market Restraints
- 4.3.1 High Treatment Costs and Reimbursement Challenges
- 4.3.2 Complex Manufacturing and Supply Chain Requirements
- 4.3.3 Safety Concerns and Adverse Event Profiles
- 4.3.4 Intensifying Biosimilar Competition Post-Patent Expiries
- 4.4 Value / Supply-Chain Analysis
- 4.5 Regulatory Landscape
- 4.6 Technological Outlook
- 4.7 Porter's Five Forces Analysis
- 4.7.1 Threat Of New Entrants
- 4.7.2 Bargaining Power Of Buyers
- 4.7.3 Bargaining Power Of Suppliers
- 4.7.4 Threat Of Substitutes
- 4.7.5 Competitive Rivalry
5 Market Size & Growth Forecasts (Value, USD)
- 5.1 By Application
- 5.1.1 Oncology
- 5.1.2 Autoimmune Diseases
- 5.1.3 Hematological Diseases
- 5.1.4 Infectious Diseases
- 5.1.5 Ophthalmology
- 5.1.6 Neurology
- 5.1.7 Other Applications
- 5.2 By Source
- 5.2.1 Human
- 5.2.2 Humanized
- 5.2.3 Chimeric
- 5.2.4 Murine
- 5.2.5 Bispecific / Multispecific
- 5.3 By Production Platform
- 5.3.1 Mammalian Cell Culture (CHO, NS0, HEK-293)
- 5.3.2 Microbial Expression (E. Coli, Yeast)
- 5.3.3 Transgenic Animals & Plants
- 5.3.4 Cell-Free / Continuous Manufacturing
- 5.4 By End-User
- 5.4.1 Hospitals
- 5.4.2 Specialty Clinics
- 5.4.3 Home-Care / Self-Administration
- 5.4.4 Research & Academic Institutes
- 5.5 Geography
- 5.5.1 North America
- 5.5.1.1 United States
- 5.5.1.2 Canada
- 5.5.1.3 Mexico
- 5.5.2 Europe
- 5.5.2.1 Germany
- 5.5.2.2 United Kingdom
- 5.5.2.3 France
- 5.5.2.4 Italy
- 5.5.2.5 Spain
- 5.5.2.6 Rest of Europe
- 5.5.3 Asia-Pacific
- 5.5.3.1 China
- 5.5.3.2 Japan
- 5.5.3.3 India
- 5.5.3.4 Australia
- 5.5.3.5 South Korea
- 5.5.3.6 Rest of Asia-Pacific
- 5.5.4 Middle East & Africa
- 5.5.4.1 GCC
- 5.5.4.2 South Africa
- 5.5.4.3 Rest of Middle East & Africa
- 5.5.5 South America
- 5.5.5.1 Brazil
- 5.5.5.2 Argentina
- 5.5.5.3 Rest of South America
- 5.5.1 North America
6 Competitive Landscape
- 6.1 Market Concentration
- 6.2 Market Share Analysis
- 6.3 Company Profiles {(Includes Global Level Overview, Market Level Overview, Core Segments, Financials as Available, Strategic Information, Market Rank/Share for Key Companies, Products & Services, and Recent Developments)}
- 6.3.1 Abbvie Inc
- 6.3.2 Amgen Inc
- 6.3.3 AstraZeneca
- 6.3.4 BeiGene
- 6.3.5 Boehringer Ingelheim
- 6.3.6 Bristol Myers Squibb
- 6.3.7 Daiichi Sankyo
- 6.3.8 Eli Lilly
- 6.3.9 F. Hoffmann-La Roche
- 6.3.10 GSK
- 6.3.11 Johnson & Johnson (Janssen)
- 6.3.12 Merck & Co.
- 6.3.13 Merck KGaA
- 6.3.14 Novartis
- 6.3.15 Pfizer
- 6.3.16 Regeneron
- 6.3.17 Samsung Bioepis
- 6.3.18 Sanofi
- 6.3.19 Seagen
- 6.3.20 UCB S.A., Belgium (UCB Inc)
7 Market Opportunities & Future Outlook
- 7.1 White-Space & Unmet-Need Assessment


