

|
시장보고서
상품코드
2114590
신경과학 시장 : 시장 점유율 분석, 업계 동향 및 통계, 성장 예측(2026-2031년)Neuroscience - Market Share Analysis, Industry Trends & Statistics, Growth Forecasts (2026 - 2031) |
||||||
 Mordor Intelligence
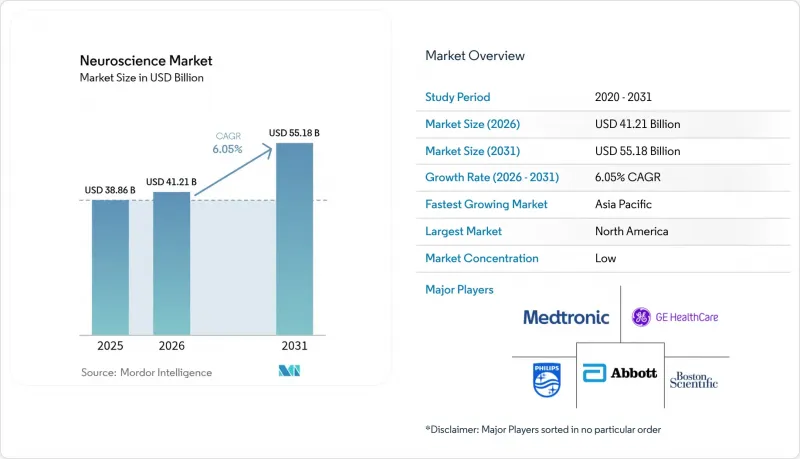
Mordor Intelligence에 의하면, 2026년 신경과학 시장 규모는 412억 1,000만 달러로 추정되고, 2025년 388억 6,000만 달러에서 확대해, 2031년에는 551억 8,000만 달러에 이를 것으로 예측됩니다.
2026-2031년 연평균 성장률(CAGR) 6.05%로 성장할 것으로 전망됩니다.
본 보고서는 제품별(기기, 소모품, 소프트웨어 및 서비스), 기술별(신경 영상 진단, 분자·세포 분석 등), 용도별(연구·학술, 진단 등), 최종 사용자별(병원 및 진료소 등), 지역별(북미 등)로 분류되어 있습니다. 시장 예측은 금액(달러) 기준으로 제시되어 있습니다.
세계의 신경과학 시장 동향 및 인사이트
신경퇴행성 질환 유병률 증가
2024년에는 34억 명이 신경 질환을 앓고 있었으며, 이 수치는 세계 인구의 43.1%에 해당하고, 장애 조정 생명년(DALY)은 4억 4,300만 건에 달했습니다. 질환 유병률은 1990년부터 2024년까지 18.2% 상승했으며, 2050년까지 22% 증가할 것으로 예측되고 있으며, 파킨슨병 사례만으로도 2,520만 건에 달할 것으로 전망됩니다. 현재 AI 기반 시스템은 파킨슨병 진단 정확도에서 96%를 달성하고 있으며, 이러한 첨단 도구가 치료 성과를 향상시키면서 장기 요양 비용을 절감할 수 있음을 보여주고 있습니다. 동아시아와 유럽의 인구 고령화에 따라 조기 진단 및 맞춤형 치료 경로에 대한 수요가 증가하고 있습니다. 의료 시스템 기획 담당자들은 예방 신경학 프로그램을 점점 더 우선시하고 있으며, 공공 및 민간 시설을 막론하고 영상 진단 장비와 자극 요법 장비의 지속적인 도입을 지원하고 있습니다.
고자기장 신경 영상 진단(7 T 이상) 분야의 기술적 도약
초고자기장 MRI는 저자기장에서는 얻을 수 없는 미세 구조에 대한 인사이트를 제공하여, 임상의가 간질 유발 병소나 미세혈관 병변을 더 조기에 식별할 수 있게 해줍니다. FDA 승인을 받은 7T 플랫폼은 현재 북미 및 유럽 전역에서 가동 중이며, 한편 Iseult 11.7T 시스템은 최첨단 연구에서 0.19mm의 해상도를 실현하고 있습니다. 각 벤더사가 자석의 설계와 설치 요건을 개선함에 따라 비용 곡선은 하락하기 시작했습니다. 나트륨 매핑 및 확산 커토시즘 매핑을 포함한 새로운 영상 콘트라스트 및 기능 모드는 뇌졸중, 다발성 경화증, 신경종양학 분야의 감별 진단을 향상시킵니다. 규제 당국은 구체적인 안전 지침을 마련하고 있으며, 이를 통해 임상의의 신뢰도가 높아지고 병원의 조달 주기가 가속화되고 있습니다.
첨단 영상 진단 및 자극 시스템의 막대한 도입 비용
최첨단 3T MRI의 도입 비용은 320만 달러에 달하지만, 7T 플랫폼은 그 금액을 훨씬 초과하여 예산이 제한된 병원에게는 큰 과제가 되고 있습니다. 스캐너의 시간당 이용 요금은 480-835달러이며, 여기에는 유지보수, 헬륨 및 서비스 계약 비용이 포함됩니다. 가격이 약 20만 미 달러인 휴대용 64 mT MRI는 제한된 임상 적응증에만 대응하고 있습니다. 심부 뇌 자극 요법의 이식 수술은 보험 환급 제도가 있음에도 불구하고, 저소득층 환자에게는 여전히 비용이 너무 비싸서 감당하기 어려운 상황이며, 뇌신경외과 의사의 부족으로 대기 기간이 더욱 길어지고 있습니다. 소유 위험을 분산하고 도입을 가속화하기 위해 ‘스캔당 지불’ 계약이나 민관 협력 리스 사업과 같은 혁신적인 조달 모델이 등장하고 있습니다.
부문 분석
2025년에는 의료기기가 신경과학 시장의 48.55%를 차지하며 총 수익의 거의 절반을 창출했습니다. 7T MRI, 적응형 심부 뇌 자극 장치, 고밀도 EEG와 같은 자본 집약적 플랫폼이 조달 예산의 대부분을 차지하고 있으며, 이는 신경과학 시장 규모 확대의 원동력이 되고 있습니다. 소프트웨어 및 서비스 부문은 클라우드 분석, 실시간 시각화 대시보드, 알고리즘-어즈-어-서비스(Algorithm-as-a-Service)와 같은 서비스가 이미 도입된 하드웨어에서 부가가치를 창출함으로써 연평균 성장률(CAGR) 6.11%를 기록하며 가장 빠르게 성장하고 있습니다. 소모품은 분자 분석 및 전기생리학적 검사 실시 건수와 연동되어 안정적인 수요를 유지하고 있습니다.
성과 기반 계약으로의 전환에 따라, 벤더는 소프트웨어 기능과 하드웨어 유지보수를 세트로 제공하는 인센티브를 얻고 있으며, 이를 통해 의료 제공업체의 연간 지출이 평준화되고 있습니다. 2025년에 승인된 메드트로닉(Medtronic)의 ‘BrainSense’ 시스템은 이식형 리드가 파킨슨병 치료용 적응형 제어 소프트웨어로 지속적인 신경 데이터를 스트리밍하는 ‘하드웨어 + 알고리즘’ 모델의 좋은 예입니다. 규제 당국은 현재 뇌 자극 프로그래밍 용도를 위한 전용 분류를 발표하고 있으며, 이를 통해 전문적인 독립 소프트웨어 공급업체 시장 진입이 촉진되고 있습니다. 병원이 통합된 워크플로우를 우선시함에 따라, 수요는 단일 기기에서 데이터 수집, 처리, 원격 추적 관리를 통합한 모듈식 생태계로 이동하고 있습니다.
신경 영상 진단은 2025년 매출의 41.82%를 차지했으며, 더 광범위한 신경과학 시장에서 핵심 모달리티로서의 입지를 확고히 했습니다. 이러한 성장은 7T 스캐너의 임상 적응증 확대, fMRI와 fNIRS의 결합 통합, 그리고 커넥토믹스를 위해 500 mT/m의 강도를 실현하는 전용 그라디언트 시스템의 등장 덕분입니다. 한편, 신경 자극 요법은 운동 장애에 대한 적응형 DBS의 승인 및 우울증에 대한 경두개 자기 자극(TMS)의 적용 범위 확대에 힘입어 연평균 성장률(CAGR) 6.33%라는 가장 빠른 속도로 발전하고 있습니다.
전기생리학 분야에서는 무선 센서의 소형화가 진행되어 3차 의료기관 이외에서도 장기 모니터링이 실용화되고 있습니다. 분자 및 세포 분석을 통해 질환의 근본적인 기전을 추적할 수 있게 되었으며, 영상 진단 및 자극 요법에서 얻어지는 바이오마커를 병용하는 정밀 의학의 임상시험이 촉진되고 있습니다. 표준화 기구는 계속해서 IEC 안전 기준의 정교화를 추진하고 있으며, 이를 통해 의료 시스템 관리자에게는 보다 명확한 지침이 제공되고, 설비 투자 계획에 대한 의사결정이 가속화되고 있습니다.
지역별 분석
북미는 견실한 환급 정책과 FDA의 조기 승인이 기술의 급속한 보급을 촉진한 결과, 2025년에는 매출 점유율 41.90%로 이 분야를 주도했습니다. NIH의 BRAIN 이니셔티브를 통한 연간 4억 달러 규모의 지속적인 자금 지원이 활발한 혁신 파이프라인을 뒷받침하고 있습니다. 의료 제공업체 네트워크에서는 적응형 DBS 및 웨어러블 EEG를 표준 치료 경로에 통합하는 움직임이 가속화되며, 이 지역의 리더십을 강화하고 있습니다.
아시아태평양은 야심 찬 국가 프로그램과 대규모 고령 인구를 배경으로 연평균 성장률(CAGR) 6.97%를 기록하며 성장하고 있습니다. 중국의 뇌-컴퓨터 인터페이스(BCI)에 관한 정책 청사진은 임상시험 가속화와 자본 유입 확대를 뒷받침하고 있습니다. 일본 제조업체들은 로봇 공학 및 영상 진단 분야의 전문 지식을 차세대 자석 설계에 적용하고 있는 반면, 인도는 의료 인프라 예산을 3차 의료 병원에 중점적으로 배분함으로써 사회경제적 계층에 관계없이 시장 접근성을 확대되고 있습니다.
유럽에서는 안전성과 성능에 관한 의무를 법적으로 규정한 EU AI법에 힘입어 균형 잡힌 성장을 유지하고 있으며, 투자자들의 확신이 높아지고 있습니다. 헌팅턴병 치료제 ‘프리도피딘’ 등 신규 치료제에 대한 EMA(유럽의약품청)의 승인은 보완적인 진단 수요를 자극하고 있습니다. 중동 및 아프리카 시장은 여전히 발전 단계에 있지만, 신경외과 의사 부족을 완화하기 위한 국제적인 개발 지원을 받고 있습니다. 현재 저소득 국가의 신경외과 의사 수는 주민 10만 명당 0.12명인 반면, 고소득 국가에서는 2.44명에 달할 전망입니다.
기타 혜택 :
- 엑셀 형식 시장 예측(ME) 시트
- 3개월간의 애널리스트 지원
자주 묻는 질문
목차
제1장 서론
제2장 조사 방법
제3장 주요 요약
제4장 시장 구도
제5장 시장 규모 및 성장 예측
제6장 경쟁 구도
제7장 시장 기회 및 향후 전망
AJY 26.08.26According to Mordor Intelligence, neuroscience market size in 2026 is estimated at USD 41.21 billion, growing from 2025 value of USD 38.86 billion with 2031 projections showing USD 55.18 billion, growing at 6.05% CAGR over 2026-2031.
This report is Segmented by Product (Instruments, Consumables, and Software & Services), Technology (Neuroimaging, Molecular & Cellular Assays, and More), Application (Research & Academic, Diagnostics, and More), End-User (Hospitals & Clinics, and More), and Geography (North America, and More). The Market Forecasts are Provided in Terms of Value (USD).
Global Neuroscience Market Trends and Insights
Rising Prevalence of Neurodegenerative Disorders
Neurological conditions affected 3.4 billion people in 2024, a figure equal to 43.1% of the global population and responsible for 443 million disability-adjusted life years. Disease prevalence climbed 18.2% from 1990 to 2024 and is projected to grow 22% by 2050, with Parkinson's cases alone expected to hit 25.2 million. AI-enhanced systems now reach 96% diagnostic accuracy for Parkinson's, illustrating how advanced tools can lower long-term care costs while improving outcomes. Demographic aging in East Asia and Europe intensifies demand for early-stage diagnostics and individualized care pathways. Health-system planners increasingly prioritize preventive neurology programs, supporting sustained procurement of imaging and stimulation equipment across public and private facilities.
Technological Leaps in High-Field Neuroimaging (7 T +)
Ultra-high field MRI unlocks microstructural insights unattainable at lower strengths, enabling clinicians to locate epileptogenic foci and micro-vascular lesions earlier. FDA-cleared 7 T platforms now operate throughout North America and Europe, while the Iseult 11.7 T system demonstrates 0.19 mm resolution for frontier research. Cost curves are beginning to decline as vendors refine magnet design and site requirements. New imaging contrasts and functional modes-including sodium and diffusion kurtosis mapping-enhance differential diagnosis across stroke, multiple sclerosis, and neuro-oncology. Regulators have issued specific safety guidelines, improving clinician confidence and accelerating hospital procurement cycles.
High Capital Cost of Advanced Imaging & Stimulation Systems
A state-of-the-art 3 T MRI carries acquisition cost near USD 3.2 million, while 7 T platforms exceed that figure substantially, challenging budget-constrained hospitals. Hourly scanner use fees run USD 480-835, reflecting maintenance, helium, and service contracts. Portable 64-mT MRI priced around USD 200,000 addresses only limited clinical indications. Deep brain stimulation implantation remains cost prohibitive for low-income patients despite reimbursement policies, and neurosurgeon shortages aggravate wait times. Innovative procurement models such as pay-per-scan agreements and public-private leasing ventures are emerging to diffuse ownership risk and accelerate adoption.
Other drivers and restraints analyzed in the detailed report include:
- AI-Powered Multimodal Data Integration Platforms
- Miniaturization of neuro-electronics for home monitoring
- Ethical & Regulatory Hurdles Around Invasive Neurotech
For complete list of drivers and restraints, kindly check the Table Of Contents.
Segment Analysis
In 2025 instruments generated almost half of overall revenue by securing 48.55% of neuroscience market share. Capital-intensive platforms such as 7 T MRI, adaptive deep brain stimulators, and high-density EEG dominate procurement budgets and underpin the neuroscience market size expansion trajectory. Software and services rise fastest at 6.11% CAGR as cloud analytics, real-time visualization dashboards, and algorithm-as-a-service offerings unlock incremental value from installed hardware. Consumables sustain steady demand tied to the volume of molecular assays and electrophysiology tests.
A shift toward outcome-based contracts incentivizes vendors to bundle software capabilities with hardware maintenance, smoothing annual spending for providers. Medtronic's BrainSense system, cleared in 2025, illustrates a hardware-plus-algorithm model whereby implanted leads stream continuous neural data to adaptive control software for Parkinson's care. Regulatory agencies now publish dedicated classifications for brain-stimulation programming applications, encouraging specialized independent software vendors. As hospitals prioritize integrated workflows, demand shifts from standalone instruments toward modular ecosystems uniting acquisition, processing, and remote follow-up.
Neuroimaging captured 41.82% of 2025 revenue, cementing its position as the backbone modality within the broader neuroscience market. Growth stems from expanded clinical indications for 7 T scanners, integration of fMRI-fNIRS combos, and availability of specialized gradient systems achieving 500 mT/m strength for connectomics. Neurostimulation, however, is advancing fastest at 6.33% CAGR, buoyed by approvals for adaptive DBS in movement disorders and expanding transcranial magnetic stimulation coverage for depression.
Electrophysiology benefits from wireless sensor miniaturization, making long-term monitoring practical outside tertiary centers. Molecular and cellular assays track underlying disease mechanisms, supporting precision-medicine trials that rely on concurrent imaging- and stimulation-derived biomarkers. Standard-setting bodies continue to refine IEC safety norms, giving health-system administrators clearer guidelines and accelerating capital-planning decisions.
Complete Report Scope:
- By Product
- Instruments
- Consumables (reagents, antibodies, assay kits)
- Software & Services
- By Technology
- Neuroimaging (MRI, PET, CT, MEG)
- Neurostimulation / Neuromodulation
- Electrophysiology (EEG, ECoG, EMG)
- Molecular & Cellular Assays
- By Application
- Research & Academic
- Diagnostics
- Therapeutics Monitoring
- By End-User
- Hospitals & Clinics
- Diagnostic Laboratories
- Pharmaceutical & Biotech Companies
- Academic & Research Institutes
- By Geography
- North America
- United States
- Canada
- Mexico
- Europe
- Germany
- United Kingdom
- France
- Italy
- Rest of Europe
- Asia-Pacific
- China
- India
- Japan
- South Korea
- Australia
- Rest of Asia-Pacific
- South America
- Brazil
- Argentina
- Rest of South America
- Middle East and Africa
- GCC
- South Africa
- Rest of Middle East and Africa
- North America
Geography Analysis
North America led the sector with 41.90% revenue share in 2025 as robust reimbursement policies and early FDA clearances foster rapid technology uptake. Continuous NIH BRAIN Initiative funding of USD 400 million each year sustains a vibrant innovation pipeline. Provider networks increasingly integrate adaptive DBS and wearable EEG into standard care pathways, reinforcing regional leadership.
Asia-Pacific progresses at a 6.97% CAGR thanks to ambitious national programs and a sizeable aging population. China's policy blueprint for brain-computer interfaces underpins accelerated clinical trials and expanding capital inflows. Japanese manufacturers apply robotics and imaging expertise to next-generation magnet design, whereas India channels health-infrastructure allocations to tertiary care hospitals, broadening market access across socioeconomic tiers.
Europe maintains balanced growth supported by the EU AI Act that codifies safety and performance obligations, enhancing investor certainty. EMA approvals for novel therapeutics, such as pridopidine for Huntington's, stimulate complementary diagnostic demand. Middle-East and African markets remain nascent but earn international development support to mitigate neurosurgeon shortages, which currently stand at 0.12 per 100,000 residents in low-income countries versus 2.44 in high-income ones.
- Medtronic
- GE HealthCare Technologies Inc.
- Abbott Laboratories
- Boston Scientific
- Siemens Healthineers
- Koninklijke Philips
- Thermo Fisher Scientific
- Nihon Kohden
- Hitachi
- FUJIFILM
- Bruker
- Carl Zeiss
- Bio-Rad Laboratories
- Revvity
- Compumedics
- Alpha Omega Engineering Ltd.
- Axion BioSystems Inc.
- Blackrock Neurotech
Additional Benefits:
- The market estimate (ME) sheet in Excel format
- 3 months of analyst support
TABLE OF CONTENTS
1 Introduction
- 1.1 Study Assumptions & Market Definition
- 1.2 Scope of the Study
2 Research Methodology
3 Executive Summary
4 Market Landscape
- 4.1 Market Overview
- 4.2 Market Drivers
- 4.2.1 Rising Prevalence Of Neurodegenerative Disorders
- 4.2.2 Technological Leaps In High-Field Neuroimaging (7 T & Above)
- 4.2.3 AI-Powered Multimodal Data Integration Platforms
- 4.2.4 Miniaturization Of Neuro-Electronics For Home Monitoring
- 4.2.5 Brain-Computer Interface (BCI) Commercialization Wave
- 4.2.6 Growing Public & Private R&D Grants In Neuroscience
- 4.3 Market Restraints
- 4.3.1 High Capital Cost Of Advanced Imaging & Stimulation Systems
- 4.3.2 Ethical & Regulatory Hurdles Around Invasive Neurotech
- 4.3.3 Data-Privacy Concerns In Cloud-Based Neuroanalytics
- 4.3.4 Shortage Of Trained Neuro-Specialists In Emerging Markets
- 4.4 Value / Supply-Chain Analysis
- 4.5 Regulatory Landscape
- 4.6 Technological Outlook
- 4.7 Porter's Five Forces
- 4.7.1 Threat of New Entrants
- 4.7.2 Bargaining Power of Suppliers
- 4.7.3 Bargaining Power of Buyers
- 4.7.4 Threat of Substitutes
- 4.7.5 Competitive Rivalry
5 Market Size & Growth Forecasts (Value, USD)
- 5.1 By Product
- 5.1.1 Instruments
- 5.1.2 Consumables (reagents, antibodies, assay kits)
- 5.1.3 Software & Services
- 5.2 By Technology
- 5.2.1 Neuroimaging (MRI, PET, CT, MEG)
- 5.2.2 Neurostimulation / Neuromodulation
- 5.2.3 Electrophysiology (EEG, ECoG, EMG)
- 5.2.4 Molecular & Cellular Assays
- 5.3 By Application
- 5.3.1 Research & Academic
- 5.3.2 Diagnostics
- 5.3.3 Therapeutics Monitoring
- 5.4 By End-User
- 5.4.1 Hospitals & Clinics
- 5.4.2 Diagnostic Laboratories
- 5.4.3 Pharmaceutical & Biotech Companies
- 5.4.4 Academic & Research Institutes
- 5.5 By Geography
- 5.5.1 North America
- 5.5.1.1 United States
- 5.5.1.2 Canada
- 5.5.1.3 Mexico
- 5.5.2 Europe
- 5.5.2.1 Germany
- 5.5.2.2 United Kingdom
- 5.5.2.3 France
- 5.5.2.4 Italy
- 5.5.2.5 Rest of Europe
- 5.5.3 Asia-Pacific
- 5.5.3.1 China
- 5.5.3.2 India
- 5.5.3.3 Japan
- 5.5.3.4 South Korea
- 5.5.3.5 Australia
- 5.5.3.6 Rest of Asia-Pacific
- 5.5.4 South America
- 5.5.4.1 Brazil
- 5.5.4.2 Argentina
- 5.5.4.3 Rest of South America
- 5.5.5 Middle East and Africa
- 5.5.5.1 GCC
- 5.5.5.2 South Africa
- 5.5.5.3 Rest of Middle East and Africa
- 5.5.1 North America
6 Competitive Landscape
- 6.1 Market Concentration
- 6.2 Market Share Analysis
- 6.3 Company Profiles (includes Global level Overview, Market level overview, Core Segments, Financials as available, Strategic Information, Market Rank/Share for key companies, Products & Services, Recent Developments)
- 6.3.1 Medtronic plc
- 6.3.2 GE HealthCare Technologies Inc.
- 6.3.3 Abbott Laboratories
- 6.3.4 Boston Scientific Corporation
- 6.3.5 Siemens Healthineers AG
- 6.3.6 Koninklijke Philips N.V.
- 6.3.7 Thermo Fisher Scientific Inc.
- 6.3.8 Nihon Kohden Corporation
- 6.3.9 Hitachi Ltd.
- 6.3.10 Fujifilm Holdings Corporation
- 6.3.11 Bruker Corporation
- 6.3.12 Carl Zeiss AG
- 6.3.13 Bio-Rad Laboratories Inc.
- 6.3.14 Revvity
- 6.3.15 Compumedics Limited
- 6.3.16 Alpha Omega Engineering Ltd.
- 6.3.17 Axion BioSystems Inc.
- 6.3.18 Blackrock Neurotech
7 Market Opportunities & Future Outlook
- 7.1 White-space & Unmet-Need Assessment


