
|
시장보고서
상품코드
2114610
컨베이어 모니터링 : 시장 점유율 분석, 업계 동향 및 통계, 성장 예측(2026-2031년)Conveyor Monitoring - Market Share Analysis, Industry Trends & Statistics, Growth Forecasts (2026 - 2031) |
||||||
 Mordor Intelligence
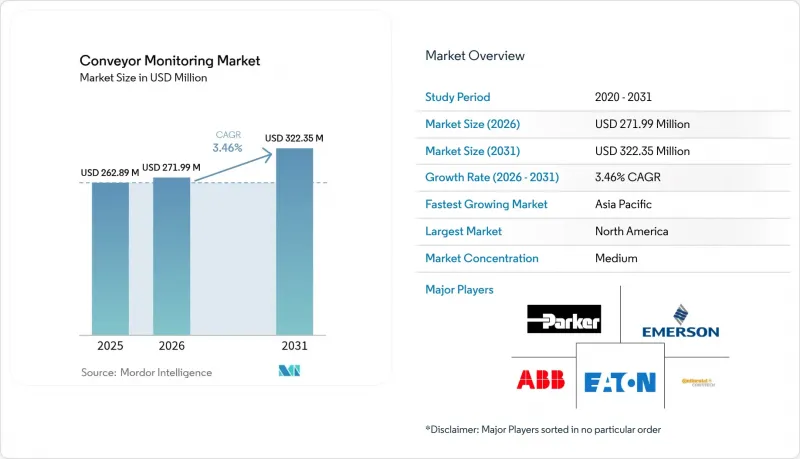
Mordor Intelligence에 의하면, 컨베이어 모니터링 시장 규모는 2025년에 2억 6,289만 달러로 평가되었습니다. 2026년 2억 7,199만 달러에서 2031년까지 3억 2,235만 달러에 이를 것으로 예상되며, 예측 기간(2026-2031년) CAGR은 3.46%를 나타낼 전망입니다.
본 보고서는 유형별(하드웨어, 소프트웨어), 모니터링 유형별(컨베이어 벨트 모니터링, 컨베이어 모터 모니터링), 컨베이어 유형별(벨트 컨베이어, 롤러 컨베이어 등), 최종 사용자 산업별(자동차, 소비재 포장, 광업, 식품 및 음료, 물류 및 창고 등),및 지역별로 분류되어 있습니다. 시장 예측은 금액(달러) 기준으로 제시되어 있습니다.
세계의 컨베이어 모니터링 시장 동향 및 인사이트
예지보전 도구 및 기법의 도입 확대
예지 보전을 통해 시간 기반의 점검을 센서 기반의 상태 판단 작업으로 대체함으로써, 수리 비용을 최대 30% 절감하고 자산의 수명을 40% 연장할 수 있습니다. 현재 광업 기업에서는 가속도계, 초음파, 적외선 데이터를 엣지 게이트웨이를 통해 스트리밍하고, 베어링 고장을 몇 주 전에 예측함으로써 연중무휴 24시간 가동 중에도 컨베이어의 가동을 유지하고 있습니다. 50달러 미만의 저가형 MEMS 센서를 무선 블루투스 또는 LoRaWAN 모듈과 결합함으로써, 대규모 연속 모니터링을 합리적인 가격으로 실현하고 있습니다. Rio Tinto는 컨베이어의 상태 데이터를 자율 운송 분석과 연동하여 컨베이어 1킬로미터당 광석 처리량을 15% 향상시켰습니다. ABB와 같은 공급업체는 기존 모터에 사후 장착형 센서를 부착하여, 기존의 구동 장치를 진동, 온도, 자속 데이터를 모바일 대시보드로 전송하는 연결된 자산으로 전환하고 있습니다.
엄격한 산업안전 규제가 컨베이어 상태 모니터링의 자동화를 촉진
미국 MSHA 30 CFR Part 56 규정에 따르면 벨트의 어긋남이나 미끄러짐 감지가 의무화되어 있어, 이에 따라 지상 및 지하 광산 모두에서 센서의 신속한 사후 설치가 진행되고 있습니다. 남아프리카공화국의 광산 보건안전법에도 유사한 의무가 규정되어 있으며, 규제 당국은 2024년 광산 사망 사고의 12%가 컨베이어 사고에 기인한 것으로 추정하고 있습니다. 이 통계는 벨트 균열을 지속적으로 감지하는 기술의 도입을 가속화했습니다. EU 기계 지침에서는 문서화된 위험성 평가가 의무화되어 있으며, 향후 시행될 EU AI법에서는 예측 모델의 감사 추적이 의무화될 예정이어서 사전 인증을 받은 시스템을 제공하는 공급업체가 유리한 입지를 차지하게 될 것입니다. 뉴질랜드에서는 2024년에 컨베이어 보호 및 비상 정지 관련 기준이 강화되어, 근접 센서나 풀코드 스위치를 추가하는 방식으로 업그레이드가 진행되고 있습니다.
감시 솔루션 관리 및 데이터 분석을 수행할 사내 전문 인력이 부족한 실정입니다.
컨베이어 모니터링 시장에서는 신호 처리 및 예측 분석 교육을 받은 엔지니어의 부족이 여전히 과제로 남아 있습니다. 테라바이트 규모의 진동, 온도, 음향 데이터는 기존 유지보수 팀에게 종종 감당하기 힘든 부담이 되고 있습니다. 특히 동남아시아와 남미에서는 기술 인력이 고임금 경제권으로 유출되고 있어 이러한 경향이 두드러집니다. 각 벤더사는 매니지드 서비스를 제공함으로써 이러한 기술 격차를 해소하고 있습니다. Honeywell Forge는 컨시어지 플랜을 제공하며, 전문가가 매주 데이터를 분석하여 우선순위가 지정된 수리 목록을 작성합니다.
부문별 분석
센서, 게이트웨이, 제어 모듈의 초기 구매로 인해 2025년 매출의 64.13%를 하드웨어가 차지했으나, 소프트웨어 구독은 2031년까지 연평균 성장률(CAGR) 4.43%를 나타낼 전망이며, 이는 물리적 자산의 성장률을 상회하는 수치입니다. 이러한 변화는 사업자들이 기존 센서의 성능을 더욱 향상시키려 하고 있음을 여실히 보여줍니다. Rockwell FactoryTalk Analytics는 진동, 온도, 에너지 데이터를 단일 위험 점수로 통합하는 반면, Emerson Plantweb Insight는 기업의 신뢰성 팀이 사업장 간 벤치마킹을 수행할 수 있도록 지원합니다.
성과 기반 계약에 대한 선호도가 높아지면서 이러한 변화가 가속화되고 있습니다. 종량제 요금 모델을 통해 공장은 본격적인 도입에 앞서 용도를 시범적으로 도입할 수 있게 되었으며, 이는 예산 제약으로 인해 설비 투자 승인이 지연되기 쉬운 컨베이어 모니터링 시장에서 중요한 인센티브가 되고 있습니다.
벨트 모니터링은 여전히 사용자의 최우선 순위이며, 2025년 도입 건수의 71.05%를 차지했습니다. 벨트 카카스 내부에 내장된 광섬유 케이블과 스플라이스 위치 편차를 감지하는 레이저 스캐너는 즉시 정지를 지시하여 막대한 가동 중단 시간을 미연에 방지합니다. Fenner Dunlop의 Intelliguard 솔루션은 감지 시간을 2초 미만으로 단축합니다.
한편, 모터 모니터링은 4.62%라는 비교적 높은 연평균 성장률(CAGR)을 보이고 있으며, 이는 컨베이어의 예기치 않은 정지 사례 중 30-40%가 전동 구동 장치에서 기인한다는 현실을 반영합니다. SKF의 무선 진동 키트와 Nidec의 내장 센서 장착 모터는 온도, 전류, 불균형 이상을 클라우드 대시보드에 보고하므로, 계획 담당자는 정기 정지 기간 동안 베어링을 교체할 수 있습니다. 가변 주파수 드라이브의 보급에 따라 사용자들은 고조파 왜곡 및 절연 스트레스에 특화된 분석 기능을 필요로 하고 있으며, 이로 인해 컨베이어 모니터링 시장의 잠재적 수익이 확대되고 있습니다.
지역별 분석
2025년 매출에서 북미는 컨베이어 모니터링 시장의 35.21%를 차지하며 1위를 차지했습니다. 엄격한 MSHA(광산 안전 보건국) 규정에 따라 벨트의 지속적인 점검이 의무화되어 있으며, 시간당 35달러를 초과하는 숙련된 노동자의 인건비가 예측 유지보수 시스템의 투자 수익률(ROI)을 높이고 있습니다. 외딴 지역에서 운영되는 캐나다 광산 사업자에게는 모니터링 시스템이 중요한 가치를 지닙니다. 이는 고장이 감지되지 않으면 교체 부품을 헬리콥터로 배송해야 하므로 가동 중단 기간이 길어질 가능성이 있기 때문입니다.
아시아태평양은 4.19%라는 가장 높은 연평균 성장률(CAGR)을 기록하고 있으며, 중국, 인도 및 아세안(ASEAN) 국가에서는 고비용의 신규 공장 건설을 피하면서 생산성 목표를 달성하기 위해 기존 생산 라인의 개보수가 진행되고 있습니다. 중국 공업정보화부는 2024년 스마트 제조로의 업그레이드에 500억 위안(인민폐)을 배정했습니다. 인도에서는 생산량에 연동된 인센티브 제도를 통해 처리량을 향상시키는 자동화 투자가 지원 대상에 포함되어 있으며, 작년에 건설된 2,500개의 신규 공장 전체에서 소프트웨어 수요가 촉진되고 있습니다. 일본에서는 노동력의 고령화에 따라 감소하는 기술 인력을 보충하기 위해 자동화가 추진되고 있습니다.
유럽, 남미, 중동 및 아프리카가 세계 매출의 나머지 부분을 차지하고 있습니다. 독일의 자동차 생산 라인에서는 컨베이어의 KPI를 인더스트리 4.0 플랫폼과 통합하여 유연한 혼류 생산을 유지하고 있습니다. 브라질의 Vale는 브루마지뉴 사고 이후 감독 강화 조치에 따라 미나스제라이스주 전역에 균열 감지 센서를 설치하고 있습니다. 사우디아라비아의 ‘비전 2030’에서는 현대적인 자재관리 인프라를 중시하는 다양한 산업 클러스터에 5,000억 달러를 배정하고 있습니다.
기타 혜택 :
- 엑셀 형식 시장 예측(ME) 시트
- 3개월간 애널리스트 지원
자주 묻는 질문
목차
제1장 서론
제2장 조사 방법
제3장 주요 요약
제4장 시장 구도
제5장 시장 규모 및 성장 예측
제6장 경쟁 구도
제7장 시장 기회 및 향후 전망
KTH 26.08.28According to Mordor Intelligence, the conveyor monitoring market size was valued at USD 262.89 million in 2025 and estimated to grow from USD 271.99 million in 2026 to reach USD 322.35 million by 2031, at a CAGR of 3.46% during the forecast period (2026-2031).
This report is Segmented by Type (Hardware and Software), Type of Monitoring (Conveyor Belt Monitoring and Conveyor Motor Monitoring), Conveyor Type (Belt Conveyors, Roller Conveyors, and More), End-User Industry (Automotive, Consumer Goods Packaging, Mining, Food and Beverage, Logistics and Warehousing, and More), and Geography. The Market Forecasts are Provided in Terms of Value (USD).
Global Conveyor Monitoring Market Trends and Insights
Rising Adoption of Predictive Maintenance Tools and Techniques
Predictive maintenance cuts repair costs by up to 30% and extends asset life by 40% as operators replace time-based checks with sensor-driven, condition-based tasks. Mining companies now stream accelerometer, ultrasonic, and infrared data through edge gateways that forecast bearing failures weeks ahead, keeping conveyors online during 24/7 operations. Low-cost MEMS sensors priced under USD 50, paired with wireless Bluetooth or LoRaWAN modules, make continuous monitoring affordable at scale. Rio Tinto links conveyor health data to autonomous haulage analytics, boosting ore throughput per conveyor kilometer by 15%. Vendors such as ABB clamp retrofit sensors onto existing motors, converting legacy drives into connected assets that transmit vibration, temperature, and magnetic-flux data to mobile dashboards.
Stringent Workplace Safety Regulations Driving Automation of Conveyor Health Monitoring
The U.S. MSHA 30 CFR Part 56 rule requires the detection of belt misalignment and slippage, prompting rapid sensor retrofits in both surface and underground mines. South Africa's Mine Health and Safety Act carries similar obligations; regulators attribute 12% of 2024 mining fatalities to conveyor incidents, a statistic that accelerated the adoption of continuous belt-rip detection. The EU Machinery Directive requires documented hazard assessments, and the forthcoming EU AI Act will compel audit trails for predictive models, favoring vendors that deliver pre-certified systems. New Zealand tightened conveyor guarding and emergency-stop standards in 2024, prompting upgrades with the addition of proximity sensors and pull-cord switches.
Limited In-House Skillset to Manage Monitoring Solutions and Analyse Data
The conveyor monitoring market still confronts a shortage of engineers trained in signal processing and predictive analytics. Terabytes of vibration, temperature, and acoustic data often overwhelm existing maintenance teams, especially in Southeast Asia and South America, where technical talent migrates toward higher-wage economies. Vendors answer this skills gap with managed services. Honeywell Forge offers a concierge tier where specialists interpret data weekly and issue prioritized repair lists.
Other drivers and restraints analyzed in the detailed report include:
- Rapid Expansion in E-Commerce Fulfillment Centers Demanding Continuous Conveyor Uptime
- Increasing Throughput Requirements in Mining and Bulk Material Handling
- High Costs of Installation and Maintenance
For complete list of drivers and restraints, kindly check the Table Of Contents.
Segment Analysis
Hardware commanded 64.13% of 2025 revenue due to the up-front purchase of sensors, gateways, and control modules, yet software subscriptions are on track for a 4.43% CAGR through 2031, outpacing physical asset growth. This swing highlights how operators strive for further performance gains from existing sensors. Rockwell FactoryTalk Analytics unifies vibration, temperature, and energy data into a single risk score, while Emerson Plantweb Insight enables corporate reliability teams to benchmark across sites.
Growing preference for outcome-based contracts accelerates this shift. Pay-as-you-go models allow plants to test applications before full scale-up, a key incentive in the conveyor monitoring market where budget constraints can delay capital approvals.
Belt integrity still tops user priority lists, explaining 71.05% of 2025 installations. Fiber-optic cables inside belt carcasses and laser scanners that detect splice misalignment trigger immediate stops, preventing catastrophic downtime. Fenner Dunlop's Intelliguard solution cuts detection time to under 2 seconds.
Motor monitoring, however, posts a faster 4.62% CAGR, reflecting the reality that electric drives cause 30-40% of unexpected conveyor halts. SKF's wireless vibration kits and Nidec's embedded-sensor motors report temperature, current, and imbalance anomalies to cloud dashboards, letting planners replace bearings during scheduled shutdowns. As variable-frequency drives proliferate, users need analytics tuned for harmonic distortion and insulation stress, expanding addressable revenue for the conveyor monitoring market.
Complete Report Scope:
- By Type
- Hardware
- Software
- By Type of Monitoring
- Conveyor Belt Monitoring
- Conveyor Motor Monitoring
- By Conveyor Type
- Belt Conveyors
- Roller Conveyors
- Overhead Conveyors
- Pallet Conveyors
- Screw and Other Specialty Conveyors
- By End-user Industry
- Automotive
- Consumer Goods Packaging
- Mining
- Food and Beverage
- Logistics and Warehousing
- Other End-user Industries
- By Geography
- North America
- United States
- Canada
- South America
- Brazil
- Mexico
- Argentina
- Rest of South America
- Europe
- Germany
- United Kingdom
- France
- Italy
- Rest of Europe
- Asia-Pacific
- China
- Japan
- India
- South Korea
- Rest of Asia-Pacific
- Middle East and Africa
- Middle East
- United Arab Emirates
- Saudi Arabia
- Rest of Middle East
- Africa
- South Africa
- Nigeria
- Rest of Africa
- Middle East
- North America
Geography Analysis
North America led 2025 revenue with 35.21% of the conveyor monitoring market. Strict MSHA rules mandate continuous belt inspection, and skilled-labor costs above USD 35 per hour strengthen the ROI for predictive systems. Canadian miners in remote regions value monitoring because replacement parts often require helicopter delivery, which can stretch outages if failures go undetected.
Asia-Pacific records the fastest 4.19% CAGR as China, India, and ASEAN states retrofit legacy lines to hit productivity goals without costly greenfield plants. China's Ministry of Industry and Information Technology allocated RMB 50 billion to smart manufacturing upgrades in 2024. India's production-linked incentives reimburse automation spending that improves throughput, spurring software demand across 2,500 new factories built last year. Japan's aging workforce drives automation to cover shrinking technical head counts.
Europe, South America, and the Middle East and Africa supply the balance of global revenue. Germany's automotive lines integrate conveyor KPIs with Industry 4.0 platforms to maintain flexible mixed-model assembly. Brazil's Vale installs rip-detection sensors across Minas Gerais after heightened post-Brumadinho oversight. Saudi Arabia's Vision 2030 allocates USD 500 billion for diversified industrial clusters that emphasize modern materials-handling infrastructure
- ABB Ltd.
- Bando Chemical Industries, Ltd.
- Beltscan Systems Pty Ltd.
- BEUMER Group GmbH and Co. KG
- CBG Conveyor Belt Gateway
- ContiTech AG
- Eaton Corporation plc
- Emerson Electric Co.
- Fenner Dunlop Inc.
- Honeywell International Inc.
- Nidec Motor Corporation
- Parker Hannifin Corporation
- PHOENIX CBS GmbH
- Rockwell Automation, Inc.
- Siemens AG
- SICK AG
- SKF Group
- Strata Worldwide, LLC
- TE Connectivity Ltd.
- Voith GmbH and Co. KGaA
- voestalpine AG
- Yokogawa Electric Corporation
- 4B Braime Group
- Yellow Technical Services (Pty) Ltd.
Additional Benefits:
- The market estimate (ME) sheet in Excel format
- 3 months of analyst support
TABLE OF CONTENTS
1 INTRODUCTION
- 1.1 Study Assumptions and Market Definition
- 1.2 Scope of the Study
2 RESEARCH METHODOLOGY
3 EXECUTIVE SUMMARY
4 MARKET LANDSCAPE
- 4.1 Market Overview
- 4.2 Market Drivers
- 4.2.1 Rising Adoption of Predictive Maintenance Tools and Techniques
- 4.2.2 Stringent Workplace Safety Regulations Driving Automation of Conveyor Health Monitoring
- 4.2.3 Rapid Expansion in E-commerce Fulfilment Centres Demanding Continuous Conveyor Uptime
- 4.2.4 Increasing Throughput Requirements in Mining and Bulk Material Handling
- 4.2.5 Integration of Low-Cost Wireless IIoT Sensors Enabling Retrofit Monitoring in Legacy Conveyors
- 4.2.6 Emergence of Conveyor Digital Twins Combined with Edge Analytics for Real-Time Optimisation
- 4.3 Market Restraints
- 4.3.1 Limited In-House Skillset to Manage Monitoring Solutions and Analyse Data
- 4.3.2 High Costs of Installation and Maintenance
- 4.3.3 Uncertain Return on Investment for Small and Mid-Sized Facilities
- 4.3.4 Cyber-Security Vulnerabilities in Connected Conveyor Systems
- 4.4 Industry Value Chain Analysis
- 4.5 Regulatory Landscape
- 4.6 Technological Outlook
- 4.7 Porter's Five Forces Analysis
- 4.7.1 Threat of New Entrants
- 4.7.2 Bargaining Power of Buyers
- 4.7.3 Bargaining Power of Suppliers
- 4.7.4 Threat of Substitute Products
- 4.7.5 Intensity of Competitive Rivalry
5 MARKET SIZE AND GROWTH FORECASTS (VALUE)
- 5.1 By Type
- 5.1.1 Hardware
- 5.1.2 Software
- 5.2 By Type of Monitoring
- 5.2.1 Conveyor Belt Monitoring
- 5.2.2 Conveyor Motor Monitoring
- 5.3 By Conveyor Type
- 5.3.1 Belt Conveyors
- 5.3.2 Roller Conveyors
- 5.3.3 Overhead Conveyors
- 5.3.4 Pallet Conveyors
- 5.3.5 Screw and Other Specialty Conveyors
- 5.4 By End-user Industry
- 5.4.1 Automotive
- 5.4.2 Consumer Goods Packaging
- 5.4.3 Mining
- 5.4.4 Food and Beverage
- 5.4.5 Logistics and Warehousing
- 5.4.6 Other End-user Industries
- 5.5 By Geography
- 5.5.1 North America
- 5.5.1.1 United States
- 5.5.1.2 Canada
- 5.5.2 South America
- 5.5.2.1 Brazil
- 5.5.2.2 Mexico
- 5.5.2.3 Argentina
- 5.5.2.4 Rest of South America
- 5.5.3 Europe
- 5.5.3.1 Germany
- 5.5.3.2 United Kingdom
- 5.5.3.3 France
- 5.5.3.4 Italy
- 5.5.3.5 Rest of Europe
- 5.5.4 Asia-Pacific
- 5.5.4.1 China
- 5.5.4.2 Japan
- 5.5.4.3 India
- 5.5.4.4 South Korea
- 5.5.4.5 Rest of Asia-Pacific
- 5.5.5 Middle East and Africa
- 5.5.5.1 Middle East
- 5.5.5.1.1 United Arab Emirates
- 5.5.5.1.2 Saudi Arabia
- 5.5.5.1.3 Rest of Middle East
- 5.5.5.2 Africa
- 5.5.5.2.1 South Africa
- 5.5.5.2.2 Nigeria
- 5.5.5.2.3 Rest of Africa
- 5.5.5.1 Middle East
- 5.5.1 North America
6 COMPETITIVE LANDSCAPE
- 6.1 Market Concentration
- 6.2 Strategic Moves
- 6.3 Market Share Analysis
- 6.4 Company Profiles (includes Global level Overview, Market level overview, Core Segments, Financials as available, Strategic Information, Market Rank/Share for key companies, Products and Services, and Recent Developments)
- 6.4.1 ABB Ltd.
- 6.4.2 Bando Chemical Industries, Ltd.
- 6.4.3 Beltscan Systems Pty Ltd.
- 6.4.4 BEUMER Group GmbH and Co. KG
- 6.4.5 CBG Conveyor Belt Gateway
- 6.4.6 ContiTech AG
- 6.4.7 Eaton Corporation plc
- 6.4.8 Emerson Electric Co.
- 6.4.9 Fenner Dunlop Inc.
- 6.4.10 Honeywell International Inc.
- 6.4.11 Nidec Motor Corporation
- 6.4.12 Parker Hannifin Corporation
- 6.4.13 PHOENIX CBS GmbH
- 6.4.14 Rockwell Automation, Inc.
- 6.4.15 Siemens AG
- 6.4.16 SICK AG
- 6.4.17 SKF Group
- 6.4.18 Strata Worldwide, LLC
- 6.4.19 TE Connectivity Ltd.
- 6.4.20 Voith GmbH and Co. KGaA
- 6.4.21 voestalpine AG
- 6.4.22 Yokogawa Electric Corporation
- 6.4.23 4B Braime Group
- 6.4.24 Yellow Technical Services (Pty) Ltd.
7 MARKET OPPORTUNITIES AND FUTURE OUTLOOK
- 7.1 White-space and Unmet-Need Assessment