

|
시장보고서
상품코드
2114752
광촉매 시장 : 점유율 분석, 업계 동향과 통계, 성장 예측(2026-2031년)Photocatalyst - Market Share Analysis, Industry Trends & Statistics, Growth Forecasts (2026 - 2031) |
||||||
 Mordor Intelligence
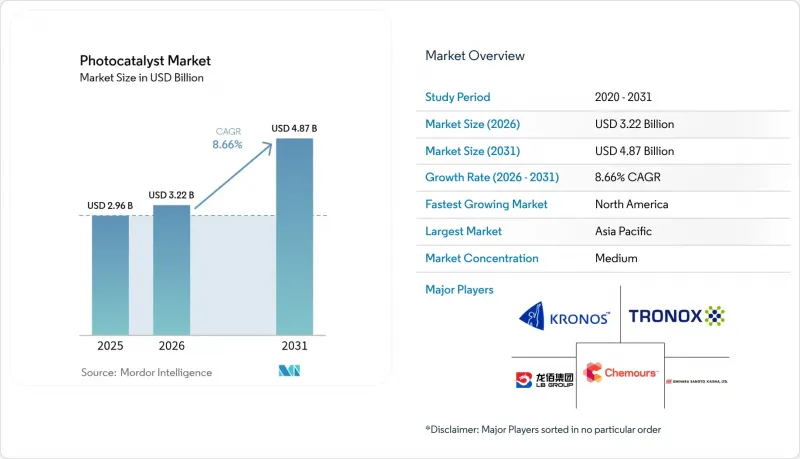
Mordor Intelligence에 의하면, 광촉매 시장 규모는 2025년 29억 6,000만 달러에서 2026년에는 32억 2,000만 달러로 확대되어 2026년부터 2031년까지 CAGR 8.66%로 성장을 지속하여, 2031년까지 48억 7,000만 달러에 이를 것으로 예측됩니다.
본 보고서는 유형별(이산화티타늄, 산화아연, 기타), 용도별(자가 세정, 공기 정화, 수처리, 결로 방지, 기타), 지역별(아시아태평양, 북미, 유럽, 남미, 중동 및 아프리카)로 분류되어 있습니다. 본 보고서에서는 상기 모든 부문에 대해 광촉매 시장 규모 및 전망(금액: 백만 달러)을 제시하고 있습니다.
전 세계 광촉매 시장 동향 및 인사이트
자가 세정형 건축자재에서 이산화티타늄(TiO2) 광촉매 수요 급증
현재 건물 소유주들은 건물의 전체 수명 기간 동안 파사드 세척 비용을 최대 40%까지 절감할 수 있는 나노 텍스처 TiO2 코팅을 지정하고 있습니다. 최근의 배합에서는 95%의 광 투과율을 달성하여 주목을 받고 있는 유리 건축물의 미적 요구를 충족시키고 있습니다. 또한, 광촉매 표면은 햇빛 아래에서 공기 중의 톨루엔을 63% 제거하므로 도시의 대기 질에 대한 우려를 완화합니다. 고층 건축 프로젝트에서 이러한 코팅이 채택되고 있는 이유는 로프 접근 방식의 청소가 비용이 많이 들고 공사를 방해하기 때문입니다. 한편, 새로 개발된 Bi@Bi4Ti3O12/TiO2 박막은 가시광선 영역에서도 효과를 발휘하므로, 그늘이 지는 외벽의 디자인 자유도를 넓혀주고 있습니다.
지자체 상수도·하수 처리 시설에서의 도입 확대
상수도 유틸리티는 2,4-D, MCPP, 디캄바 등의 농약에 대응하기 위해 태양광을 이용한 광촉매를 통한 3차 처리를 도입하고 있으며, 외부 전원이 없이도 최대 99.8%의 분해율을 달성하고 있습니다. 광촉매 막 반응 장치는 방류수의 품질을 정밀하게 제어할 수 있고, 오염 물질의 급증에 대한 내성이 있어 주목을 받고 있습니다. 적층 가공(AM)를 통한 복합 구조는 표면적과 광 분포의 형태를 맞춤화하여 비용을 절감하고, 전력망이 정비되지 않은 외딴 지역에도 설치할 수 있게 해줍니다.
산업 규모의 광촉매 반응기에 필요한 높은 설비 투자
경제 모델에 따르면, 반응 속도 상수가 0.1 min-1 이하로 떨어지면 처리 비용이 급증하기 때문에 개발자들은 반응기를 과잉 설계하기보다는 촉매 가격을 낮추는 방안을 모색해야 합니다. UV 램프 어레이, 정밀한 유량 제어, 그리고 오염 방지 대책은 설비 투자를 더욱 부풀려, 프로젝트 비용이 당초 예산의 3-5배에 달하는 경우도 드물지 않습니다. 모듈식 유닛과 하이브리드 광생물반응기는 실용적인 해결책으로 부상하고 있으며, 투자를 장기간에 걸쳐 분산시키고, 에너지 가격과 수질 규제가 조화를 이루는 범위 내에서 5-15년이라는 합리적인 기간 내에 투자 회수를 실현합니다.
부문 분석
2025년, TiO2는 성숙한 생산 규모와 수십 년에 걸친 배합 노하우를 바탕으로 광촉매 시장 점유율의 61.45%를 차지했습니다. 트리에탄올아민을 이용한 Ti3+의 자가 도핑과 같은 병행 기술 발전으로 가시광선 영역에서의 적용 범위가 확대되었으며, 반덤핑 관세가 공급 물류에 변화를 가져오는 상황 속에서도 성능 면에서의 우위를 더욱 공고히 하고 있습니다. 한편, ZnO는 표면 반응 경로가 수소 생성에 적합하기 때문에 아시아태평양 및 북미 전역에서 청정 연료에 대한 막대한 자금 지원이 이루어지고 있는 분야에서 9.55%라는 가장 높은 연평균 성장률(CAGR)을 기록하고 있습니다.
그러나 성장세는 다성분 시스템으로 점차 이동하고 있습니다. 비스무트 산화물, 그래핀 복합재료 및 MOF 유래 구조체는 10%를 초과하는 양자 수율을 보여주고 있으며, CO₂ 전환 및 특수 화학물질 합성을 목표로 하고 있습니다. 시장 선택은 범용적인 지표보다 용도의 특수성에 더 중점을 두게 될 것으로 예상되며, TiO₂는 광촉매 시장의 전체 판매량 1위를 유지하겠지만, 높은 수익률을 보이는 틈새 시장의 일부를 내줄 가능성이 시사되고 있습니다.
지역별 분석
아시아태평양은 2025년에도 66.15%의 점유율을 유지했습니다. 이는 일본의 연구 리더십과 중국의 저비용 TiO2 생산이 연구실에서 공장 현장에 이르는 수직 통합형 클러스터를 뒷받침하고 있기 때문입니다. 후쿠시마 제1원자력발전소 사고 이후의 연구개발 보조금이 가시광선 영역의 기술 혁신을 뒷받침하고 있으며, 2017년에 중국이 황산염법으로 생산한 265만 톤의 TiO₂는 환경 규제가 강화되는 상황에서도 가격 경쟁력을 지탱하고 있습니다. 급속한 도시화와 계절성 스모그로 인해, 광촉매를 활용한 공기 정화 외벽 및 지하철역에 대한 지자체 수요가 더욱 높아지고 있습니다.
북미는 HVAC(공조 설비) 개보수 및 자동차 연료 증기 제어를 가속화하는 EPA(미국 환경보호청)의 VOC(휘발성 유기 화합물) 규제 덕분에 연평균 성장률(CAGR) 9.62%라는 가장 빠른 속도로 확대되고 있습니다. 지방 자치단체의 유틸리티체는 미량 오염 물질 배출 허가 기준을 충족하기 위해 수동형 태양열을 이용한 3차 처리를 도입하고 있는 반면, 연방 정부의 청정 수소 크레딧 제도는 ZnO(산화아연)를 이용한 물 전기분해 실증 실험을 촉진하고 있습니다. 캐나다의 그린 빌딩 기준과 멕시코의 확대되는 산업 기반이 미국 이외 지역의 생산량을 끌어올리고 있습니다.
유럽에서는 그린딜의 순환 경제 관련 조항이 호재로 작용하여, 보조금이 지속 가능한 건설 및 광촉매 유리와 투명형 태양광 패널을 결합한 아그리볼타익(농업과 태양광 발전의 융합) 시범 사업에 투입되고 있습니다. 중국산 TiO2에 대한 반덤핑 관세로 인해 현지 안료 제조업체들은 수익성이 높은 촉매 등급으로의 다각화를 가속화하고 있으며, 그 결과 공급망이 단축되고 있습니다. 남미, 중동 및 아프리카는 특히 외딴 지역의 농업 및 광산 캠프에서 사용 현장에서의 수처리 및 태양광 패널용 코팅이 기존의 솔루션을 획기적으로 능가할 수 있는 초기 단계 시장입니다.
기타 혜택:
- 엑셀 형식 시장 예측(ME) 시트
- 3개월간의 애널리스트 지원
자주 묻는 질문
목차
제1장 서론
제2장 조사 방법
제3장 주요 요약
제4장 시장 구도
제5장 시장 규모와 성장 예측
제6장 경쟁 구도
제7장 시장 기회와 향후 전망
JHS 26.08.26According to Mordor Intelligence, the photocatalyst market size is expected to grow from USD 2.96 billion in 2025 to USD 3.22 billion in 2026 and is forecast to reach USD 4.87 billion by 2031 at 8.66% CAGR over 2026-2031.
This report is Segmented by Type (Titanium Dioxide, Zinc Oxide, and Other Types), Application (Self-Cleaning, Air Purification, Water Treatment, Anti-Fogging, and Other Applications), and Geography (Asia-Pacific, North America, Europe, South America, and Middle-East and Africa). The Report Offers Market Size and Forecast for Photocatalyst in Value (USD Million) for all the Above Segments.
Global Photocatalyst Market Trends and Insights
Surging Demand for TiO2 Photocatalysts in Self-Cleaning Construction Materials
Building owners now specify nano-textured TiO2 coatings that cut facade washing expenses by as much as 40% across a building's life. Recent formulations achieve 95% optical transmittance, meeting the aesthetic needs of high-profile glass architecture. Photocatalytic surfaces also remove 63% of airborne toluene under daylight, easing urban air-quality concerns. High-rise projects adopt these coatings because rope-access cleaning is expensive and disruptive, while novel Bi@Bi4Ti3O12/TiO2 films extend the benefit to visible light, broadening design freedom for shaded elevations.
Rising Adoption in Municipal Water & Wastewater Treatment Plants
Utilities turn to solar-driven photocatalytic tertiary treatment to tackle pesticides such as 2,4-D, MCPP and dicamba, achieving up to 99.8% degradation without external power. Photocatalytic membrane reactors gain traction for their precise effluent quality control and resilience to contaminant peaks. Additive-manufactured composite structures push costs down by customizing surface area and light-distribution geometry, making remote installations viable where grid electricity is scarce.
High Capital Expenditure for Industrial-Scale Photocatalytic Reactors
Economic modeling shows treatment costs spike when reaction rate constants fall below 0.1 min-1, pushing developers to cut catalyst price rather than over-engineer reactors. UV-lamp arrays, precision flow control and fouling mitigation further inflate capex, often pushing projects 3-5 times above initial budgets. Modular units and hybrid photo-bioreactors emerge as workable answers, spreading investment over time and keeping payback within acceptable 5-15 year windows where energy prices and water-quality mandates align.
Other drivers and restraints analyzed in the detailed report include:
- Stricter Indoor-Air VOC Regulations Boosting Photocatalytic Air Purifiers
- Visible-Light Plasmonic Nanocomposites Enabling Indoor Consumer-Electronics Coatings
- Catalyst Deactivation from Surface Fouling & Electron-Hole Recombination
For complete list of drivers and restraints, kindly check the Table Of Contents.
Segment Analysis
In 2025, TiO2 held 61.45% of photocatalyst market share owing to mature production scale and decades of formulation know-how. Concurrent advances such as Ti3+ self-doping via triethanolamine routes widen its visible-light window, reinforcing performance leadership even as antidumping duties change supply logistics. ZnO meanwhile posts the fastest 9.55% CAGR because its surface reaction pathway favors hydrogen generation, an area receiving generous green-fuel funding across Asia-Pacific and North America.
Momentum is nonetheless shifting toward multi-component systems. Bismuth-oxides, graphene composites and MOF-derived structures demonstrate quantum yields above 10%, targeting CO2 conversion and specialty chemical synthesis. Market selection is expected to tilt on application specificity more than on universal metrics, suggesting TiO2 might relinquish some high-margin niches even while retaining overall volume leadership in the photocatalyst market.
Complete Report Scope:
- By Photocatalyst Type
- Titanium Dioxide
- Zinc Oxide
- Other Types
- By Application
- Self-Cleaning
- Air Purification
- Water Treatment
- Anti-Fogging
- Other Applications
- By End-Use Industry
- Construction and Infrastructure
- Automotive and Transportation
- Consumer Electronics and Appliances
- Energy and Utilities (Solar, Hydrogen)
- Other End-user Industries (Healthcare and Hygiene, Agriculture and Aquaculture)
- By Geography
- North America
- United States
- Canada
- Mexico
- South America
- Brazil
- Argentina
- Rest of South America
- Europe
- Germany
- United Kingdom
- France
- Italy
- Rest of Europe
- Asia-Pacific
- China
- India
- Japan
- South Korea
- Rest of Asia-Pacific
- Middle East and Africa
- Saudi Arabia
- South Africa
- Rest of Middle East and Africa
- North America
Geography Analysis
Asia-Pacific maintained 66.15% share in 2025 as Japan's research leadership and China's low-cost TiO2 output anchor a vertically integrated cluster from laboratory to factory floor. Post-Fukushima R&D grants propel visible-light innovation, and China's scale-2.65 million tons TiO2 via the sulphate route in 2017-supports price competitiveness even amid tightening environmental rules. Rapid urbanisation and seasonal smog further drive municipal demand for photocatalytic air-scrubbed facades and subway stations.
North America expands fastest at a 9.62% CAGR thanks to EPA VOC limits that accelerate HVAC retrofits and automotive fuel-vapor controls. Municipal utilities implement passive solar tertiary treatment to meet trace-contaminant discharge permits, while federal clean-hydrogen credits stimulate ZnO-based water-splitting demonstrations. Canadian green building codes and Mexico's expanding industrial base add regional volume beyond the United States.
Europe benefits from the Green Deal's circular-economy clauses, channelling subsidies into sustainable construction and agrivoltaic pilots that pair photocatalytic glazing with transparent PV. Antidumping tariffs on Chinese TiO2 galvanise local pigment makers to diversify into higher-margin catalyst grades, thereby shortening supply chains. South America and Middle East & Africa represent early-stage arenas where point-of-use water treatment and solar-panel coatings can leapfrog conventional solutions, especially in remote agriculture and mining camps.
- BASF
- Daicel Miraizu Ltd.
- Green Millennium, Inc.
- ISHIHARA SANGYO KAISHA, LTD.
- KRONOS Worldwide Inc.
- LB Group
- Nanoptek Corp.
- NIPPON SODA CO., LTD.
- Resonac Holdings Corporation
- TAYCA Co., Ltd.
- The Chemours Company
- TitanPE Technologies, Inc.
- Tronox Holdings PLC
- Venator Materials PLC
Additional Benefits:
- The market estimate (ME) sheet in Excel format
- 3 months of analyst support
TABLE OF CONTENTS
1 Introduction
- 1.1 Study Assumptions & Market Definition
- 1.2 Scope of the Study
2 Research Methodology
3 Executive Summary
4 Market Landscape
- 4.1 Market Overview
- 4.2 Market Drivers
- 4.2.1 Surging demand for titanium dioxide photocatalysts in self-cleaning construction materials
- 4.2.2 Rising adoption in municipal water & wastewater treatment plants
- 4.2.3 Stricter indoor-air VOC regulations boosting photocatalytic air purifiers
- 4.2.4 Visible-light plasmonic nanocomposites enabling indoor consumer-electronics coatings
- 4.2.5 Photocatalytic coatings for agrivoltaic glass reducing bio-fouling
- 4.3 Market Restraints
- 4.3.1 High capital expenditure for industrial-scale photocatalytic reactors
- 4.3.2 Catalyst deactivation from surface fouling & electron-hole recombination
- 4.3.3 Regulatory uncertainty on nanoparticle release & disposal
- 4.4 Value Chain Analysis
- 4.5 Porter's Five Forces
- 4.5.1 Threat of New Entrants
- 4.5.2 Bargaining Power of Buyers
- 4.5.3 Bargaining Power of Suppliers
- 4.5.4 Threat of Substitutes
- 4.5.5 Degree of Competition
5 Market Size & Growth Forecasts (Value)
- 5.1 By Photocatalyst Type
- 5.1.1 Titanium Dioxide
- 5.1.2 Zinc Oxide
- 5.1.3 Other Types
- 5.2 By Application
- 5.2.1 Self-Cleaning
- 5.2.2 Air Purification
- 5.2.3 Water Treatment
- 5.2.4 Anti-Fogging
- 5.2.5 Other Applications
- 5.3 By End-Use Industry
- 5.3.1 Construction and Infrastructure
- 5.3.2 Automotive and Transportation
- 5.3.3 Consumer Electronics and Appliances
- 5.3.4 Energy and Utilities (Solar, Hydrogen)
- 5.3.5 Other End-user Industries (Healthcare and Hygiene, Agriculture and Aquaculture)
- 5.4 By Geography
- 5.4.1 North America
- 5.4.1.1 United States
- 5.4.1.2 Canada
- 5.4.1.3 Mexico
- 5.4.2 South America
- 5.4.2.1 Brazil
- 5.4.2.2 Argentina
- 5.4.2.3 Rest of South America
- 5.4.3 Europe
- 5.4.3.1 Germany
- 5.4.3.2 United Kingdom
- 5.4.3.3 France
- 5.4.3.4 Italy
- 5.4.3.5 Rest of Europe
- 5.4.4 Asia-Pacific
- 5.4.4.1 China
- 5.4.4.2 India
- 5.4.4.3 Japan
- 5.4.4.4 South Korea
- 5.4.4.5 Rest of Asia-Pacific
- 5.4.5 Middle East and Africa
- 5.4.5.1 Saudi Arabia
- 5.4.5.2 South Africa
- 5.4.5.3 Rest of Middle East and Africa
- 5.4.1 North America
6 Competitive Landscape
- 6.1 Market Concentration
- 6.2 Strategic Moves
- 6.3 Market Share Analysis
- 6.4 Company Profiles (includes Global level Overview, Market level overview, Core Segments, Financials as available, Strategic Information, Market Rank/Share for key companies, Products & Services, and Recent Developments)
- 6.4.1 BASF
- 6.4.2 Daicel Miraizu Ltd.
- 6.4.3 Green Millennium, Inc.
- 6.4.4 ISHIHARA SANGYO KAISHA, LTD.
- 6.4.5 KRONOS Worldwide Inc.
- 6.4.6 LB Group
- 6.4.7 Nanoptek Corp.
- 6.4.8 NIPPON SODA CO., LTD.
- 6.4.9 Resonac Holdings Corporation
- 6.4.10 TAYCA Co., Ltd.
- 6.4.11 The Chemours Company
- 6.4.12 TitanPE Technologies, Inc.
- 6.4.13 Tronox Holdings PLC
- 6.4.14 Venator Materials PLC
7 Market Opportunities & Future Outlook
- 7.1 White-Space & Unmet-Need Assessment


