

|
시장보고서
상품코드
2115023
NTRK 융합 유전자 양성 진행 고형 종양 시장 : 시장 점유율 분석, 업계 동향 및 통계, 성장 예측(2026-2031년)NTRK Fusion Gene Positive Advanced Solid Tumor - Market Share Analysis, Industry Trends & Statistics, Growth Forecasts (2026 - 2031) |
||||||
 Mordor Intelligence
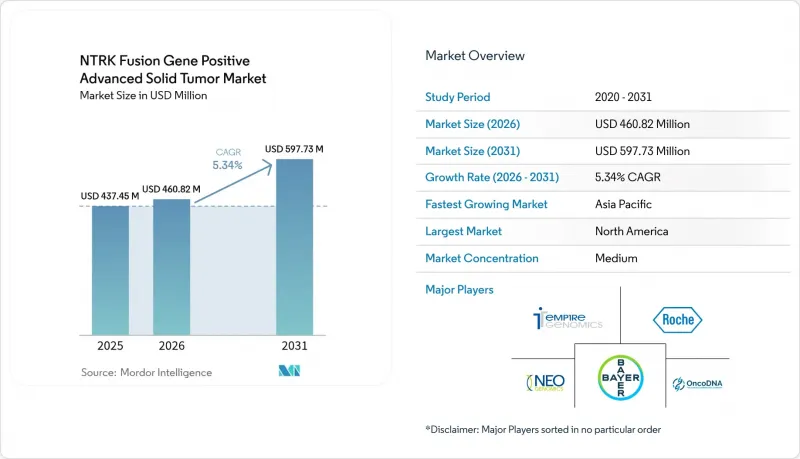
Mordor Intelligence에 의하면, NTRK 융합 유전자 양성 진행 고형 종양 시장 규모는 2025년 4억 3,745만 달러로 평가되었고, 2026년에는 4억 6,082만 달러로 추정되고, 2026-2031년 CAGR 5.34%로 성장을 지속할 전망이며, 2031년에는 5억 9,773만 달러에 이를 것으로 예측됩니다.
본 보고서는 제품 유형별(치료제(1세대 TRK 억제제 등) 및 진단제(NGS 패널 등)), 종양 발생 부위별(갑상선암, 침샘암 등), 최종 사용자별(병원 및 진료소, 암 센터 등), 그리고 지역별(북미, 유럽 등)로 분류되어 있습니다. 시장 예측은 금액(달러) 기준으로 제시되어 있습니다.
세계의 NTRK 융합 유전자 양성 진행성 고형 종양 시장 동향 및 인사이트
전 세계 암 발병률의 급증과 초기 단계에서의 분자 검사
암 유병률이 상승함에 따라 종양 전문의들은 분자 프로파일링을 조기 치료 단계로 전환하고 있습니다. 이에 따라 종양 군을 불문하고 NTRK 융합의 식별률이 향상되고 있습니다. 현재 지침에서는 순차적인 단일 유전자 검사 대신 초기 단계의 NGS 검사를 권장하고 있으며, 조직 비의존형 약물의 치료 적응 기간이 연장되고 있습니다. TruSight Oncology Comprehensive와 같은 플랫폼을 이용하면 제한된 조직에서 여러 바이오마커를 동시에 검출할 수 있으므로, 진단까지의 시간을 단축하고 치료법 선택을 신속하게 할 수 있습니다. 조기 검출로 인해 의사는 기존의 적응증 질환 이외의 영역에서도 TRK 억제제를 처방하기 쉬워졌으며, 융합률은 여전히 낮은 수준이지만 처방량은 증가하고 있습니다. 광범위한 NGS에 대한 보험 환급 제도가 성숙한 국가들, 특히 미국이나 독일에서는 검사 양성 판정 후 약물 투여 시작까지의 전환이 가장 신속하게 진행되고 있습니다. 중기적으로는 이러한 요인으로 인해 NTRK 융합 유전자 양성 진행성 고형 종양 시장이 연평균 성장률(CAGR) 기준으로 약 1.2포인트 상승할 것으로 전망됩니다.
TRK 억제제에 대한 FDA/EMA의 조직 비의존적 승인 가속화
규제 당국은 약물의 적응증을 정의하는 것은 종양의 부위가 아니라 유전체 변이라는 원칙을 지지하고 있습니다. 라로트렉티닙 및 엔트렉티닙의 초기 승인이 선례가 되어, 이 경로를 통한 추가 승인이 임상 개발 기간을 단축시키고 있습니다. 제약 기업들은 현재 여러 조직 유형에 걸친 단일 바스켓 임상시험을 추진하고 있으며, 이를 통해 임상시험 비용이 절감되고 전 세계적인 시장 출시가 가속화되고 있습니다. EMA의 동기화된 심사는 지역별 시퀀싱 장벽을 제거하여 주요 시장 전반에 걸쳐 거의 동시에 치료제에 접근할 수 있게 하고 있습니다. ROS1 양성 비소세포폐암(NSCLC)에 대한 레포트렉티닙의 2024년 승인은 바이오마커 중심 의약품에 대한 규제 당국의 수용 태도가 확대되고 있음을 보여줍니다. 이러한 접근 방식은 투자자의 신뢰를 높이고, 희귀 융합을 표적으로 하는 파이프라인 증가로 이어져 단기적으로는 시장 성장을 가속할 것입니다.
TRK 검사 및 치료의 높은 비용과 불균일한 보험 환급
NGS 패널 비용은 3,000-5,000달러에 달할 수 있으며, 융합의 유병률이 낮은 경우 이러한 지출은 지불자의 예산을 압박합니다. 민간 보험사는 더 제한적인 패널만 승인하는 경우가 많으며, 초기 선별 검사에서 NTRK 융합이 놓칠 경우 임상의는 두 번째 검사를 의뢰할 수밖에 없습니다. 환자 지원 프로그램은 일시적인 구제책이 될 수는 있지만, 제도적인 보험 급여 격차를 근본적으로 해결하는 것은 아닙니다. ‘대규모 비뇨기과 그룹 진료 협회(Large Urology Group Practice Association)’는 정밀 치료가 후기 치료 단계의 의료비를 절감한다는 이유로, 보편적인 보험 적용을 요구하며 계속해서 로비 활동을 펼치고 있습니다. 보험 환급이 안정화될 때까지는 의료 접근성 격차로 인해 전 세계 연평균 성장률(CAGR)이 0.9% 하락할 가능성이 있습니다.
부문 분석
2025년에는 치료제가 매출의 83.96%를 차지했습니다. 이는 바이오마커를 통해 선별된 환자에서 무악화 생존 기간을 개선하는 약제에 대해 지불자가 보험 적용을 할 의향이 있음을 반영합니다. 1세대 약물이 초기 매출 기준을 다졌으며, 중추신경계(CNS) 투과성 분자 파이프라인을 통해 이 부문은 꾸준한 시장 점유율 유지를 기대할 수 있습니다. NTRK 융합 유전자 양성 진행성 고형 종양 시장은 주요 시장에서 희귀질환 의약품 지정에 따른 가격 급등의 혜택을 받았습니다. 방사성 리간드나 면역관문억제제를 결합한 병용 요법은 라이프사이클 전반에 걸쳐 더 많은 선택지를 제공할 것으로 기대되므로, 치료제 부문의 연평균 성장률(CAGR) 15.55%는 여전히 타당한 수치입니다. 진단 사업은 매출의 16.04%를 차지하고 있지만, 검사의 보급으로 치료 가능한 환자층이 확대되고, 결과적으로 의약품 수요를 뒷받침함으로써 간접적인 가치를 창출하고 있습니다. 치료제와 동반 검사를 모두 판매하는 통합 기업은 규모의 경제 효과를 얻고 있으며, 가치 기반 계약 하에 제품을 번들로 제공할 수 있어 자사의 치료제 포트폴리오에 부여되는 프리미엄을 강화하고 있습니다.
진단 분야의 혁신으로 시퀀싱 비용 절감과 민감도 향상이 지속적으로 진행되고 있으며, 이는 치료제 처방에 긍정적인 선순환을 만들어내고 있습니다. NGS 패널은 단일 워크플로우 내에서 여러 변이를 평가할 수 있어 현재 진단 수익의 대부분을 차지하고 있습니다. IHC 및 FISH는 확인 검사나 고처리량 시퀀서 도입 자금을 확보할 수 없는 시설에서 여전히 이용되고 있습니다. 도입 초기 단계에 있는 액체 생검 검사는 내성 돌연변이 모니터링에서 큰 가능성을 보여주고 있으며, 조직 생검을 점차 대체해 나갈 가능성이 있습니다. 임상적 유용성을 뒷받침하는 근거가 축적됨에 따라, 보험사는 이러한 비침습적 검사에 대해 보험 급여를 적용하게 될 것이며, 이는 진단 분야의 성장을 더욱 촉진함과 동시에 간접적으로 치료 건수 증가로 이어질 것입니다.
지역별 분석
북미는 NGS에 대한 관대한 보험 급여, 성숙한 임상시험 네트워크, 그리고 조직 비의존형 패널의 가장 빠른 도입을 배경으로 2025년에는 41.90%의 점유율로 1위를 차지했습니다. 공적 보험사는 종합적인 패널에 대한 보험 적용 범위를 명확히 하고 있지만, 민간 보험사는 여전히 이용 관리 기준을 자의적으로 적용하고 있어 지역 의료 현장에서 검사가 지연될 가능성이 있습니다. 로슈의 신규 제조 및 진단 역량에 대한 500억 달러 투자를 비롯한 주요 제약사의 막대한 투자로 인해 이 지역공급망 탄력성이 강화되고 있습니다.
아시아태평양은 중국의 정밀의료 청사진과 일본의 전국적인 유전체 스크리닝 이니셔티브가 병행하여 진전되고 있어 15.05%라는 가장 높은 연평균 성장률(CAGR)을 기록하고 있습니다. 서울과 타이베이에서는 검사와 치료를 결합한 실용적인 보험 환급 모델이 확립되어 있는 반면, 인도의 민간암 치료 체인에서는 본인 부담 환자를 대상으로 광범위한 분자 프로파일링이 통합되어 있습니다. 주요 도시 이외의 지역에서는 병리 검사 역량 부족이 여전히 지속되고 있지만, 지방 정부는 기술 인력 부족을 해소하기 위한 교육에 자금을 지원하고 있습니다. 폐암 및 대장암 발병률의 급격한 상승이 검사 건수를 뒷받침하고 있으며, 보험사들은 현재 고가 의약품이 예산에 미치는 영향을 완화하기 위한 위험 분담 계약을 시범적으로 도입하고 있습니다.
유럽에서는 유럽의약품청(EMA)의 조율된 심사를 통해 신약 출시 일정이 미국과 거의 동일한 수준으로 유지되고 있어 균형 잡힌 성장을 이어가고 있습니다. 독일과 영국은 탄탄한 분자 종양 위원회를 기반으로 도입을 주도하고 있는 반면, 프랑스는 보험 급여를 결과 기반 증거와 연계하고 있습니다. 중동부 유럽 국가들은 예산 제약으로 인해 여전히 뒤처져 있지만, EU 전역에 걸친 노력을 통해 검사 품질과 데이터 공유 체계의 조화가 도모되고 있습니다. 디지털 병리 네트워크를 통해 국경을 초월한 상담이 가능해짐에 따라, 지역 내 인력 부족을 보완하는 동시에 검사 기준의 점진적인 통합을 촉진하고 있습니다. 전반적으로, 이 지역에서 비용 대비 효과에 대한 중시는 가격에 하방 압력을 가하는 한편, 검사량의 예측 가능성을 높이고 있습니다.
기타 혜택 :
- 엑셀 형식 시장 예측(ME) 시트
- 3개월간의 애널리스트 지원
자주 묻는 질문
목차
제1장 서론
제2장 조사 방법
제3장 주요 요약
제4장 시장 구도
제5장 시장 규모 및 성장 예측
제6장 경쟁 구도
제7장 시장 기회 및 향후 전망
AJY 26.08.28According to Mordor Intelligence, the NTRK fusion gene positive advanced solid tumor market size is expected to grow from USD 437.45 million in 2025 to USD 460.82 million in 2026 and is forecast to reach USD 597.73 million by 2031 at 5.34% CAGR over 2026-2031.
This report is Segmented by Product Type (Therapeutics [First-Generation TRK Inhibitors and More], and Diagnostics [NGS Panels, and More]), Tumor Origin (Thyroid Cancer, Salivary Gland Cancer, and More), End-User (Hospitals and Clinics, Cancer Centers, and More), and Geography (North America, Europe, and More). The Market Forecasts are Provided in Terms of Value (USD).
Global NTRK Fusion Gene Positive Advanced Solid Tumor Market Trends and Insights
Surging Global Cancer Incidence & Earlier-Stage Molecular Testing
Cancer prevalence is rising, and oncologists are moving molecular profiling to earlier treatment lines, which lifts the identification rate of NTRK fusions across tumor groups. Guidelines now recommend up-front NGS rather than sequential single-gene tests, lengthening the therapeutic window for tissue-agnostic agents. Platforms such as TruSight Oncology Comprehensive allow the simultaneous detection of multiple biomarkers from limited tissue, which cuts diagnostic turnaround and speeds therapy selection. Earlier detection aligns with physician comfort in prescribing TRK inhibitors outside traditional tumor labels, so prescription volumes rise even though fusion rates remain low. Countries with mature reimbursement for broad NGS, notably the US and Germany, show the fastest conversion from positive test to drug initiation. Over the medium term, the driver lifts the NTRK fusion gene positive advanced solid tumor market by an estimated 1.2 percentage points of CAGR.
Accelerated FDA/EMA Tissue-Agnostic Approvals for TRK Inhibitors
Regulators have endorsed the principle that a genomic alteration, not tumor site, can define a drug label. The initial approvals of larotrectinib and entrectinib set the precedent, and more approvals under this pathway shorten clinical development timelines. Pharmaceutical firms now pursue a single basket study across multiple histologies, which lowers trial cost and speeds global launch. The EMA's synchronised reviews remove regional sequencing barriers, enabling nearly simultaneous access across major markets. Repotrectinib's 2024 clearance for ROS1-positive NSCLC shows the expanding regulatory appetite for biomarker-centric drugs. The approach raises investor confidence, resulting in more pipelines targeting rare fusions and reinforcing market growth in the near term.
High Cost & Patchy Reimbursement for TRK Testing / Therapies
NGS panels may cost USD 3,000-5,000, an outlay that strains payer budgets when fusion prevalence is low. Private insurers often approve narrower panels, compelling clinicians to order second tests if initial screens miss an NTRK fusion. Patient assistance programs offer temporary relief but do not fix systemic reimbursement gaps. The Large Urology Group Practice Association continues to lobby for universal coverage on the grounds that precise therapy reduces later-line spending. Until reimbursement stabilises, uneven access is likely to subtract 0.9 percentage points from the global CAGR.
Other drivers and restraints analyzed in the detailed report include:
- Investment Spike in CNS-Penetrant Next-Gen TRK Inhibitors
- Rapid Adoption of NGS-Based Comprehensive Genomic Profiling
- Limited Molecular Pathology Capacity in Emerging Markets
For complete list of drivers and restraints, kindly check the Table Of Contents.
Segment Analysis
Therapeutics captured 83.96% of revenue in 2025, reflecting the willingness of payors to reimburse drugs that improve progression-free survival in biomarker-selected patients. First-generation agents created the initial revenue base, and the pipeline of CNS-penetrant molecules positions the segment for steady share retention. The NTRK fusion gene positive advanced solid tumor market benefited from surge pricing linked to orphan drug status in major markets. Combination strategies that include radioligand or immune-checkpoint blockers promise additional life-cycle options, so the therapeutic segment's 15.55% CAGR remains credible. Diagnostics, while representing 16.04% of revenue, contribute indirect value because broader testing widens the funnel of treatable patients and thus bolsters drug demand. Integrated companies that sell both a therapy and its companion test are gaining scale efficiencies and can bundle offerings under value-based contracts, reinforcing the premium attached to their therapeutic portfolios.
Diagnostic innovation continues to lower sequencing costs and raise sensitivity, creating a positive feedback loop for therapeutic prescribing. NGS panels dominate current diagnostic revenue because they assess multiple alterations within a single workflow. IHC and FISH remain for confirmation and for sites that cannot finance high-throughput sequencers. Liquid biopsy tests, still early in their adoption curve, show strong potential in monitoring for resistance mutations and may gradually cannibalise repeat tissue biopsies. As evidence of clinical utility accumulates, payors will likely align reimbursement with these less-invasive assays, further supporting diagnostic growth and indirectly raising therapy volumes.
Complete Report Scope:
- By Product Type
- Therapeutics
- First-Generation TRK Inhibitors
- Next-Generation TRK Inhibitors
- Diagnostics
- NGS Panels
- Immunohistochemistry (IHC)
- FISH
- RT-PCR
- Others
- Therapeutics
- By Tumor Origin
- Thyroid Cancer
- Salivary Gland Cancer
- Lung Cancer (NSCLC)
- Colorectal Cancer
- Others
- By End-User
- Hospitals & Clinics
- Cancer Centers
- Diagnostic Laboratories
- Others
- Geography
- North America
- United States
- Canada
- Mexico
- Europe
- Germany
- United Kingdom
- France
- Italy
- Spain
- Rest of Europe
- Asia-Pacific
- China
- Japan
- India
- South Korea
- Australia
- Rest of Asia-Pacific
- Middle East and Africa
- GCC
- South Africa
- Rest of Middle East and Africa
- South America
- Brazil
- Argentina
- Rest of South America
- North America
Geography Analysis
North America led with a 41.90% share in 2025 on the back of strong reimbursement for NGS, mature clinical trial networks, and the earliest adoption of tissue-agnostic labels. Public payors have clarified coverage for comprehensive panels, but commercial insurers continue to apply variable utilisation management criteria that can delay testing in community settings. Large pharmaceutical investments, including Roche's USD 50 billion allocation for new manufacturing and diagnostics capacity, expand supply chain resilience in the region.
Asia-Pacific posts the highest 15.05% CAGR because of parallel momentum in China's precision medicine blueprint and Japan's national genomic screening initiatives. Seoul and Taipei have demonstrated viable reimbursement models that bundle testing with therapy, while India's private oncology chains incorporate broad molecular profiling for self-pay patients. Pathology capacity gaps persist outside tier-one cities, yet regional governments are funding training to close the skills deficit. The rapid rise in lung and colorectal cancer incidence underpins test volume, and payors are now experimenting with risk-sharing deals that lower the budget impact of premium drugs.
Europe maintains balanced growth as coordinated EMA reviews keep launch timelines close to those in the United States. Germany and the United Kingdom anchor adoption with robust molecular tumour boards, while France links reimbursement to outcome-based evidence. Central and Eastern European states still lag due to budget constraints, yet EU-wide initiatives aim to harmonise test quality and data-sharing frameworks. Digital pathology networks allow cross-border consultation that compensates for local workforce shortages, supporting gradual convergence in testing standards. Overall, the region's focus on cost-effectiveness exerts down-ward pressure on price but increases volume predictability.
- Bayer
- Eli Lilly and Company
- Roche
- Bristol-Myers Squibb
- Blueprint Medicines Corp.
- Novartis
- Takeda Pharmaceutical Co.
- Regeneron Pharmaceuticals
- Pfizer
- Guardant Health
- NeoGenomics Laboratories
- Foundation Medicine Inc.
- Thermo Fisher Scientific
- QIAGEN
- Illumina
- Natera
- Caris Life Sciences
- Tempus Labs Inc.
- OncoDNA S.A.
- Empire Genomics LLC
- LGC Clinical Diagnostics (SeraCare)
- Fulgent Genetics Inc.
- Exact Sciences Corp.
Additional Benefits:
- The market estimate (ME) sheet in Excel format
- 3 months of analyst support
TABLE OF CONTENTS
1 Introduction
- 1.1 Study Assumptions & Market Definition
- 1.2 Scope of the Study
2 Research Methodology
3 Executive Summary
4 Market Landscape
- 4.1 Market Overview
- 4.2 Market Drivers
- 4.2.1 Surging Global Cancer Incidence & Earlier-Stage Molecular Testing
- 4.2.2 Accelerated FDA/EMA Tissue-Agnostic Approvals For TRK Inhibitors
- 4.2.3 Investment Spike In CNS-Penetrant Next-Gen TRK Inhibitors
- 4.2.4 Rapid Adoption Of NGS-Based Comprehensive Genomic Profiling
- 4.2.5 Breakthroughs In Liquid-Biopsy TRK Fusion Assays
- 4.2.6 Pharma-Diagnostics Codevelopment Rebates In Select Payor Contracts
- 4.3 Market Restraints
- 4.3.1 High Cost & Patchy Reimbursement For TRK Testing/Therapies
- 4.3.2 Limited Molecular Pathology Capacity In Emerging Markets
- 4.3.3 Low Oncologist Awareness Causing Sub-Optimal Clinical Uptake
- 4.3.4 On-Target Resistance Mutations Shortening Therapy Duration
- 4.4 Supply-Chain Analysis
- 4.5 Porter's Five Forces
- 4.5.1 Threat of New Entrants
- 4.5.2 Bargaining Power of Buyers
- 4.5.3 Bargaining Power of Suppliers
- 4.5.4 Threat of Substitutes
- 4.5.5 Intensity of Competitive Rivalry
5 Market Size & Growth Forecasts (Value, USD)
- 5.1 By Product Type
- 5.1.1 Therapeutics
- 5.1.1.1 First-Generation TRK Inhibitors
- 5.1.1.2 Next-Generation TRK Inhibitors
- 5.1.2 Diagnostics
- 5.1.2.1 NGS Panels
- 5.1.2.2 Immunohistochemistry (IHC)
- 5.1.2.3 FISH
- 5.1.2.4 RT-PCR
- 5.1.2.5 Others
- 5.1.1 Therapeutics
- 5.2 By Tumor Origin
- 5.2.1 Thyroid Cancer
- 5.2.2 Salivary Gland Cancer
- 5.2.3 Lung Cancer (NSCLC)
- 5.2.4 Colorectal Cancer
- 5.2.5 Others
- 5.3 By End-User
- 5.3.1 Hospitals & Clinics
- 5.3.2 Cancer Centers
- 5.3.3 Diagnostic Laboratories
- 5.3.4 Others
- 5.4 Geography
- 5.4.1 North America
- 5.4.1.1 United States
- 5.4.1.2 Canada
- 5.4.1.3 Mexico
- 5.4.2 Europe
- 5.4.2.1 Germany
- 5.4.2.2 United Kingdom
- 5.4.2.3 France
- 5.4.2.4 Italy
- 5.4.2.5 Spain
- 5.4.2.6 Rest of Europe
- 5.4.3 Asia-Pacific
- 5.4.3.1 China
- 5.4.3.2 Japan
- 5.4.3.3 India
- 5.4.3.4 South Korea
- 5.4.3.5 Australia
- 5.4.3.6 Rest of Asia-Pacific
- 5.4.4 Middle East and Africa
- 5.4.4.1 GCC
- 5.4.4.2 South Africa
- 5.4.4.3 Rest of Middle East and Africa
- 5.4.5 South America
- 5.4.5.1 Brazil
- 5.4.5.2 Argentina
- 5.4.5.3 Rest of South America
- 5.4.1 North America
6 Competitive Landscape
- 6.1 Market Concentration
- 6.2 Market Share Analysis
- 6.3 Company Profiles (includes Global level Overview, Market level overview, Core Segments, Financials as available, Strategic Information, Market Rank/Share for key companies, Products & Services, and Recent Developments)
- 6.3.1 Bayer AG
- 6.3.2 Eli Lilly & Company
- 6.3.3 F. Hoffmann-La Roche Ltd
- 6.3.4 Bristol Myers Squibb
- 6.3.5 Blueprint Medicines Corp.
- 6.3.6 Novartis AG
- 6.3.7 Takeda Pharmaceutical Co.
- 6.3.8 Regeneron Pharmaceuticals
- 6.3.9 Pfizer Inc.
- 6.3.10 Guardant Health Inc.
- 6.3.11 NeoGenomics Laboratories Inc.
- 6.3.12 Foundation Medicine Inc.
- 6.3.13 Thermo Fisher Scientific Inc.
- 6.3.14 Qiagen N.V.
- 6.3.15 Illumina Inc.
- 6.3.16 Natera Inc.
- 6.3.17 Caris Life Sciences
- 6.3.18 Tempus Labs Inc.
- 6.3.19 OncoDNA S.A.
- 6.3.20 Empire Genomics LLC
- 6.3.21 LGC Clinical Diagnostics (SeraCare)
- 6.3.22 Fulgent Genetics Inc.
- 6.3.23 Exact Sciences Corp.
7 Market Opportunities & Future Outlook
- 7.1 White-space & Unmet-Need Assessment


