|
시장보고서
상품코드
2115922
석유 저장 : 시장 점유율 분석, 산업 동향 및 통계 데이터, 성장 예측(2026-2031년)Oil Storage - Market Share Analysis, Industry Trends & Statistics, Growth Forecasts (2026 - 2031) |
||||||
 Mordor Intelligence
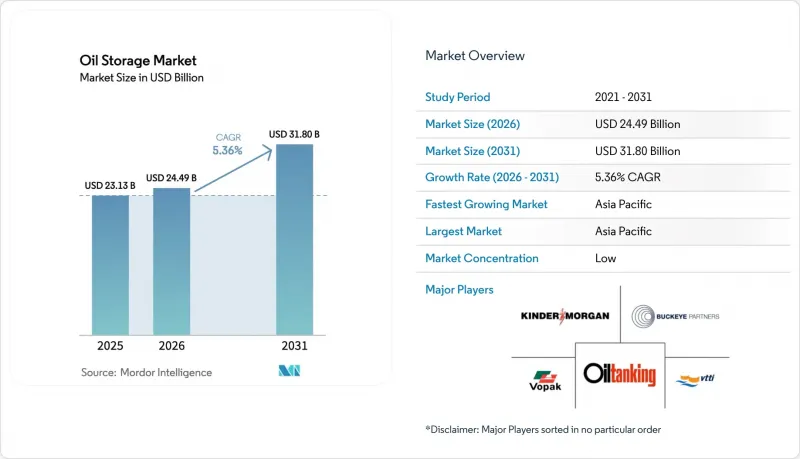
Mordor Intelligence에 의하면, 석유 저장 시장 규모는 2025년 231억 3,000만 달러로 평가되었습니다. 2026년 244억 9,000만 달러에서 2031년까지 318억 달러로 확대되어 2026년부터 2031년에 걸쳐 CAGR 5.36%를 나타낼 것으로 예측됩니다.
본 보고서는 저장 시설(지상 저장 탱크, 지하 저장 탱크), 건축자재(탄소강, 유리섬유 강화 플라스틱 등), 저장 제품(원유, 항공유 등), 용량 범위(10만 m³ 이하, 50만 m³ 초과 등),용도(석유 및 가스 생산자, 전략 석유 저장 기관 등), 지역(아시아태평양 등)
세계의 석유 저장 시장 동향 및 인사이트
전 세계 에너지 수요 및 석유 제품 소비 증가
국제에너지기구(IEA)는 아시아태평양의 항공유 수요 증가와 사하라 이남 아프리카의 디젤 연료 수요 증가를 견인 요인으로 삼아, 2026년부터 2028년에 걸쳐 석유 제품 수요가 하루 180만 배럴 증가할 것으로 예측했습니다. 인도의 산업화 가속화로 인해 2025년에는 정유시설의 처리량이 4.2% 증가했습니다. 특히, 인도 석유 공사(Indian Oil Corporation)가 구자라트주의 복합 시설에서 일일 30만 배럴의 처리 능력을 증강한 점이 두드러집니다. 2025년 초, 중국 산둥성의 탱크 팜 가동률은 92%를 넘어섰으며, 원유 수입 할당량에 비해 인프라가 따라가지 못하고 있는 실정이 부각되었습니다. 정유시설 클러스터에 인접한 사업자들은 물류 병목 현상으로 인해 ‘적시(JIT)’ 재고 전략이 불안정해지는 가운데, 견조한 요금 프리미엄을 활용하고 있습니다.
각국 정부의 전략적 석유 저장(SPR) 확충
워싱턴은 긴급 방출로 인해 재고가 1983년 이후 최저 수준인 3억 9,500만 배럴까지 감소한 것을 계기로, 2025 회계연도에 15억 달러를 배정하여 미국의 전략적 석유 저장량(SPR)을 보충했습니다. 주권 중시 에너지 정책의 일환으로 베이징의 국가 비축 용량은 2025년 말까지 약 10억 배럴에 달할 전망이며, 이는 90일 분의 순수입량에 해당합니다. 인도의 3단계에서는 찬디코르와 파두르에 총 650만 배럴이 추가되어 국가 비축량은 3,900만 배럴로 증가했습니다. 이러한 국가 차원의 조달로 인해 수요는 현물 임대에서 장기 계약으로 전환될 것이며, 무역사의 마진은 축소되겠지만 낮은 수익률을 수용하는 사업자에게는 기준선 이용률이 향상될 것입니다. 유럽연합 집행위원회는 회원국 전체에 90일 분량의 비축을 의무화할 것을 제안하고 있으며, 이로 인해 2028년까지 비축 능력이 5,000만 배럴 더 확대될 가능성이 있습니다.
AI를 활용한 탱크 팜 예측 최적화 도입
Vopak사는 2025년 싱가포르와 로테르담에서 Honeywell Forge의 분석 도구를 도입하여 예기치 못한 가동 중단 시간을 18% 줄이는 동시에 연간 요금 수입을 1,200만 달러 증가시켰습니다. Kinder Morgan사는 휴스턴 선박 수로에서 디지털 트윈 플랫폼을 시범 운영하여 트럭 적재 시 대기 시간을 1회당 22분 단축했습니다. 500만-1,000만 달러의 기술 예산을 확보할 수 있는 Tier 1 사업자만이 이러한 시스템을 확대하고 있어, 소규모 독립 사업자와의 성과 격차가 확대되고 있습니다.
부문별 분석
2025년, 석유 저장 시장 점유율의 61.8%를 지하 저장소가 차지했습니다. 이는 주로 솔트돔 지질에서는 배럴당 운영 비용이 3.50달러 정도인 반면, 지상 시스템에서는 12달러가 들기 때문입니다. 중국 황도와 저우산(舟山)에 위치한 전략 석유 저장(SPR) 기지는 연안 대수층이 국가 비축을 위해 안전하고 감시를 피하기 쉬운 저장 용량을 제공하는 좋은 예입니다. 한편, 지상 탱크는 신속한 도입 일정, 낮은 인허가 장벽, 모듈식 설계로 인해 건설 기간을 18개월로 단축할 수 있는 해상 생산 지역에서의 이용 확대에 힘입어 2031년까지 연평균 성장률(CAGR) 6.4%를 나타낼 것으로 예측됩니다.
상업 사업자에게 지상 탱크는 제품 회전율이 높고 블렌딩의 유연성이 있어 증발로 인한 손실이 크다는 단점을 상쇄할 수 있기 때문에 선호되고 있습니다. 유리섬유 강화 플라스틱(FRP) 탱크는 부식으로 인한 유지보수 부담을 줄여주어, 사워 원유나 고황분 연료유 취급 시 탄소강을 대체하는 추세가 진행되고 있습니다. 텍사스주 브라이언 마운드 및 빅 힐의 전략적 석유 저장(SPR) 동굴 저장 시설은 여전히 동굴 저장의 경제성을 상징하는 존재이지만, 2025년에 보팩(Vopak)사가 푸자이라에 FRP 탱크를 설치한 것은 상업 터미널에서의 가치 판단 변화를 시사합니다.
2025년 석유 저장 시장의 건축자재 수요 중 탄소강이 40.4%를 차지했습니다. 이는 성숙한 제조 공급망과 종합적인 API 650 인증 덕분입니다. 직경 50미터를 초과하는 대형 탱크의 경우, 여전히 비용 면에서 우위를 점하고 있습니다. 그러나 소유주들이 표면적인 설비 투자액이 아닌 전체 수명 주기의 경제성을 중시하게 됨에 따라, FRP(유리섬유 강화 플라스틱)는 연평균 성장률(CAGR) 6.9%로 성장할 것으로 전망됩니다.
수명 주기 모델링에 따르면, 30년에 걸친 강철 탱크의 총 소유 비용 중 약 35%가 부식 관리에 소요되는 반면, FRP의 경우 내부 코팅이나 음극 방식에 드는 비용이 필요하지 않습니다. 이상 스테인리스 스틸은 유황 함량이 높은 원유 저장 용도로 채택이 확대되고 있으며, 사우디 아람코는 마니파 블렌드의 특성을 고려하여 얀부 확장 프로젝트에서 이 재료를 채택했습니다. 휘발성 유기 화합물(VOC) 배출에 대한 규제 압력으로 인해, 유럽의 가솔린 및 나프타 저장 시설에서는 FRP 및 스테인리스 스틸 솔루션으로의 전환이 더욱 가속화되고 있습니다.
지역별 분석
아시아태평양은 2025년 매출의 42.3%를 차지했으며, 2024년부터 2028년에 걸쳐 총 260만 배럴/일의 정제 처리 능력 증설에 힘입어 2031년까지 연평균 성장률(CAGR) 5.8%를 유지할 전망입니다. 산둥성의 독립 정유업체들은 2024년부터 2025년에 걸쳐 저장 용량을 800만 배럴 늘렸으며, 원유 수입 할당량 증가에 따라 가동률은 90%를 상회했습니다. 인도의 제3차 전략적 석유 저장(SPR) 계획에 따라 650만 배럴 규모의 새로운 저장 동굴이 조성되어 국가 비축 총량은 3,900만 배럴에 달했으며, 2025년 순수입량 대비 국가 비축 일수는 9.5일분으로 증가했습니다. 아세안(ASEAN)의 수입 터미널은 디젤 및 제트 연료 수요 증가에 대응하기 위해 확장되었으며, 싱가포르의 주롱 섬은 계속해서 지역 허브로서의 역할을 유지했습니다.
북미는 2025년에 석유 저장 시장 점유율의 약 24%를 차지했으며, 정유시설 합리화가 걸프 코스트 수출 터미널 확장과 균형을 이루는 가운데 연평균 성장률(CAGR) 4.9%로 성장할 것으로 전망됩니다. 오클라호마주 커싱의 가동 능력은 약 7,600만 배럴이지만, 파이프라인의 역류로 인해 퍼미안 분지의 원유가 연안 정유시설로 직접 공급되게 된 결과, 2025년 중반의 가동률은 평균 62%에 그쳤습니다. 킨더 모건(Kinder Morgan)과 엔터프라이즈 프로덕츠(Enterprise Products)는 코퍼스 크리스티 및 휴스턴 주변에 1,200만 배럴 규모의 새로운 수출용 저장 시설을 증설하여 하루 400만 배럴의 원유 수출을 뒷받침하고 있습니다. 미국의 전략석유비축(SPR) 보충 프로그램은 2027년까지 1억 8,000만 배럴을 목표로 하고 있으며, 이는 수요 증가 둔화를 부분적으로 상쇄할 것으로 전망됩니다.
유럽, 중동 및 아프리카 3개 지역을 합치면 2025년 거래량의 34%를 차지하지만, 그 성장세는 지역마다 다릅니다. 유럽에서는 정유시설 폐쇄로 인해 수요가 둔화되고 있지만, 에너지 안보 노력에 따른 전략적 비축량이 증가하면서 연평균 성장률(CAGR)은 4.2%로 성장을 지속하고 있습니다. 보팩(Vopak)사는 2025년, 재생 가능 디젤 및 LNG에서 액체 연료로의 전환 거래를 처리하기 위해 로테르담에 200만 배럴 규모의 저장 시설을 증설했습니다. 중동은 사우디 아람코와 ADNOC의 다운스트림 부문 통합에 더해, 지역 간 벙커링 센터로서의 푸자이라의 발전으로 인해 연평균 성장률(CAGR) 6.1%라는 더욱 강력한 성장세를 보이고 있습니다. 아프리카의 처리 능력 확대는 나이지리아, 앙골라, 이집트를 중심으로 진행되고 있으며, 국내 정제 능력이 소비량을 따라가지 못하는 지역에서는 해상 생산 저장 시설과 제품 수입 터미널 간의 균형이 유지되고 있습니다.
기타 혜택 :
- 엑셀 형식 시장 예측(ME) 시트
- 3개월간의 애널리스트 지원
자주 묻는 질문
목차
제1장 서론
제2장 분석 방법
제3장 개요
제4장 시장 구도
제5장 시장 규모 및 성장률 예측
제6장 경쟁 구도
제7장 시장 기회 및 향후 전망
KTH 26.08.31According to Mordor Intelligence, the oil storage market size is projected to expand from USD 23.13 billion in 2025 and USD 24.49 billion in 2026 to USD 31.80 billion by 2031, registering a CAGR of 5.36% between 2026 to 2031.
This report is Segmented by Storage Facility (Above Ground Storage Tanks and Underground Storage Tanks), Construction Material (Carbon Steel, Fiberglass-Reinforced Plastic, and More), Product Stored (Crude Oil, Aviation Fuel, and More), Capacity Range (Up To 100k M3, Above 500k M3, and More), Application (Oil and Gas Producers, Strategic Petroleum Reserve Agencies, and More) and Geography (Asia-Pacific, and More)
Global Oil Storage Market Trends and Insights
Rising Global Energy Demand and Petroleum-Product Consumption
The International Energy Agency (IEA) expects petroleum-product demand to expand by 1.8 million b/d between 2026 and 2028, led by aviation-fuel growth in Asia-Pacific and diesel in sub-Saharan Africa. Accelerating industrialization in India drove a 4.2% increase in refinery throughput during 2025, highlighted by Indian Oil Corporation's 300,000 b/d capacity addition at its Gujarat complex. Tank-farm utilization in China's Shandong province surpassed 92% in early 2025, underscoring infrastructure lag relative to crude-import quotas. Operators co-located with refinery clusters leverage resilient tariff premiums as just-in-time inventory strategies become fragile under logistics stress.
Strategic Petroleum Reserve Build-Outs by Governments
Washington allocated USD 1.5 billion in fiscal 2025 to replenish the U.S. SPR after emergency releases depleted inventories to 395 million barrels, its lowest level since 1983. Beijing's state reserve capacity reached roughly 1.0 billion barrels by end-2025, equal to 90 days of net imports, as part of a sovereignty-focused energy agenda. India's third phase added 6.5 million barrels across Chandikhol and Padur, lifting national reserves to 39 million barrels. These sovereign procurements pivot demand from spot leasing toward long-term tariffs, trimming merchant margins yet lifting baseline utilization for operators that accept lower returns. A European Commission proposal to mandate 90-day cover across member states could stimulate another 50 million barrels of capacity before 2028.
AI-Driven Predictive Tank-Farm Optimization Adoption
Vopak deployed Honeywell Forge analytics across Singapore and Rotterdam in 2025, trimming unplanned downtime by 18% and boosting annual tariff revenue by USD 12 million. Kinder Morgan piloted a digital-twin platform at the Houston Ship Channel, lowering truck-loading queues by 22 minutes per transaction. Only Tier-1 operators with access to USD 5-10 million technology budgets are scaling such systems, widening the performance gap with smaller independents.
Other drivers and restraints analyzed in the detailed report include:
- Volatile Crude-Oil Prices Increasing Commercial Stock-Holding
- Growing Refinery Throughput in Emerging Economies
- Modular Floating Storage Units for Offshore Production Zones
For complete list of drivers and restraints, kindly check the Table Of Contents.
Segment Analysis
Underground caverns controlled 61.8% of the oil storage market share in 2025, largely because salt-dome geology yields operating costs near USD 3.50 per barrel versus USD 12 for above-ground systems. China's Huangdao and Zhoushan SPR sites illustrate how coastal aquifers provide secure, surveillance-resistant capacity for sovereign reserves. Above-ground tanks, however, are projected to log a 6.4% CAGR through 2031, driven by rapid-deployment schedules, lower permitting barriers, and growing use in offshore production zones where modular designs shorten construction to 18 months.
Commercial operators favor above-ground tanks because higher product turnover and blending flexibility offset their larger evaporation losses. Fiberglass-reinforced plastic vessels are winning conversions from carbon steel in sour-crude and high-sulfur fuel-oil service thanks to reduced corrosion maintenance. The Bryan Mound and Big Hill SPR caverns in Texas remain emblematic of cavern economics, yet Vopak's 2025 installation of FRP vessels at Fujairah signals a shifting value calculus for commercial terminals.
Carbon steel accounted for 40.4% of construction-material demand within the oil storage market size in 2025 because of mature fabrication supply chains and comprehensive API 650 certification. It stays cost-advantaged for large-diameter tanks above 50 meters. Still, fiberglass-reinforced plastic is slated to grow at 6.9% CAGR as owners weigh full lifecycle economics rather than headline capex.
Lifecycle modeling shows corrosion management consumes roughly 35% of a steel tank's total ownership cost over 30 years, whereas FRP eliminates internal coating and cathodic-protection budgets. Duplex stainless steel is gaining traction in sulfur-rich crude service; Saudi Aramco opted for that material in its Yanbu expansion to anticipate Manifa blend properties. Regulatory pressure on volatile organic compound emissions further tilts European gasoline and naphtha storage toward FRP and stainless steel solutions.
Complete Report Scope:
- By Storage Facility
- Above Ground Storage Tanks (ASTs)
- Underground Storage Tanks (USTs)
- By Construction Material
- Carbon Steel
- Stainless Steel
- Fiberglass-Reinforced Plastic
- Composites and Others
- By Product Stored
- Crude Oil
- Gasoline & Naphtha
- Diesel & Middle Distillates
- Aviation Fuel
- Others (Fuel Oil, LPG, etc.)
- By Capacity Range
- Up to 100k m3
- 100 to 250k m3
- 250 to 500k m3
- Above 500k m3
- By Application
- Oil and Gas Producers
- Refineries
- Traders and Distributors
- Petrochemical and Industrial Users
- Strategic Petroleum Reserve Agencies (SPRs)
- By Geography
- North America
- United States
- Canada
- Mexico
- Europe
- Germany
- United Kingdom
- France
- Italy
- Spain
- NORDIC Countries
- Russia
- Rest of Europe
- Asia-Pacific
- China
- India
- Japan
- South Korea
- ASEAN Countries
- Australia and New Zealand
- Rest of Asia-Pacific
- South America
- Brazil
- Argentina
- Colombia
- Rest of South America
- Middle East and Africa
- Saudi Arabia
- United Arab Emirates
- South Africa
- Egypt
- Rest of Middle East and Africa
- North America
Geography Analysis
Asia-Pacific controlled 42.3% of 2025 revenue and will sustain a 5.8% CAGR through 2031, led by refinery throughput additions totaling 2.6 million b/d between 2024 and 2028. Independent refiners in Shandong province lifted storage capacity by 8 million barrels during 2024-2025, yet utilization stayed above 90% amid higher crude-import quotas. India's third SPR phase delivered 6.5 million barrels of new caverns, bringing total sovereign reserves to 39 million barrels and raising national cover to 9.5 days of 2025 net imports. ASEAN import terminals expanded to meet rising diesel and jet-fuel needs, with Singapore's Jurong Island retaining its role as a regional hub.
North America captured roughly 24% oil storage market share in 2025 and is expected to grow at a 4.9% CAGR as refinery rationalization balances Gulf Coast export-terminal expansion. Cushing, Oklahoma's working capacity sits near 76 million barrels, yet utilization averaged only 62% in mid-2025 after pipeline reversals routed Permian flows directly to coastal refineries. Kinder Morgan and Enterprise Products added 12 million barrels of new export storage around Corpus Christi and Houston to support 4 million b/d of outbound crude. The U.S. SPR refill program targets 180 million barrels by 2027, partially offsetting slower demand growth.
Europe, the Middle East, and Africa together generated 34% of the 2025 turnover with varying momentum. Europe advances at 4.2% CAGR as refinery closures moderate demand but energy-security initiatives lift strategic stocks. Vopak added 2 million barrels at Rotterdam in 2025 to serve renewable diesel and LNG-to-liquids trades. The Middle East exhibits stronger growth at 6.1% CAGR thanks to downstream integration by Saudi Aramco and ADNOC, alongside Fujairah's expansion as an inter-regional bunkering center. Africa's capacity builds cluster around Nigeria, Angola, and Egypt, balancing offshore production storage with product import terminals where domestic refining lags consumption.
- Koninklijke Vopak NV
- Oiltanking GmbH
- Vitol Tank Terminals International (VTTI)
- Kinder Morgan Inc.
- Buckeye Partners L.P.
- Magellan Midstream Partners L.P.
- NuStar Energy L.P.
- Rubis Terminal
- Horizon Terminals Ltd.
- Gulf Petrochem FZC (GP Terminal)
- McDermott International Inc.
- Fluor Corporation
- China National Petroleum Corporation
- Saudi Aramco (including Aramco Trading & Terminals)
- PetroChina Company Ltd.
- ERGIL Group
- T.F. Warren Group
- Shawcor Ltd.
- Chemie Tech Group
- INCO Group
- Heavy Engineering Industries & Shipbuilding (HEISCO)
- Stolthaven Terminals
Additional Benefits:
- The market estimate (ME) sheet in Excel format
- 3 months of analyst support
TABLE OF CONTENTS
1 Introduction
- 1.1 Study Assumptions & Market Definition
- 1.2 Scope of the Study
2 Research Methodology
3 Executive Summary
4 Market Landscape
- 4.1 Market Overview
- 4.2 Market Drivers
- 4.2.1 Rising global energy demand & petroleum-product consumption
- 4.2.2 Strategic petroleum reserve build-outs by governments
- 4.2.3 Volatile crude-oil prices increasing commercial stock-holding
- 4.2.4 Growing refinery throughput in emerging economies
- 4.2.5 AI-driven predictive tank-farm optimisation adoption
- 4.2.6 Modular floating storage units for offshore production zones
- 4.3 Market Restraints
- 4.3.1 Energy-transition-led decline in fossil-fuel share
- 4.3.2 High capex & lengthy permitting for new terminals
- 4.3.3 Cyber-insurance mandates inflating OPEX
- 4.3.4 Coastal-zoning land scarcity near deep-water ports
- 4.4 Supply-Chain Analysis
- 4.5 Regulatory Landscape
- 4.6 Technological Outlook
- 4.7 Porter's Five Forces
- 4.7.1 Bargaining Power of Suppliers
- 4.7.2 Bargaining Power of Consumers
- 4.7.3 Threat of New Entrants
- 4.7.4 Threat of Substitute Products & Services
- 4.7.5 Intensity of Competitive Rivalry
5 Market Size & Growth Forecasts
- 5.1 By Storage Facility
- 5.1.1 Above Ground Storage Tanks (ASTs)
- 5.1.2 Underground Storage Tanks (USTs)
- 5.2 By Construction Material
- 5.2.1 Carbon Steel
- 5.2.2 Stainless Steel
- 5.2.3 Fiberglass-Reinforced Plastic
- 5.2.4 Composites and Others
- 5.3 By Product Stored
- 5.3.1 Crude Oil
- 5.3.2 Gasoline & Naphtha
- 5.3.3 Diesel & Middle Distillates
- 5.3.4 Aviation Fuel
- 5.3.5 Others (Fuel Oil, LPG, etc.)
- 5.4 By Capacity Range
- 5.4.1 Up to 100k m3
- 5.4.2 100 to 250k m3
- 5.4.3 250 to 500k m3
- 5.4.4 Above 500k m3
- 5.5 By Application
- 5.5.1 Oil and Gas Producers
- 5.5.2 Refineries
- 5.5.3 Traders and Distributors
- 5.5.4 Petrochemical and Industrial Users
- 5.5.5 Strategic Petroleum Reserve Agencies (SPRs)
- 5.6 By Geography
- 5.6.1 North America
- 5.6.1.1 United States
- 5.6.1.2 Canada
- 5.6.1.3 Mexico
- 5.6.2 Europe
- 5.6.2.1 Germany
- 5.6.2.2 United Kingdom
- 5.6.2.3 France
- 5.6.2.4 Italy
- 5.6.2.5 Spain
- 5.6.2.6 NORDIC Countries
- 5.6.2.7 Russia
- 5.6.2.8 Rest of Europe
- 5.6.3 Asia-Pacific
- 5.6.3.1 China
- 5.6.3.2 India
- 5.6.3.3 Japan
- 5.6.3.4 South Korea
- 5.6.3.5 ASEAN Countries
- 5.6.3.6 Australia and New Zealand
- 5.6.3.7 Rest of Asia-Pacific
- 5.6.4 South America
- 5.6.4.1 Brazil
- 5.6.4.2 Argentina
- 5.6.4.3 Colombia
- 5.6.4.4 Rest of South America
- 5.6.5 Middle East and Africa
- 5.6.5.1 Saudi Arabia
- 5.6.5.2 United Arab Emirates
- 5.6.5.3 South Africa
- 5.6.5.4 Egypt
- 5.6.5.5 Rest of Middle East and Africa
- 5.6.1 North America
6 Competitive Landscape
- 6.1 Market Concentration
- 6.2 Strategic Moves (M&A, Partnerships, PPAs)
- 6.3 Market Share Analysis (Market Rank/Share for key companies)
- 6.4 Company Profiles (includes Global level Overview, Market level overview, Core Segments, Financials as available, Strategic Information, Products & Services, and Recent Developments)
- 6.4.1 Koninklijke Vopak NV
- 6.4.2 Oiltanking GmbH
- 6.4.3 Vitol Tank Terminals International (VTTI)
- 6.4.4 Kinder Morgan Inc.
- 6.4.5 Buckeye Partners L.P.
- 6.4.6 Magellan Midstream Partners L.P.
- 6.4.7 NuStar Energy L.P.
- 6.4.8 Rubis Terminal
- 6.4.9 Horizon Terminals Ltd.
- 6.4.10 Gulf Petrochem FZC (GP Terminal)
- 6.4.11 McDermott International Inc.
- 6.4.12 Fluor Corporation
- 6.4.13 China National Petroleum Corporation
- 6.4.14 Saudi Aramco (including Aramco Trading & Terminals)
- 6.4.15 PetroChina Company Ltd.
- 6.4.16 ERGIL Group
- 6.4.17 T.F. Warren Group
- 6.4.18 Shawcor Ltd.
- 6.4.19 Chemie Tech Group
- 6.4.20 INCO Group
- 6.4.21 Heavy Engineering Industries & Shipbuilding (HEISCO)
- 6.4.22 Stolthaven Terminals
7 Market Opportunities & Future Outlook
- 7.1 White-space & Unmet-Need Assessment