

|
시장보고서
상품코드
2116114
북미의 장거리 운송 : 시장 점유율 분석, 업계 동향 및 통계, 성장 예측(2026-2031년)North America Long-haul Transport - Market Share Analysis, Industry Trends & Statistics, Growth Forecasts (2026 - 2031) |
||||||
 Mordor Intelligence
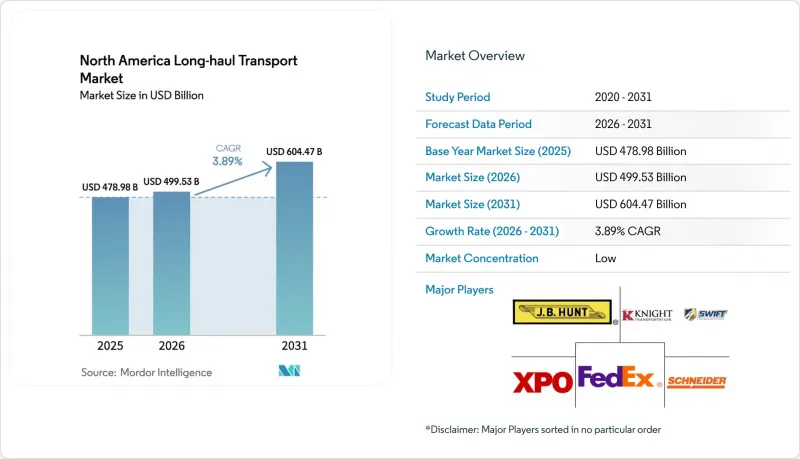
Mordor Intelligence에 의하면, 북미의 장거리 운송 시장 규모는 2025년 4,789억 8,000만 달러로 평가되었습니다. 2026년에는 4,995억 3,000만 달러로 확대되어 2031년까지 6,044억 7,000만 달러에 이를 것으로 예상되고 2026-2031년에 걸쳐 CAGR 3.89%로 성장할 전망입니다.
본 보고서는 최종 사용자 산업별(농업, 건설, 제조업, 석유 및 가스,도매·소매업, 기타), 목적지별(국내·국제), 트럭 적재량별(FTL·LTL), 컨테이너화별, 화물 구성별, 온도 관리별, 국가별(미국, 캐나다, 멕시코, 기타)로 분류되어 있습니다. 시장 예측은 금액(달러)으로 표시되어 있습니다.
북미의 장거리 운송 시장 동향 및 인사이트
전자상거래 소포 처리량의 급증
2024년, 미국의 온라인 소매 매출액은 1조 1,400억 달러에 달했으며, 소포 처리량은 210억 개를 돌파했습니다. 이에 따라 운송사들은 장거리 운송 구간을 재편하고, 운전자가 자택에서 가까운 곳에서 운행할 수 있는 릴레이 방식으로 전환할 수밖에 없었습니다. 통합형 특송 사업자들은 시간당 120만 개를 처리할 수 있는 자동화 허브에 막대한 투자를 단행하여 북미의 장거리 운송 시장 전체의 서비스 수준을 높였습니다. 이에 반해, 트럭 로드(풀 트럭) 운송 사업자들은 AI를 활용한 경로 최적화 도구를 도입하여 2025년 초에는 공차율을 4포인트 줄여 14%로 억제했습니다. 소량·고빈도 운송으로의 전환에 따라 LTL(소량 혼재) 터미널의 처리량은 증가했으나, 1파운드당 0.08-0.12달러의 추가 처리 비용이 발생했습니다. 옴니채널 모델에 따라 매장 수령과 자택 배송이 융합됨에 따라, 총 화물 톤수에서 전자상거래가 차지하는 비중은 2028년까지 20% 전후로 안정될 것으로 예측됩니다.
제조업의 국내 복귀(리쇼어링) 및 인접 국가로의 이전(니어쇼어링)
2024년, 미국의 제조업 건설 투자액은 2,280억 달러로 두 배로 증가했습니다. 이는 주로 반도체, 배터리, 제약 관련 프로젝트에 기인한 것으로, 공급망을 30일간의 해상 운송에서 3일간의 트럭 운송으로 단축하는 것입니다. 같은 해, 멕시코는 360억 달러의 외국인 직접 투자를 유치했으며, 누에보 레온주와 과나후아토주의 공장에서는 USMCA 원산지 규정에 따라 와이어 하네스와 배터리 모듈이 미국으로 공급되고 있습니다. 2025년 3월, 국경을 넘는 트럭 화물 운송액은 사상 최고치인 479억 달러에 달하여, 운송 경로에 대한 수요가 견조함을 입증했습니다. 리쇼어링으로 인해 운송 빈도와 복잡성이 증가하고 있어, 보세 야드를 운영하며 드레이지, 창고 보관, 장거리 운송 서비스를 일괄적으로 제공하는 운송업체에 이점이 주어지고 있습니다. 소규모 포워더들은 이러한 통합형 서비스를 따라잡는 데 어려움을 겪고 있어, 북미의 장거리 운송 시장에서 통합이 진행되고 있습니다.
심각한 운전기사 부족과 임금 상승
은퇴자 증가로 인해 2025년에는 6만-8만 명의 운전기사 부족이 발생했으며, 대규모 트럭 운송 사업자의 이직률은 90%를 계속 상회하고, 급여 중앙값은 6만 2,000달러까지 치솟았습니다. 연방 클리어링 하우스에 의한 자격 박탈로 인해 2024년 말까지 상업용 운전면허 소지자 총수의 2.5%에 해당하는 운송 능력이 상실되었습니다. 채용 비용은 신규 채용 1인당 최대 1만 2,000달러까지 급등하여 중소 운송업체의 이익률을 압박했습니다. 자율주행 트럭의 시범 운행은 2024년에 250만 상업 주행 마일을 기록했으나, 시범 사업을 넘어선 규모의 확대에는 책임 체계에 관한 규제 제정이 이루어져야 합니다. 인력 부족이 지속되는 가운데, 계약 운임은 견조한 추세를 보이고 있어 화물 수요가 부진한 시기에도 북미의 장거리 운송 시장을 계속 지탱하고 있습니다.
부문별 분석
2025년, 제조업은 북미의 장거리 운송 시장 점유율의 32.30%를 차지했으며, 통합된 조립 회랑으로의 자동차 및 기계의 안정적인 흐름을 반영하고 있습니다. 도매·소매업은 소매업체들이 라스트 마일 배송을 신속하게 처리하기 위해 지역 내 풀필먼트 센터 간 재고를 재분배하고 있기 때문에 4.41%의 연평균 성장률(CAGR, 2026-2031년)로 성장을 주도하고 있습니다. 농업 부문에서는 중서부(미드웨스트)의 엘리베이터에서 멕시코만 연안의 수출 터미널로 향하는 곡물의 벌크 운송이 여전히 주요 운송 형태로 자리 잡고 있습니다. 한편, 건설 부문의 운송량은 연방 정부가 자금을 지원하는 인프라 정비 사업으로 인해 6.8% 증가했습니다. 석유 및 가스, 광업, 채석업은 에너지 생산량이 정체되고 천연가스 가격이 부진함에 따라 2.1% 감소했으나, 반도체 제조와 관련된 화학제품 운송을 담당하는 액체 운송용 탱커가 이러한 부진을 부분적으로 상쇄했습니다. 의료 및 가전제품을 포함한 기타 다양한 업종은 GDP의 전반적인 성장세와 보조를 맞췄습니다.
리쇼어링으로 인해 중간재 물류가 꾸준히 증가하고 있으며, 이에 따라 제조업체들은 재공 재고를 줄이기 위해 소량 혼재 운송(LTL)의 운행 빈도를 높이고 있습니다. ‘규정 준수·안전·책임(CSA)’ 프로그램에 따른 안전 감사로 인해 운송업체 선정 기준이 엄격해졌으며, 높은 평가를 받은 운송업체가 가격만을 경쟁 수단으로 삼는 경쟁사보다 유리한 입지를 점하고 있습니다. 전자상거래에 의한 소매 수입은 특히 서쪽에서 동쪽으로 향하는 항만에서 내륙으로의 운송 노선에서 도매 부문의 성장세를 지속적으로 뒷받침하고 있습니다. 2026년 이후 재정 지원이 축소됨에 따라 건설 관련 화물 운송은 정상화될 것으로 보이지만, 도매 채널을 통해 구축된 다각적인 기반 덕분에 북미의 장거리 운송 시장은 특정 부문에서 비롯된 충격으로부터 보호받고 있습니다.
2025년 매출액 중 국내 노선이 62.51%를 차지했습니다. 이는 반경 500마일 이내에 밀집해 있는 제조업 클러스터와 대규모 소비 거점이 견인한 결과입니다. 국제 운송량은 USMCA(미국·멕시코·캐나다 협정) 준수로 인해 남북 간 부품 운송이 증가함에 따라, 2026년부터 2031년까지 연평균 성장률(CAGR) 4.47%로 확대될 것으로 예측됩니다. 2025년 3월 국경을 넘는 화물 운송액은 479억 달러에 달했으며, 이는 리드타임 단축과 재고 비용 절감으로 이어지는 멕시코와 미국 간의 지속적인 물류 흐름을 여실히 보여주었습니다. 같은 달 캐나다행 운송액은 368억 달러로, 목재, 자동차 부품, 에너지 제품 등 다양한 품목의 양방향 운송량이 두드러졌습니다.
라레도, 엘파소, 디트로이트 근교의 보세 창고는 일반 간선 운송보다 높은 요금을 책정할 수 있는 통합 솔루션을 가능하게 합니다. 환율 리스크는 복잡성을 수반하지만, 여러 통화 단위로 자동 청구서 발행 체계를 갖춘 운송업체에게는 이익률 향상 기회가 됩니다. 국내 화물 운송은 운전자의 이직률 상승에 영향을 받기 쉬운 반면, 국제 노선에서는 통관 병목 현상이 여전히 가장 큰 리스크로 남아 있습니다. 멕시코와 캐나다의 전자운행기록장치(ELD) 기준 조화로 인해 국경에서의 체류 시간이 단축되고 자산 회전율이 향상되어, 국경을 넘는 운송을 전문으로 하는 사업자에게 북미의 장거리 운송 시장 전망이 밝아지고 있습니다.
기타 혜택
- 엑셀 형식 시장 예측(ME) 시트
- 3개월간의 애널리스트 지원
자주 묻는 질문
목차
제1장 서론
제2장 조사 방법
제3장 개요
제4장 시장 구도
제5장 시장 규모 및 성장 예측
제6장 경쟁 구도
제7장 시장 기회 및 향후 전망
KTH 26.08.31According to Mordor Intelligence, the North America long-haul transport market size is expected to increase from USD 478.98 billion in 2025 to USD 499.53 billion in 2026 and reach USD 604.47 billion by 2031, growing at a CAGR of 3.89% over 2026-2031.
This report is Segmented by End User Industry (Agriculture, Construction, Manufacturing, Oil and Gas, Wholesale and Retail Trade, and Others), Destination (Domestic and International), Truckload Specification (FTL and LTL), Containerization, Goods Configuration, Temperature Control, and Geography (United States, Canada, Mexico, and More). The Market Forecasts are in Value (USD).
North America Long-haul Transport Market Trends and Insights
E-commerce Parcel Volume Surge
United States online retail sales touched USD 1.14 trillion in 2024, driving parcel counts past 21 billion units and forcing carriers to restructure linehaul legs into relay runs that keep drivers closer to home. Integrated express players invested heavily in automated hubs capable of processing 1.2 million pieces per hour, raising service benchmarks for the broader North America long-haul transport market. Truckload fleets responded by embedding AI route-optimization tools that trimmed empty-mile ratios four points to 14% in early 2025. The mix shift toward smaller, more frequent shipments expanded LTL terminal traffic but added handling costs of USD 0.08 to USD 0.12 per pound. E-commerce share of total freight tonnage is projected to stabilize near 20% by 2028 as omnichannel models blend store pickups with home deliveries.
Manufacturing Reshoring and Near-Shoring
United States manufacturing construction outlays doubled to USD 228 billion in 2024, largely for semiconductor, battery, and pharmaceutical projects that shorten supply chains from 30-day ocean legs to three-day truck hauls. Mexico attracted USD 36 billion in foreign direct investment the same year, with plants in Nuevo Leon and Guanajuato funneling wire harnesses and battery modules northbound under USMCA content rules. Cross-border truck freight hit a record USD 47.9 billion in March 2025, underscoring resilient lane demand. Reshoring lifts shipment frequency and complexity, rewarding carriers that operate bonded yards and offer bundled drayage, warehousing, and linehaul services. Smaller brokers struggle to match this integrated suite, spurring consolidation in the North America long-haul transport market.
Acute Driver Shortage and Wage Inflation
Retirements accelerated a shortfall that reached 60,000 to 80,000 drivers in 2025, keeping turnover above 90% at large truckload fleets and pushing median pay to USD 62,000. Federal clearinghouse disqualifications removed capacity equal to 2.5% of the commercial-license pool by year-end 2024. Recruiting costs soared to as high as USD 12,000 per new hire, which squeezed smaller carriers' margins. Autonomous truck trials logged 2.5 million commercial miles in 2024 yet await rulemaking on liability frameworks before scaling beyond pilots. As the labor gap persists, contract rates remain sticky, underpinning the North America long-haul transport market even in periods of soft freight demand.
Other drivers and restraints analyzed in the detailed report include:
- Cross-Border Trade Growth under USMCA
- Cold-Chain Pharma and Biologics Expansion
- Volatile Diesel Prices
For complete list of drivers and restraints, kindly check the Table Of Contents.
Segment Analysis
Manufacturing generated 32.30% of the North America long-haul transport market share in 2025, reflecting consistent automotive and machinery flows into integrated assembly corridors. Wholesale and Retail Trade leads growth at a 4.41% CAGR (2026-2031) as retailers redistribute inventory across regional fulfillment centers for faster final-mile execution. Agriculture continues to rely on bulk grain moves from Midwest elevators to Gulf export terminals, while construction traffic rose 6.8% on federally funded infrastructure work. Oil and Gas, Mining, and Quarrying softened 2.1% due to flat energy output and subdued natural-gas pricing, but fluid-grade tanker carriers partially offset weakness through chemical shipments tied to semiconductor fabrication. Other diversified verticals, including health care and consumer electronics, aligned with broader GDP expansions.
Reshoring has steadily increased intermediate-goods flows, prompting manufacturers to contract more frequent LTL runs that reduce in-process inventory. Safety audits under the Compliance, Safety, Accountability (CSA) program sharpen carrier selection criteria, elevating well-scored fleets above price-only competitors. E-commerce retail imports continue to reinforce the wholesale segment's momentum, especially on west-to-east, port-to-inland corridors. As fiscal support cools post-2026, construction freight is likely to normalize, yet the diversified base built by the wholesale channel keeps the North America long-haul transport market insulated from sector-specific shocks.
Domestic lanes comprised 62.51% of 2025 revenue, driven by dense manufacturing clusters and large consumption centers located within a 500-mile radius. International traffic is forecast to expand at a 4.47% CAGR (2026-2031) as USMCA compliance embeds more north-south component shipments. March 2025 cross-border freight tallied USD 47.9 billion, underlining sustained Mexico-United States flows that shorten lead times and cut inventory costs. Canadian traffic of USD 36.8 billion in the same month emphasized diversified bidirectional volumes of lumber, auto parts, and energy products.
Bonded warehousing near Laredo, El Paso, and Detroit allows integrated solutions that command premiums over plain linehaul. Currency-exchange exposure introduces complexity but offers margin plays for carriers with automated invoicing in multiple denominations. Domestic freight faces higher exposure to driver turnover, while customs bottlenecks remain the prime risk on international lanes. Harmonized electronic-logging-device standards across Mexico and Canada reduce border dwell times and improve asset turns, strengthening the North America long-haul transport market outlook for cross-border specialists.
Complete Report Scope:
- End User Industry
- Agriculture, Fishing, and Forestry
- Construction
- Manufacturing
- Oil and Gas, Mining and Quarrying
- Wholesale and Retail Trade
- Others
- Destination
- Domestic
- International
- Truckload Specification
- Full-Truck-Load (FTL)
- Less than-Truck-Load (LTL)
- Containerization
- Containerized
- Non-Containerized
- Goods Configuration
- Fluid Goods
- Solid Goods
- Temperature Control
- Non-Temperature Controlled
- Temperature Controlled
- Country
- United States
- Canada
- Mexico
- Rest of North America
List of Companies Covered in this Report:
- A.P. Moller - Maersk
- ArcBest
- C.H. Robinson
- Canada Cartage
- CMA CGM Group (including CEVA Logistics)
- DHL Group
- DSV A/S (De Sammensluttede Vognmand af Air and Sea)
- FedEx
- J.B. Hunt Transport, Inc.
- Knight-Swift Transportation Holdings, Inc.
- Landstar System, Inc.
- Old Dominion Freight Line
- Penske Corporation
- Ryder System, Inc.
- Schneider National, Inc.
- Transportes Marva
- Traxion
- United Parcel Service of America, Inc. (UPS)
- Werner Enterprises Inc.
- XPO, Inc.
Additional Benefits:
- The market estimate (ME) sheet in Excel format
- 3 months of analyst support
TABLE OF CONTENTS
1 Introduction
- 1.1 Study Assumptions and Market Definition
- 1.2 Scope of the Study
2 Research Methodology
3 Executive Summary
4 Market Landscape
- 4.1 Market Overview
- 4.2 GDP Distribution by Economic Activity
- 4.3 GDP Growth by Economic Activity
- 4.4 Economic Performance and Profile
- 4.4.1 Trends in E-Commerce Industry
- 4.4.2 Trends in Manufacturing Industry
- 4.5 Transport and Storage Sector GDP
- 4.6 Logistics Performance
- 4.7 Length of Roads
- 4.8 Export Trends
- 4.9 Import Trends
- 4.10 Fuel Pricing Trends
- 4.11 Trucking Operational Costs
- 4.12 Trucking Fleet Size by Type
- 4.13 Major Truck Suppliers
- 4.14 Road Freight Tonnage Trends
- 4.15 Road Freight Pricing Trends
- 4.16 Modal Share
- 4.17 Inflation
- 4.18 Regulatory Framework
- 4.19 Value Chain and Distribution Channel Analysis
- 4.20 Market Drivers
- 4.20.1 E-Commerce Parcel Volume Surge
- 4.20.2 Manufacturing Reshoring and Near-Shoring
- 4.20.3 Cross-Border Trade Growth under USMCA
- 4.20.4 Cold-Chain Pharma and Biologics Expansion
- 4.20.5 Engine and Aerodynamics Fuel-Efficiency Gains
- 4.20.6 AI-Enabled Back-Haul and Load-Matching Platforms
- 4.21 Market Restraints
- 4.21.1 Acute Driver Shortage and Wage Inflation
- 4.21.2 Volatile Diesel Prices
- 4.21.3 Escalating Bridge and Highway Tolls
- 4.21.4 ESG-Driven Early Fleet-Electrification CAPEX
- 4.22 Technology Innovations in the Market
- 4.23 Porter's Five Forces Analysis
- 4.23.1 Threat of New Entrants
- 4.23.2 Bargaining Power of Buyers
- 4.23.3 Bargaining Power of Suppliers
- 4.23.4 Threat of Substitutes
- 4.23.5 Competitive Rivalry
5 Market Size and Growth Forecasts (Value, USD)
- 5.1 End User Industry
- 5.1.1 Agriculture, Fishing, and Forestry
- 5.1.2 Construction
- 5.1.3 Manufacturing
- 5.1.4 Oil and Gas, Mining and Quarrying
- 5.1.5 Wholesale and Retail Trade
- 5.1.6 Others
- 5.2 Destination
- 5.2.1 Domestic
- 5.2.2 International
- 5.3 Truckload Specification
- 5.3.1 Full-Truck-Load (FTL)
- 5.3.2 Less than-Truck-Load (LTL)
- 5.4 Containerization
- 5.4.1 Containerized
- 5.4.2 Non-Containerized
- 5.5 Goods Configuration
- 5.5.1 Fluid Goods
- 5.5.2 Solid Goods
- 5.6 Temperature Control
- 5.6.1 Non-Temperature Controlled
- 5.6.2 Temperature Controlled
- 5.7 Country
- 5.7.1 United States
- 5.7.2 Canada
- 5.7.3 Mexico
- 5.7.4 Rest of North America
6 Competitive Landscape
- 6.1 Market Concentration
- 6.2 Key Strategic Moves
- 6.3 Market Share Analysis
- 6.4 Company Profiles (Includes Global Level Overview, Market Level Overview, Core Segments, Financials as Available, Strategic Information, Market Rank/Share for Key Companies, Products and Services, and Recent Developments)
- 6.4.1 A.P. Moller - Maersk
- 6.4.2 ArcBest
- 6.4.3 C.H. Robinson
- 6.4.4 Canada Cartage
- 6.4.5 CMA CGM Group (including CEVA Logistics)
- 6.4.6 DHL Group
- 6.4.7 DSV A/S (De Sammensluttede Vognmand af Air and Sea)
- 6.4.8 FedEx
- 6.4.9 J.B. Hunt Transport, Inc.
- 6.4.10 Knight-Swift Transportation Holdings, Inc.
- 6.4.11 Landstar System, Inc.
- 6.4.12 Old Dominion Freight Line
- 6.4.13 Penske Corporation
- 6.4.14 Ryder System, Inc.
- 6.4.15 Schneider National, Inc.
- 6.4.16 Transportes Marva
- 6.4.17 Traxion
- 6.4.18 United Parcel Service of America, Inc. (UPS)
- 6.4.19 Werner Enterprises Inc.
- 6.4.20 XPO, Inc.
7 Market Opportunities and Future Outlook
- 7.1 White-Space and Unmet-Need Assessment


