

|
시장보고서
상품코드
2116127
동남아시아의 비료 : 시장 점유율 분석, 업계 동향 및 통계, 성장 예측(2026-2031년)Southeast Asia Fertilizer - Market Share Analysis, Industry Trends & Statistics, Growth Forecasts (2026 - 2031) |
||||||
 Mordor Intelligence
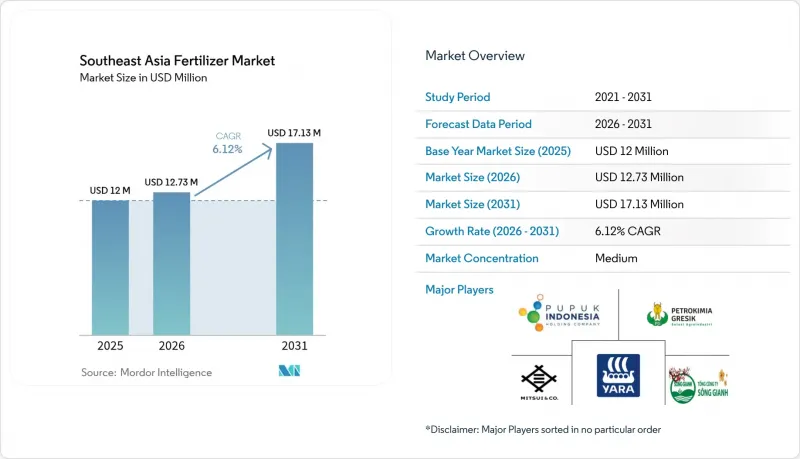
Mordor Intelligence에 의하면, 동남아시아의 비료 시장 규모는 2025년 1,200만 달러로 평가되었습니다. 2026년에는 1,273만 달러로 확대되어 2026-2031년에 걸쳐 CAGR 6.12%로 성장을 지속하여, 2031년에는 1,713만 달러에 이를 것으로 예측됩니다.
본 보고서는 유형별(질소계 비료, 인산계 비료, 칼륨 비료, 2차 다량 영양소, 미량 영양소), 용도별(곡물 및 곡류, 유지종자·콩류, 기타), 지역별(말레이시아, 태국, 베트남,필리핀, 인도네시아, 기타 동남아시아)로 분류되어 있습니다. 시장 예측은 금액(달러) 기준으로 제시되어 있습니다.
동남아시아의 비료 시장 동향 및 인사이트
정밀 농업 도구의 보급
위성 이미지, 토양 센서, 가변 시비 장치가 동남아시아의 비료 시장 전반의 영양소 관리를 혁신하고 있습니다. 태국의 ‘농업·협동조합 전략’에서는 스마트 농업용 하드웨어에 대한 세제 혜택이 마련되어 있어, 질소 손실을 최대 15%까지 줄여주는 GPS 유도식 살포기의 도입이 가속화되고 있습니다. 말레이시아의 야자 농장에서는 현재 수관의 생육 상황에 맞추어 칼륨 시비량을 조정하는 드론 매핑 검사가 운영되고 있는 반면, 인도네시아의 협동조합에서는 밭마다 최적의 요소 시비량을 권장하는 AI 토양 진단 시스템을 도입하고 있습니다. 생산자들이 비용과 노동력 양면에서 절감 효과를 확인함에 따라, 정밀 농업용 기계에 대응하는 입상 비료에 대한 수요가 높아지고 있습니다. 이러한 기술적 변혁은 정밀 시비 기기에 대응하는 특수 비료 배합에 대한 수요를 견인하고 있으며, 고효율 제품에 대한 비즈니스 기회를 창출하고 있습니다.
고효율 비료에 대한 수요 급증
베트남의 서방형 요소 사용량은 2024년에 25% 증가했습니다. 이는 몬순 기후 하에서 휘발로 인한 손실을 억제하는 제품으로의 지역적 전환을 반영합니다. 인도네시아의 한 대학은 벼 껍질 바이오숯을 코팅함으로써 질소 방출 기간을 60일 이상으로 연장하고 흡수 효율을 20% 향상시켰습니다고 보고했습니다. 말레이시아의 팜유 산업에서는 인력 부족을 해소하고 시비 빈도를 줄이기 위해 서방형 복합 비료의 도입이 점점 더 확대되고 있습니다. 말레이시아의 팜유 생산자들은 시비 빈도를 대폭 줄이고 인력 부족을 완화하는 폴리머 코팅 혼합 비료를 선호하여 채택하고 있습니다. 2025년 2월 요소 가격이 톤당 430달러에 달하는 등 비료 비용의 급등과 맞물려, 우수한 영양분 이용률을 실현하는 효율 향상 제품의 도입이 더욱 가속화되고 있습니다.
농촌 지역의 대출 접근성 제한
필리핀의 소규모 농업 종사자들은 비공식 대출업자에게 연 20%가 넘는 이자를 지불하고 있으며, 이로 인해 비료를 적시에 구매하는 데 어려움을 겪고 있습니다. 베트남의 벼농사 종사자들은 은행 대출 요건을 충족할 만한 담보를 충분히 갖추지 못한 경우가 많으며, 한편 인도네시아의 많은 지역에서는 소액금융 지점이 충분히 정비되어 있지 않습니다. 말레이시아 팜유 산업의 소규모 농업 종사자들도, 특히 초기 비용이 많이 드는 특수 비료에 대한 투자와 관련하여 유사한 과제에 직면해 있습니다. 국제비료개발센터(IFDC)는 인도네시아의 대상형 보조금 프로그램에서 입증된 바와 같이, 대출 접근성이 개선되면 비료 소비량을 연간 16% 증가시킬 수 있다고 지적하고 있습니다.
부문별 분석
요소와 황산암모늄을 주력 제품으로 하는 질소계 제품은 2025년 동남아시아의 비료 시장에서 42.58%의 점유율을 차지했습니다. 인도네시아 최대 기업인 PT Pupuk Indonesia만 해도 연간 940만 톤의 요소 생산 능력을 보유하고 있어, 국가의 쌀 생산 목표 달성을 위한 안정적인 공급을 확보하고 있습니다. 베트남과 태국에서는 특히 벼농사 성수기에 여전히 수입이 수요를 보완하고 있습니다. 칼리 비료의 경우 조달 리스크가 있지만, 태국에서 계획 중인 연산 120만 톤 규모의 MOP(몰리브덴산 칼륨) 시설 덕분에 2028년까지 의존도가 낮아질 것으로 전망됩니다. 각 영양소 범주별 서방형 코팅 제품은 정밀 농업 플랫폼에서 선호되는 단계적 시비에 적합하며, 호우가 잦은 기후 조건에서 영양소 이용 효율을 높여 시장 점유율을 확대할 것으로 예측됩니다.
동남아시아의 비료 시장에서 미량 영양소 제제 시장 규모는 2031년까지 연평균 성장률(CAGR) 8.95%로 급속히 확대될 전망입니다. 이는 광범위한 아연 및 붕소 결핍을 해소하려는 생산자들의 움직임을 반영한 것입니다. 전문 공급업체들은 열대 지역 토양에서의 고정 현상에 강하고 정밀 살포기에 대응할 수 있는 킬레이트화 혼합 제품을 통해 이에 대응하고 있습니다. 팜유 농장이 더 높은 유수율 대 송이 비율을 추구함에 따라, 2차 주요 영양소, 특히 황과 마그네슘의 중요성이 높아지고 있습니다.
기타 혜택
- 엑셀 형식 시장 예측(ME) 시트
- 3개월간의 애널리스트 지원
자주 묻는 질문
목차
제1장 서론
제2장 조사 방법
제3장 개요
제4장 시장 구도
제5장 시장 규모 및 성장 예측
제6장 경쟁 구도
제7장 시장 기회 및 향후 전망
KTH 26.08.31According to Mordor Intelligence, the Southeast Asia fertilizer market size is expected to grow from USD 12 million in 2025 to USD 12.73 million in 2026 and is forecast to reach USD 17.13 million by 2031 at 6.12% CAGR over 2026-2031.
This report is Segmented by Type (Nitrogenous Fertilizers, Phosphatic Fertilizers, Potash Fertilizers, Secondary Macronutrients, and Micronutrients), by Application (Grains and Cereals, Oilseeds and Pulses, and More), and by Geography (Malaysia, Thailand, Vietnam, Philippines, Indonesia, and Rest of Southeast Asia). The Market Forecasts are Provided in Terms of Value (USD).
Southeast Asia Fertilizer Market Trends and Insights
Widespread Adoption of Precision-Farming Tools
Satellite imagery, soil sensors, and variable-rate applicators are transforming nutrient management across the Southeast Asia fertilizer market. Thailand's Agriculture and Cooperatives Strategy offers tax relief for smart farming hardware, accelerating uptake of GPS-guided spreaders that cut nitrogen losses by up to 15%. Malaysian oil-palm estates now run trials with drone-based mapping that tailors potassium inputs to canopy vigor, while Indonesian cooperatives deploy AI soil diagnostics that recommend field-specific urea rates. As growers verify savings in both cost and labor, demand for granular formulations compatible with precision machinery is rising. This technological shift drives demand for specialized fertilizer formulations compatible with precision application equipment, creating opportunities for enhanced-efficiency products.
Surging Demand for Enhanced-Efficiency Fertilizers
Controlled-release urea use in Vietnam expanded 25% in 2024, reflecting a regional pivot toward products that curb volatilization losses in monsoon climates. Indonesian universities report rice-husk-biochar coatings that extend nitrogen release over 60 days, lifting uptake efficiency by 20%. Malaysia's palm oil sector increasingly adopts slow-release formulations to address labor shortages and reduce application frequency. Palm growers in Malaysia favor polymer-coated blends that slash application frequency, easing labor constraints. Rising fertilizer costs, with urea prices reaching USD 430 per metric ton in February 2025, further accelerate the adoption of efficiency-enhancing products that deliver superior nutrient utilization rates.
Limited Rural Credit Access
Smallholders in the Philippines pay annual interest rates topping 20% to informal lenders, constraining timely fertilizer purchases. Vietnamese rice farmers often lack collateral to meet banking requirements, while many Indonesian districts remain underserved by micro-finance branches. Smallholders in Malaysia's palm oil industry encounter comparable challenges, especially regarding investments in specialty fertilizers that demand higher initial expenditures. The International Fertilizer Development Center notes that credit access improvements could increase fertilizer consumption by 16% annually, as demonstrated in Indonesia's targeted subsidy programs
Other drivers and restraints analyzed in the detailed report include:
- Government Nutrient-Management Subsidy Programs
- Expansion of Controlled-Release and Specialty Blends
- Climate-Induced Application Uncertainty
For complete list of drivers and restraints, kindly check the Table Of Contents.
Segment Analysis
Nitrogenous products, anchored by urea and ammonium sulfate, held a 42.58% share of the Southeast Asia fertilizer market in 2025. Domestic champion PT Pupuk Indonesia alone maintains an annual urea capacity of 9.4 million metric tons, ensuring a reliable supply for national rice targets. Imports still supplement Vietnamese and Thai demand, especially during peak paddy seasons. Potash fertilizers are subject to sourcing risks, however, the planned 1.2 million metric tons MOP facility in Thailand is expected to reduce dependency by 2028. Controlled-release coatings across each nutrient class are projected to gain market share because they match the incremental dosing preferred in precision platforms, thereby boosting nutrient-use efficiency under heavy rainfall regimes.
The Southeast Asia fertilizer market size attributed to micronutrient formulations is set to increase rapidly, with a 8.95% CAGR to 2031, reflecting growers' push to correct widespread zinc and boron deficiencies. Specialty suppliers are responding with chelated blends that resist tropical soil fixation and are compatible with precision spreader formats. Secondary macronutrients, particularly sulfur and magnesium, rise in relevance as palm oil estates pursue higher oil-to-bunch ratios.
Complete Report Scope:
- By Type
- Nitrogenous Fertilizers
- Urea
- Calcium Ammonium Nitrate
- Ammonia
- Ammonium Nitrate
- Ammonium Sulfate
- Other Nitrogenous Fertilizers
- Phosphatic Fertilizers
- Mono-ammonium Phosphate
- Di-ammonium Phosphate
- Triple Superphosphate
- Other Phosphatic Fertilizers
- Potash Fertilizers
- Muriate of Potash
- Other Potash Fertilizers
- Secondary Macronutrients
- Micronutrients
- Nitrogenous Fertilizers
- By Application
- Grains and Cereals
- Oilseeds and Pulses
- Commercial Crops
- Fruits and Vegetables
- Other Applications
- By Geography
- Malaysia
- Thailand
- Vietnam
- Philippines
- Indonesia
- Rest of Southeast Asia
List of Companies Covered in this Report:
- PT Pupuk Indonesia (Persero)
- Yara International ASA
- PT Petrokimia Gresik
- Mitsui & Co., Ltd. (Thai Central Chemical PCL)
- Song Gianh Corporation
- Ninh Binh Phosphate Fertilizer JSC
- Southern Fertilizer JSC
- Nutrien Ltd.
- Farmcochem Group
- sak siam fertilizer global export company limited (Saksiam Group)
- ICL Group Ltd. (Israel Corporation)
- Haifa Negev technologies LTD
- EuroChem Group (AIM Capital SE)
- K+S Aktiengesellschaft
Additional Benefits:
- The market estimate (ME) sheet in Excel format
- 3 months of analyst support
TABLE OF CONTENTS
1 Introduction
- 1.1 Study Assumptions and Market Definition
- 1.2 Scope of the Study
2 Research Methodology
3 Executive Summary
4 Market Landscape
- 4.1 Market Overview
- 4.2 Market Drivers
- 4.2.1 Widespread adoption of precision-farming tools
- 4.2.2 Surging demand for enhanced-efficiency fertilizers
- 4.2.3 Government nutrient-management subsidy programs
- 4.2.4 Expansion of controlled-release and specialty blends
- 4.2.5 Digital twin modeling for field-specific fertilizer dosing
- 4.2.6 Carbon-credit incentives for low-emission fertilizers
- 4.3 Market Restraints
- 4.3.1 Limited rural credit access
- 4.3.2 Climate-induced application uncertainties
- 4.3.3 Volatility in ammonia and potash feedstock prices
- 4.3.4 Lagging logistics infrastructure in secondary cities
- 4.4 Regulatory Landscape
- 4.5 Technological Outlook
- 4.6 Porter's Five Forces Analysis
- 4.6.1 Bargaining Power of Buyers
- 4.6.2 Bargaining Power of Suppliers
- 4.6.3 Threat of New Entrants
- 4.6.4 Threat of Substitute Products
- 4.6.5 Intensity of Competitive Rivalry
5 Market Size and Growth Forecasts (Value)
- 5.1 By Type
- 5.1.1 Nitrogenous Fertilizers
- 5.1.1.1 Urea
- 5.1.1.2 Calcium Ammonium Nitrate
- 5.1.1.3 Ammonia
- 5.1.1.4 Ammonium Nitrate
- 5.1.1.5 Ammonium Sulfate
- 5.1.1.6 Other Nitrogenous Fertilizers
- 5.1.2 Phosphatic Fertilizers
- 5.1.2.1 Mono-ammonium Phosphate
- 5.1.2.2 Di-ammonium Phosphate
- 5.1.2.3 Triple Superphosphate
- 5.1.2.4 Other Phosphatic Fertilizers
- 5.1.3 Potash Fertilizers
- 5.1.3.1 Muriate of Potash
- 5.1.3.2 Other Potash Fertilizers
- 5.1.4 Secondary Macronutrients
- 5.1.5 Micronutrients
- 5.1.1 Nitrogenous Fertilizers
- 5.2 By Application
- 5.2.1 Grains and Cereals
- 5.2.2 Oilseeds and Pulses
- 5.2.3 Commercial Crops
- 5.2.4 Fruits and Vegetables
- 5.2.5 Other Applications
- 5.3 By Geography
- 5.3.1 Malaysia
- 5.3.2 Thailand
- 5.3.3 Vietnam
- 5.3.4 Philippines
- 5.3.5 Indonesia
- 5.3.6 Rest of Southeast Asia
6 Competitive Landscape
- 6.1 Market Concentration
- 6.2 Strategic Moves
- 6.3 Market Share Analysis
- 6.4 Company Profiles (Includes Global Level Overview, Market Level Overview, Core Segments, Financials as Available, Strategic Information, Market Rank/Share for Key Companies, Products and Services, and Recent Developments)
- 6.4.1 PT Pupuk Indonesia (Persero)
- 6.4.2 Yara International ASA
- 6.4.3 PT Petrokimia Gresik
- 6.4.4 Mitsui & Co., Ltd. (Thai Central Chemical PCL)
- 6.4.5 Song Gianh Corporation
- 6.4.6 Ninh Binh Phosphate Fertilizer JSC
- 6.4.7 Southern Fertilizer JSC
- 6.4.8 Nutrien Ltd.
- 6.4.9 Farmcochem Group
- 6.4.10 sak siam fertilizer global export company limited (Saksiam Group)
- 6.4.11 ICL Group Ltd. (Israel Corporation)
- 6.4.12 Haifa Negev technologies LTD
- 6.4.13 EuroChem Group (AIM Capital SE)
- 6.4.14 K+S Aktiengesellschaft


