

|
시장보고서
상품코드
2116305
피트니스 트래커 시장 : 점유율 분석, 업계 동향과 통계, 성장 예측(2026-2031년)Fitness Tracker - Market Share Analysis, Industry Trends & Statistics, Growth Forecasts (2026 - 2031) |
||||||
 Mordor Intelligence
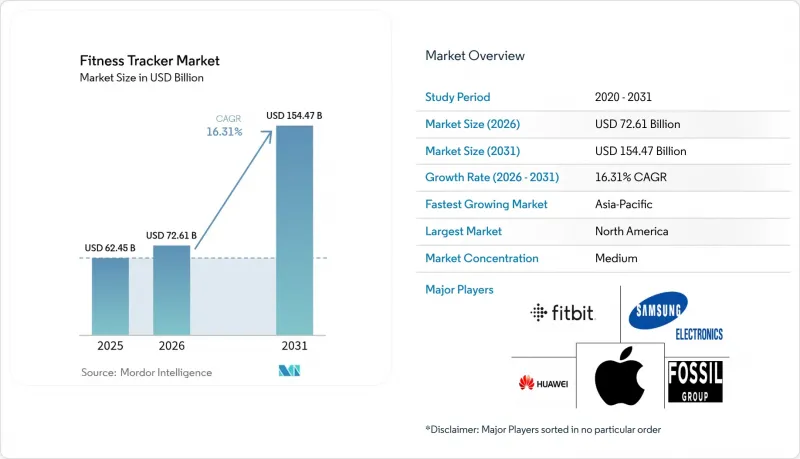
Mordor Intelligence에 의하면, 피트니스 트래커 시장 규모는 2025년에 624억 5,000만 달러로 평가되었고 2026년 726억 1,000만 달러에서 2031년까지 1,544억 7,000만 달러에 이를 것으로 예측되며, 예측 기간(2026-2031년) CAGR은 16.31%를 나타낼 전망입니다.
본 보고서는 제품 유형(피트니스 밴드, 스마트 워치 등), 판매 채널(오프라인 및 온라인), 착용 유형(손목용, 다리용, 머리용 등), 용도(심박수·활동량 모니터링,수면·회복 분석, 혈당·대사 추적 등) 및 지역(북미, 유럽, 아시아태평양 등)별로 분류되어 있습니다. 시장 전망은 금액(달러) 기준으로 제시되어 있습니다.
세계 피트니스 트래커 시장 동향 및 인사이트
올인원 헬스 허브로서의 스마트 워치 보급 확대
현재 스마트 워치에는 심전도(ECG), 혈중 산소 포화도(SpO2), 피부 온도 및 혈압 측정 센서가 내장되어 있어, 기기 사용의 번거로움을 줄여주는 통합적인 모니터링 기능을 제공합니다. 애플은 2025년 가을 제품 라인업에 커프리스 혈압 알림 기능을 도입할 예정이며, 한편 삼성은 2024년에 손목에서 혈당 추이를 측정하는 기능을 도입했습니다. 의료 기관들은 단일 기기 모델을 환자의 지속적인 치료 순응도를 촉진하기 위한 비용 효율적인 방법으로 간주하고 있습니다. 앱 스토어, 클라우드 백업, 가족 공유 대시보드를 통한 생태계 락인은 벤더에 대한 충성도를 높여, 부품 가격이 하락하더라도 프리미엄 브랜드가 이익률을 유지할 수 있게 해줍니다. 기기 구매를 지원하는 기업용 웰니스 계약은 상업 채널에서의 판매량을 견인하며, 스마트 워치가 ‘선택적 구매’가 아닌 ‘필수 구매’임을 더욱 뒷받침하고 있습니다.
대중용 웨어러블 밴드에 탑재된 AI 생체 센서의 보급
엣지 AI 칩은 현재 100달러 미만의 웨어러블에 탑재되어 중저가 제품에 의료 등급의 해상도를 제공합니다. 코넬 대학과 MIT가 개발한 섬유에 내장된 프로세서는 실험실 테스트에서 93% 이상의 활동 분류 정확도를 달성하여, 웨어러블 밴드에서 의류 원단으로의 전환이 더욱 확대될 조짐을 보이고 있습니다. 디바이스 상의 추론 처리를 통해 지연이 감소하고 비용이 많이 드는 클라우드 호출을 피할 수 있을 뿐만 아니라, 유럽 및 아시아 일부 지역의 데이터 주권 요건도 충족됩니다. 저비용이면서도 높은 정확도가 실현됨에 따라, 가격에 민감한 시장에서 교체 주기가 단축되어 프리미엄 카테고리를 잠식하지 않으면서 피트니스 트래커 시장을 직접 확대되고 있습니다. 또한 부품의 표준화로 설계 주기도 단축되어, 지역 OEM 기업들은 대기질 경보나 뎅기열 증상 경고 등 지역 특유의 건강 문제에 대응하는 제품 개발로 방향을 전환할 수 있게 되었습니다.
사이버 보안 및 데이터 주권 규정 준수 비용
유럽의 ‘사이버 복원력 법’은 제조업체에 취약점 테스트 실시, 5년간의 보안 패치 제공, 그리고 침해 발생 후 24시간 이내의 공개를 의무화하고 있습니다. 중견 브랜드들은 인증 비용 증가와 개발 주기 장기화에 직면해 있어, 제품 갱신 속도가 둔화되고 소비자의 선택지가 제한되고 있습니다. 동시에 시행되고 있는 GDPR(EU 개인정보보호규정)로 인해 데이터 부정 사용에 대한 벌금이 인상되었으며, 기업들은 지역별 데이터센터를 구축할 수밖에 없어 운영비 증가로 이어지고 있습니다. 북미에서는 개인정보 보호 관련 법규가 세분화되어 있어 통일된 규정 준수 로드맵 수립이 어려워지고 있으며, 일부 벤더는 전 세계적으로 가장 엄격한 기준을 채택할 수밖에 없어, 그 결과 부품 원가(BOM)가 대당 약 3% 상승하고 있습니다. 견고한 보안은 소비자의 신뢰를 높여주지만, 단기적인 재정적 부담이 영업이익률을 압박하여 소규모 신규 진출기업이 여러 지역에서 사업을 확장하는 데 걸림돌이 될 수 있습니다.
부문 분석
2025년, 피트니스 트래커 시장 규모의 46.92%를 스마트 워치가 차지했습니다. 이는 스마트폰 OS와의 긴밀한 연동과 풍부한 헬스케어 앱군의 혜택 덕분입니다. 플래그십 모델에 탑재된 센서 융합 기술 덕분에, 이러한 기기들은 구조화된 데이터를 전자 건강 기록에 직접 출력할 수 있는 준진단 기기로서의 입지를 확립하고 있습니다. 디스플레이 기능을 최소화한 엔트리 레벨 스마트 워치는 가격에 민감한 사용자를 확보하는 동시에, 프리미엄 분석 서비스로의 업셀링으로 이어지는 클라우드 알고리즘에 지속적으로 데이터를 제공합니다.
스마트웨어와 스마트 슈즈는 세탁기 세탁이 가능하며 95%의 활동 인식 정확도를 실현하는 전도성 원단을 바탕으로, 2031년까지 연평균 성장률(CAGR) 21.36%로 가장 높은 성장률을 기록하고 있습니다. 스포츠 브랜드는 초기 판매 이상의 수익화를 도모하기 위해 보행 분석 구독 서비스를 신발과 세트로 판매하고 있습니다. 스마트 링은 프라이버시와 편안함을 중시하는 틈새 시장을 충족시키며, 손목 스트랩을 선호하지 않는 야간 착용자들에게 어필하고 있습니다. 이러한 대체적인 폼 팩터는 손목에 착용하는 기기가 거추장스럽게 느껴지거나 정확도가 부족한 상황에 대응함으로써 피트니스 트래커 시장 전체를 확대시키고 있습니다.
2025년에는 라이브 스트리밍을 통한 제품 데모, 인플루언서의 언박싱 영상, 결제 시 통합 금융 서비스 도입에 힘입어 전자상거래가 피트니스 트래커 시장 점유율의 63.93%를 차지했습니다. D2C(소비자 직접 판매) 포털 사이트를 통해 브랜드는 소매업체의 마진을 거치지 않고 펌웨어 업데이트를 배포하거나, 코칭 플랜을 판매하거나, 익명화된 참여 지표를 수집할 수 있게 되었습니다. 가상 피팅 도구가 성숙해짐에 따라 반품률로 인한 마찰도 줄어들고 있습니다.
오프라인 전문 체인점은 프리미엄 포지셔닝, 체험형 디스플레이, 성수기인 휴가철의 즉각적인 대응이라는 측면에서 여전히 중요성을 유지하고 있지만, 물류 파트너가 지방 도시에서도 2일 이내의 자택 배송을 실현함에 따라 그 점유율은 축소되고 있습니다. 약국에서는 오프라인 매장의 의료적 신뢰성과 디지털의 편의성을 융합한 하이브리드형 ‘클릭 앤 콜렉트(Click & Collect)’ 모델이 등장하고 있습니다.
지역별 분석
2025년, 북미는 43.13%의 점유율을 차지했습니다. 기기를 통해 검증된 목표를 달성할 경우 연간 최대 1,000달러를 지급하는 고용주의 웰니스 프로그램은 보험사와 예방 의료 간의 경제적 연계를 보여줍니다. CMS가 제안한 디지털 치료제를 위한 CPT 코드는 상환 절차를 확고히 하고, 임상의가 트래커를 활용한 중재를 처방하도록 장려하고 있습니다. 웨어러블 센서에 대한 FDA의 510(k) 승인 및 OTC 승인이 잇따르면서, 이러한 기기가 일선 의료 도구로서 그 정당성을 더욱 공고히 하고 있습니다. 스마트 워치의 API와 연동되는 AI 기반 분석 스타트업에는 계속해서 벤처 캐피털이 유입되고 있습니다.
아시아태평양은 생산 비용을 절감하고 SKU의 급속한 확장을 가능하게 하는 수직 통합형 제조 클러스터에 힘입어 연평균 성장률(CAGR) 19.67%로 가장 빠르게 성장하고 있습니다. 현지 브랜드들은 현지 언어로 된 코칭과 개인 맞춤형 식단 정보를 패키지로 제공하며, 인도, 인도네시아, 중국에서 첫 구매자들의 공감을 얻고 있습니다. 중산층의 가처분 소득 증가는 도시 지역의 앉아 있는 생활 습관 추세를 상쇄하기 위해 활동적인 라이프스타일을 장려하는 정부의 캠페인과 맞물려 진전을 보이고 있습니다. 국내 대형 기술 기업들은 슈퍼 앱을 활용하여 웨어러블 기기, 보험, 원격 의료 상담 패키지의 교차 판매를 진행하고 있습니다.
유럽에서는 클라우드 동기화형 생체 인증에 대한 신뢰를 구축하는 견고한 소비자 데이터 보호 체제에 힘입어 꾸준한 성장이 나타나고 있습니다. 『사이버 복원력 법』 준수로 인해 초기 연구개발비용은 증가하겠지만, 품질이 낮은 수입품이 배제되면서 평균 판매 가격이 상승하고 있습니다. 독일과 북유럽 국가들의 공공 부문 조달에서는 재활용률 기준을 충족하는 EU산 기기가 점점 더 많이 지정되고 있습니다. 남유럽 시장은 가처분 소득이 낮아 다소 뒤처지고 있지만, EU 전역을 아우르는 전자상거래 물류 체계의 혜택을 받고 있습니다.
중동 및 아프리카, 남미에서는 모바일 우선(Mobile First)을 지향하는 주민들이 합리적인 가격의 요금제와 선불 데이터 요금제 세트를 채택하고 있어, 비약적인 성장 가능성이 기대됩니다. 걸프 국가들의 정부 주도 만성 질환 검진 프로그램에는 트래커 배포가 옵션으로 포함되어 있으며, 브라질의 디지털 은행 로열티 프로그램에서는 걸음 수에 따라 캐시백이 제공되고 있습니다. 전력 공급의 불안정성과 광대역 격차는 여전히 장벽으로 작용하고 있지만, 인프라 개선에 따라 감소 추세를 보이고 있습니다.
기타 혜택:
- 엑셀 형식 시장 예측(ME) 시트
- 3개월간의 애널리스트 지원
자주 묻는 질문
목차
제1장 서론
제2장 조사 방법
제3장 주요 요약
제4장 시장 구도
제5장 시장 규모와 성장 예측
제6장 경쟁 구도
제7장 시장 기회와 향후 전망
JHS 26.08.28According to Mordor Intelligence, the fitness tracker market size was valued at USD 62.45 billion in 2025 and estimated to grow from USD 72.61 billion in 2026 to reach USD 154.47 billion by 2031, at a CAGR of 16.31% during the forecast period (2026-2031).
This report is Segmented by Product Type (Fitness Band, Smart Watches, and More), Sales Channel (Offline and Online), Wearing Type (Hand Wear, Leg Wear, Head Wear, and More), Application (Heart-Rate & Activity Monitoring, Sleep & Recovery Analysis, Glucose & Metabolic Tracking, and More), and Geography (North America, Europe, Asia-Pacific, and More). The Market Forecasts are Provided in Terms of Value (USD).
Global Fitness Tracker Market Trends and Insights
Growing Adoption of Smartwatches as All-in-One Health Hubs
Smartwatches now embed ECG, SpO2, skin-temperature, and impending blood-pressure sensors, offering a consolidated monitoring package that reduces device fatigue. Apple plans to launch cuff-less blood-pressure alerts in its fall 2025 lineup, while Samsung introduced wrist-based glucose trend readings in 2024. Health systems view the single-device model as a cost-effective way to promote continuous patient compliance. Ecosystem lock-in through app stores, cloud back-ups, and family-sharing dashboards reinforces vendor stickiness, allowing premium brands to defend margin even as component prices decline. Corporate wellness contracts that subsidize devices drive volume in commercial channels and further validate smartwatches as essential rather than discretionary purchases.
Penetration of AI-Powered Biometric Sensors in Mass-Market Bands
Edge AI chips now ship inside sub-USD 100 wristbands, bringing medical-grade resolution to mid-tier price points. Textile-embedded processors from Cornell and MIT achieve over 93% activity-classification accuracy in laboratory trials, signaling broader migration from wrist to garment fabric. On-device inference reduces latency, avoids costly cloud calls, and satisfies data-sovereignty mandates in Europe and parts of Asia. Low-cost accuracy lifts replacement cycles in price-sensitive markets, directly expanding the fitness tracker market without cannibalizing premium categories. Component standardization also shortens design cycles, letting regional OEMs pivot products toward hyper-local health concerns such as air-quality alerts or dengue-fever symptom flags.
Cyber-Security and Data-Sovereignty Compliance Costs
Europe's Cyber Resilience Act obliges manufacturers to conduct vulnerability testing, issue five-year security patches, and disclose breaches within 24 hours. Mid-cap brands face higher certification costs and longer development cycles, slowing product refresh rates and constraining choice for consumers. Parallel GDPR enforcement increases fines for data misuse, prompting firms to build region-specific data centers that raise operating expense. In North America, fragmented privacy statutes complicate a unified compliance roadmap, leading some vendors to adopt the strictest standard globally, raising BOM costs by an estimated 3% per unit. While robust security boosts consumer confidence, the near-term financial burden weighs on operating margins and may deter smaller entrants from scaling in multiple regions.
Other drivers and restraints analyzed in the detailed report include:
- Shift To Continuous Non-Invasive Glucose Sensing Wearables
- Integration With Digital Therapeutics Reimbursement Pathways
- Growing E-Waste Regulation Elevating End-of-Life Costs
For complete list of drivers and restraints, kindly check the Table Of Contents.
Segment Analysis
Smartwatches accounted for 46.92% of the fitness tracker market size in 2025, benefitting from tight linkage to smartphone operating systems and a deep bench of health apps. Sensor fusion inside flagship models elevates them to quasi-diagnostic devices that can export structured data straight into electronic health records. Entry-level smartwatches with pared-down displays capture value-conscious users while still feeding cloud algorithms that upsell premium analytics tiers.
Smart clothing and shoes post the fastest 21.36% CAGR to 2031 on the back of conductive fabrics that withstand machine washing and deliver 95% activity-recognition accuracy. Athletics brands bundle gait-analysis subscriptions with footwear to monetize beyond the initial sale. Smart rings fill a privacy-and-comfort niche, appealing to night-time wearers who dislike wrist straps. These alternative form factors collectively expand the fitness tracker market by addressing contexts where wrist-wear proves intrusive or imprecise.
E-commerce captured 63.93% of the fitness tracker market share in 2025, propelled by livestreamed product demos, influencer unboxings, and integrated financing at checkout. Direct-to-consumer portals allow brands to push firmware updates, sell coaching plans, and harvest anonymized engagement metrics without retailer mark-ups. Return-rate friction drops as virtual-try-on tools mature.
Offline specialty chains retain relevance for premium positioning, experiential displays, and immediate fulfillment during holiday peaks, but their share erodes as logistics partners enable two-day doorstep delivery even in secondary cities. Hybrid click-and-collect models emerge in pharmacies, marrying the medical credibility of brick-and-mortar with digital convenience.
Complete Report Scope:
- By Product Type
- Fitness Bands
- Smartwatches
- Smart Rings
- Smart Clothing & Shoes
- Others
- By Sales Channel
- Online
- Offline (Specialty Retail, CE Stores)
- By Wearing Type
- Hand-wear (Wrist- & Finger-based)
- Head-wear
- Leg-wear (Smart Shoes, Straps)
- Torso-wear (Smart Shirts)
- Others
- By Application
- Heart-rate & Activity Monitoring
- Sleep & Recovery Analysis
- Glucose & Metabolic Tracking
- Women's Health & Fertility
- Occupational & Senior Safety
- Geography
- North America
- United States
- Canada
- Mexico
- Europe
- Germany
- United Kingdom
- France
- Italy
- Spain
- Rest of Europe
- Asia-Pacific
- China
- Japan
- India
- South Korea
- Australia
- Rest of Asia-Pacific
- Middle East and Africa
- GCC
- South Africa
- Rest of Middle East and Africa
- South America
- Brazil
- Argentina
- Rest of South America
- North America
Geography Analysis
North America commanded 43.13% share in 2025. Employer wellness programs that pay up to USD 1,000 annually for meeting device-verified goals demonstrate financial alignment between insurers and preventive care. CMS's proposed CPT codes for digital therapeutics cement a reimbursement pathway, encouraging clinicians to prescribe tracker-based interventions. The litany of FDA 510(k) and OTC clearances for wearable sensors further legitimizes devices as front-line medical tools. Venture capital continues to flow into AI-driven analytics startups that plug into smartwatch APIs.
Asia-Pacific grows fastest at 19.67% CAGR, fueled by vertically integrated manufacturing clusters that compress production costs and enable rapid SKU proliferation. Local brands bundle vernacular language coaching and tailored diet insights, resonating with first-time buyers in India, Indonesia, and China. Rising middle-class disposable income aligns with government campaigns promoting active lifestyles to combat urban sedentary trends. Domestic tech giants leverage super-apps to cross-sell wearables, insurance, and telemedicine-consult packages.
Europe registers steady growth underpinned by robust consumer-data protections that build trust in cloud-synced biometrics. Compliance with the Cyber Resilience Act drives up-front R&D spend yet culls lower-quality imports, raising average selling prices. Public-sector procurement in Germany and the Nordics increasingly specifies EU-origin devices that meet recyclability quotas. Southern European markets lag slightly due to lower discretionary income but benefit from pan-EU e-commerce fulfillment.
The Middle East, Africa, and South America illustrate leap-frog potential as mobile-first populations adopt affordable bands bundled with prepaid data plans. Government-sponsored chronic-disease screening in the Gulf states includes optional tracker distribution, and Brazilian digital-bank loyalty programs reward steps with cashback. Power-supply variability and broadband gaps remain barriers yet decline as infrastructure improves.
- Apple
- Google (Fitbit)
- Samsung Group
- Xiaomi Corp.
- Huawei Technologies Co. Ltd.
- Garmin
- Amazfit (Zepp Health)
- Fossil Group
- Withings
- Polar Electro
- Suunto Oy
- Whoop Inc.
- Oura Health Oy
- Noise
- Realme
- Oppo
- Nike Inc.
Additional Benefits:
- The market estimate (ME) sheet in Excel format
- 3 months of analyst support
TABLE OF CONTENTS
1 Introduction
- 1.1 Study Assumptions & Market Definition
- 1.2 Scope of the Study
2 Research Methodology
3 Executive Summary
4 Market Landscape
- 4.1 Market Overview
- 4.2 Market Drivers
- 4.2.1 Growing Adoption Of Smartwatches As All-In-One Health Hubs
- 4.2.2 Penetration Of AI-Powered Biometric Sensors In Mass-Market Bands
- 4.2.3 Insurer & Employer Wellness Incentives Boosting Device Uptake
- 4.2.4 Shift To Continuous Non-Invasive Glucose Sensing Wearables
- 4.2.5 Expansion Of Women-Specific Cycle & Fertility Analytics
- 4.2.6 Integration With Digital Therapeutics Reimbursement Pathways
- 4.3 Market Restraints
- 4.3.1 High Average Selling Price Of Flagship Smartwatches
- 4.3.2 Cyber-Security & Data-Sovereignty Compliance Costs
- 4.3.3 Sensor-Skin Contact Dermatitis Leading To Product Returns
- 4.3.4 Growing E-Waste Regulation Elevating End-Of-Life Costs
- 4.4 Porter's Five Forces
- 4.4.1 Threat of New Entrants
- 4.4.2 Bargaining Power of Buyers
- 4.4.3 Bargaining Power of Suppliers
- 4.4.4 Threat of Substitutes
- 4.4.5 Intensity of Competitive Rivalry
5 Market Size & Growth Forecasts (Value, USD)
- 5.1 By Product Type
- 5.1.1 Fitness Bands
- 5.1.2 Smartwatches
- 5.1.3 Smart Rings
- 5.1.4 Smart Clothing & Shoes
- 5.1.5 Others
- 5.2 By Sales Channel
- 5.2.1 Online
- 5.2.2 Offline (Specialty Retail, CE Stores)
- 5.3 By Wearing Type
- 5.3.1 Hand-wear (Wrist- & Finger-based)
- 5.3.2 Head-wear
- 5.3.3 Leg-wear (Smart Shoes, Straps)
- 5.3.4 Torso-wear (Smart Shirts)
- 5.3.5 Others
- 5.4 By Application
- 5.4.1 Heart-rate & Activity Monitoring
- 5.4.2 Sleep & Recovery Analysis
- 5.4.3 Glucose & Metabolic Tracking
- 5.4.4 Women's Health & Fertility
- 5.4.5 Occupational & Senior Safety
- 5.5 Geography
- 5.5.1 North America
- 5.5.1.1 United States
- 5.5.1.2 Canada
- 5.5.1.3 Mexico
- 5.5.2 Europe
- 5.5.2.1 Germany
- 5.5.2.2 United Kingdom
- 5.5.2.3 France
- 5.5.2.4 Italy
- 5.5.2.5 Spain
- 5.5.2.6 Rest of Europe
- 5.5.3 Asia-Pacific
- 5.5.3.1 China
- 5.5.3.2 Japan
- 5.5.3.3 India
- 5.5.3.4 South Korea
- 5.5.3.5 Australia
- 5.5.3.6 Rest of Asia-Pacific
- 5.5.4 Middle East and Africa
- 5.5.4.1 GCC
- 5.5.4.2 South Africa
- 5.5.4.3 Rest of Middle East and Africa
- 5.5.5 South America
- 5.5.5.1 Brazil
- 5.5.5.2 Argentina
- 5.5.5.3 Rest of South America
- 5.5.1 North America
6 Competitive Landscape
- 6.1 Market Concentration
- 6.2 Market Share Analysis
- 6.3 Company Profiles (includes Global level Overview, Market level overview, Core Segments, Financials as available, Strategic Information, Market Rank/Share for key companies, Products & Services, and Recent Developments)
- 6.3.1 Apple Inc.
- 6.3.2 Google (Fitbit)
- 6.3.3 Samsung Electronics Co. Ltd.
- 6.3.4 Xiaomi Corp.
- 6.3.5 Huawei Technologies Co. Ltd.
- 6.3.6 Garmin Ltd.
- 6.3.7 Amazfit (Zepp Health)
- 6.3.8 Fossil Group Inc.
- 6.3.9 Withings
- 6.3.10 Polar Electro Oy
- 6.3.11 Suunto Oy
- 6.3.12 Whoop Inc.
- 6.3.13 Oura Health Oy
- 6.3.14 Noise
- 6.3.15 Realme
- 6.3.16 Oppo
- 6.3.17 Nike Inc.
7 Market Opportunities & Future Outlook
- 7.1 White-space & Unmet-need Assessment


