

|
시장보고서
상품코드
2116343
전기자동차용 전고체 배터리 : 시장 점유율 분석, 업계 동향 및 통계, 성장 예측(2026-2031년)EV Solid-state Battery - Market Share Analysis, Industry Trends & Statistics, Growth Forecasts (2026 - 2031) |
||||||
 Mordor Intelligence
Mordor Intelligence에 의하면, 2026년 전기자동차용 전고체 배터리 시장 규모는 3억 7,209만 달러로 추정되고 2025년 2억 6,000만 달러에서 성장하여 2031년에는 22억 3,000만 달러에 이를 것으로 예측됩니다.
2026년부터 2031년에 걸쳐 연평균 성장률(CAGR) 43.11%로 성장할 것으로 전망됩니다.
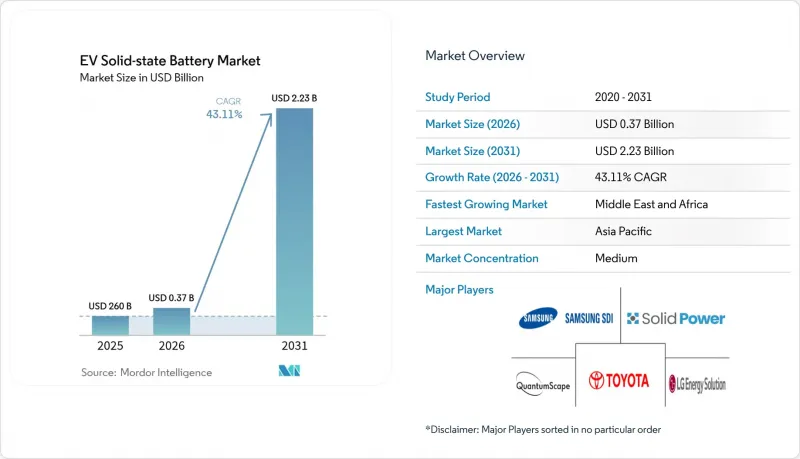
본 보고서는 차량 유형(승용차 및 상용차), 추진 방식(배터리식 전기차, PHEV 등), 고체 전해질 유형(황화물계, 산화물계 등), 양극재(리튬 금속 등), 배터리 용량(20Ah 미만 등) 및 지역별로 분류되어 있습니다. 시장 전망은 금액(달러) 기준으로 제시되어 있습니다.
세계의 전기자동차용 전고체 배터리 시장 동향 및 인사이트
전 세계 전기차 판매 대수의 급속한 성장
세계 전기차 판매 대수는 2025년에 2,000만 대를 넘어설 것으로 예상되며, 이는 2021년 수준의 약 3배에 해당합니다. 이에 따라 자동차 제조업체들은 더 빠르게 충전할 수 있고 주행 거리가 긴 배터리 확보에 더욱 주력하게 될 것입니다. 중국이 생산에서 지배적인 위치를 차지하고 있기 때문에 아시아의 셀 제조업체들은 초기 단계에서 규모의 경제라는 이점을 누리고 있습니다. 한편, 상용차 차량군의 전기화로 인해 수요는 소비자용 부문을 넘어 확대되고 있습니다. 배터리 팩 수주량 증가에 따라 공급업체는 시범 생산 라인의 설비 가동률을 높일 수 있게 되며, 그 결과 kW시당 비용을 절감할 수 있게 됩니다. 이러한 동향들이 맞물려 대상 차량의 범위가 확대되고, 구매자들이 기술 프리미엄을 지불하려는 의지도 높아지면서 전고체 배터리 시장은 전반적으로 성장세를 보이고 있습니다. 지역별 차이는 여전히 존재하지만, 안전성과 주행 거리에 대한 우려가 완화됨에 따라 전반적인 성장 추세는 지속되고 있습니다.
리튬 이온 배터리 팩을 능가하는 에너지 밀도와 안전성
고체 배터리 프로토타입은 500 Wh/kg을 꾸준히 상회하며, 기존 리튬이온 팩의 250-300 Wh/kg 범위를 훨씬 뛰어넘고 있습니다. 이로 인해 전기자동차용 전고체 배터리 시장의 혁신이 촉진되고 있습니다. 또한, 최근 실험실 연구에서는 황화물 전해질에서 5.7 mS/cm의 이온 전도도가 보고되었으며, 기계적 응력 하에서도 구조적 무결성을 유지하고 있습니다. 가연성 액체 전해질을 배제함으로써 열폭주 위험이 감소합니다. 이는 규제 당국과 보험사에게 점점 더 중요한 기준이 되고 있습니다. 따라서 자동차 제조업체는 배터리 팩의 설치 면적을 축소하고, 차량 내 공간을 확보하며, 차량 중량을 줄일 수 있습니다. 이러한 이점은 주행 거리 연장 또는 동일한 주행 거리를 실현하기 위한 배터리 크기 소형화로 이어지며, 둘 다 설계 유연성과 소유 비용 절감을 가져옵니다. 또한, 이 기술은 순수 리튬 금속 음극에도 대응하여 성능 면에서의 격차를 더욱 벌리고, 고급 차량 및 차량 함대용 플랫폼에 매력적인 선택지가 되고 있습니다.
높은 생산 비용과 낮은 제조 수율
현재의 전고체 배터리는 엄격한 수분 관리와 고체 간 계면에서의 까다로운 공차 요건으로 인해 1kWh당 400-500달러로, 현재 리튬 이온 배터리 팩의 평균 비용보다 약 4배나 높습니다. 많은 파일럿 라인에서 수율 저하가 두 자릿수 비율에 달하고 있어, 초기 생산 단계에서 단가 상승을 초래하고 있습니다. 증착 리튬 포일이나 음극 없는 적층과 같은 공정 혁신을 통해 불량률을 절반으로 줄일 가능성이 예상되지만, 상용화를 위한 검증은 현재도 진행 중입니다. 이러한 개선 사항이 실험실에서 생산 라인으로 전환되기 전까지는 높은 가격이 보급을 저해하는 요인이 될 것입니다.
부문별 분석
승용차 부문은 2025년 매출의 73.52%를 차지했으며, 이는 성능과 안전성이 가격 프리미엄을 정당화하는 고부가가치 모델로의 조기 도입을 반영한 것입니다. 상용차 플릿의 점유율은 이에 미치지 못하지만, 운영자들이 장수명 배터리 팩을 통한 총 소유 비용(TCO) 절감과 가동 중단 시간 단축을 중시하고 있기 때문에 2031년까지 연평균 성장률(CAGR)은 38.95%를 나타낼 것으로 전망됩니다. 도요타는 우선 고급 쿠페에 전고체 배터리 팩을 도입하고, 비용이 낮아진 단계에서 해당 화학 기술을 더 폭넓은 라인업으로 확대할 계획입니다. 대조적으로, 차량 관리자는 급속 충전과 내구성을 우선시하기 때문에 유지보수 비용을 절감할 수 있다면 초기 배터리 가격이 비싸더라도 수용하기 쉬운 경향이 있습니다.
부문 동향을 보면 2단계 도입 곡선이 시사됩니다. 먼저 고급 승용차가 브랜드 신뢰성과 기술적 신뢰성을 확립하고, 이어 가동률을 중시하는 소형 밴과 트럭이 뒤따를 것입니다. 보증 데이터가 축적되고 단위 비용이 낮아짐에 따라, 2028년 이후에는 일반 승용차 부문이 판매 대수의 대부분을 차지하게 될 것입니다. 이러한 변화는 고니켈 리튬 이온 배터리 팩이 과거에 전개되어 온 경위를 반영하며, 대중 시장으로의 침투를 위한 발판이 될 것입니다.
BEV는 2025년 출하 대수의 69.45%를 차지했으며, 예측 기간 동안 연평균 성장률(CAGR) 38.60%로 성장할 것으로 전망됩니다. 순수 전기 플랫폼은 이 화학 성분의 높은 에너지 밀도를 활용하여 배터리 팩의 크기를 늘리지 않고도 주행 거리를 연장할 수 있지만, 이러한 이점은 하이브리드 차량의 경우 그다지 중요하지 않습니다. 그럼에도 불구하고, PHEV는 급속 충전의 보급으로 혜택을 받게 되어, 이로 인해 순수 전기 주행 비율이 증가하고 차량군의 배기가스 규제 준수성이 향상될 것입니다.
많은 자동차 제조업체들은 솔리드 스테이트 배터리의 로드맵을 주력 전기차 아키텍처에 맞추고 있습니다. 이는 프리미엄 차종의 이익률을 통해 초기 단계의 높은 셀 비용을 상쇄할 수 있기 때문입니다. 비용이 낮아짐에 따라 PHEV나 시리즈 하이브리드 플랫폼에서는 더 얇고 가벼운 솔리드 스테이트 모듈이 채택되기 시작하며, 이를 통해 공간 확보와 배터리 소형화가 가능해집니다. 동시에, 배기가스 제로를 요구하는 규제적 압박으로 인해 이 기술에 적합한 주요 추진 방식으로서 BEV의 입지가 확고해지고 있습니다.
지역별 분석
2025년, 아시아태평양은 일본의 황화 리튬 밸류체인과 한국의 파일럿 라인에 대한 전문 지식을 바탕으로 40.85%의 점유율로 전고체 배터리 시장을 주도했습니다. 정부의 자금 지원이 셀 연구 개발 및 초기 차량 탑재 프로젝트를 뒷받침하는 한편, 확립된 리튬 이온 배터리 수출 경로가 양산화를 위한 학습 곡선을 단축시키고 있습니다.
북미는 ‘인플레이션 억제법(Inflation Reduction Act)’에 따른 세액 공제와 2030년까지 연간 셀 생산 능력 1,200GWh 이상이라는 목표에 힘입어, 다음 주요 성장 거점으로 부상하고 있습니다. 폭스바겐이 계획 중인 세인트 토마스의 기가팩토리와 여러 스타트업의 파일럿 라인은 국내 조달 의무를 중심으로 생태계가 형성되고 있음을 보여줍니다. 각 기업은 캐나다와 미국에 위치한 코발트, 리튬, 니켈 광상과의 근접성을 활용하여 원자재의 안정적인 공급을 확보하고 있습니다.
중동 및 아프리카는 규모는 작지만, 안전성과 내구성을 이유로 전고체 배터리 기술로 단숨에 전환하는 그린 수소 허브와 전력 회사 규모의 에너지 저장 시범 사업에 힘입어 35.40%라는 가장 높은 연평균 성장률(CAGR)을 기록하고 있습니다. 유럽에서는 독일의 ‘FestBatt’ 이니셔티브와, 향후 10년 말까지 상업 생산을 목표로 하는 여러 파트너로 구성된 컨소시엄을 통해 꾸준한 진전이 이어지고 있습니다. 유럽 자동차 제조업체들의 통합 노력이 향후 수요 증가로 이어질 것으로 예상되며, 민관 자금 풀이 재료 과학 분야의 획기적인 진전을 가속화하고 있습니다.
기타 혜택 :
- 엑셀 형식 시장 예측(ME) 시트
- 3개월간의 애널리스트 지원
자주 묻는 질문
목차
제1장 서론
제2장 조사 방법
제3장 개요
제4장 시장 구도
제5장 시장 규모 및 성장 예측
제6장 경쟁 구도
제7장 시장 기회 및 향후 전망
KTH 26.08.31According to Mordor Intelligence, EV solid-state battery market size in 2026 is estimated at USD 372.09 million, growing from 2025 value of USD 260 million with 2031 projections showing USD 2.23 billion, growing at 43.11% CAGR over 2026-2031.
This report is Segmented by Vehicle Type (Passenger Cars and Commercial Vehicles), Propulsion (Battery Electric Vehicle, Plug-In Hybrid Electric Vehicle (PHEV), and More), Solid Electrolyte Type (Sulfide-Based, Oxide-Based, and More), Anode Material (Lithium-Metal, and More), Battery Capacity (Below 20 Ah, and More), and Geography. The Market Forecasts are Provided in Terms of Value (USD).
Global EV Solid-state Battery Market Trends and Insights
Rapid growth in global EV sales volumes
Global electric-vehicle sales are expected to top 20 million units in 2025, roughly triple 2021 levels, intensifying automakers' search for batteries that charge faster and go farther. China's production dominance gives Asian cell makers early-scale advantages, while commercial-fleet electrification widens demand beyond consumer segments. Larger pack orders allow suppliers to push pilot lines toward higher equipment utilisation, in turn lowering per-kilowatt-hour costs. These dynamics collectively lift the solid-state battery market by expanding both the addressable vehicle pool and the willingness of buyers to pay technology premiums. Regional variations persist, but the overall trajectory remains upward as safety and range anxieties decline.
Energy-density and safety edge over Li-ion packs
Solid-state prototypes routinely exceed 500 Wh/kg, far above the 250-300 Wh/kg range of conventional lithium-ion packs, driving innovation in the EV Solid-state Battery Market, and recent laboratory work reports ionic conductivities of 5.7 mS/cm for sulfide electrolytes while retaining structural integrity under mechanical stress. Removing flammable liquid electrolytes lowers thermal-runaway risk, an increasingly important criterion for regulators and insurers. Automakers can therefore shrink pack footprints, recapture cabin space, and trim vehicle mass. These benefits translate into longer driving ranges or smaller batteries for the same range, both of which unlock design flexibility and cost-of-ownership gains. The technology's tolerance for pure lithium-metal anodes further widens the performance gap, creating a compelling pull for high-end and fleet platforms.
High production cost and low manufacturing yield
Present solid-state cells cost USD 400-500 per kWh, roughly four times the average cost of today's lithium-ion packs, due to strict moisture controls and tight tolerances at solid-solid interfaces. Yield losses reach double-digit percentages on many pilot lines, amplifying unit costs during early runs. Process innovations, such as vapour-deposited lithium foils and anode-free stacking, show promise in halving defect rates, yet industrial validation is still underway. Until these improvements move from lab to line, price premiums will restrain widespread rollout.
Other drivers and restraints analyzed in the detailed report include:
- Government ZEV mandates and battery incentives
- Automaker in-house pilot lines (Toyota, VW, BMW)
- Limited gigascale capacity before 2028
For complete list of drivers and restraints, kindly check the Table Of Contents.
Segment Analysis
The passenger-car segment generated 73.52% of 2025 revenue, reflecting early deployments in high-value models where performance and safety command price premiums. Commercial fleets trail in share yet post a 38.95% CAGR to 2031 as operators weigh total-cost-of-ownership savings from longer-lasting packs and reduced downtime. Toyota plans to launch solid-state packs first in luxury coupes, then cascade the chemistry to broader line-ups once costs fall. Fleet managers, by contrast, prioritise rapid charging and durability, making them receptive to higher upfront battery prices that cut maintenance.
The segment pattern indicates a two-wave adoption curve: personal-luxury vehicles establish brand credibility and engineering reliability, followed by light-duty vans and trucks that prize utilisation rates. As warranty data accumulate and unit costs slide, mainstream passenger segments will account for the bulk of unit volumes post-2028. This shift mirrors the historical rollout of high-nickel lithium-ion packs and creates a stepping-stone to mass-market penetration.
BEVs absorbed 69.45% of shipments in 2025 and are forecast to grow at 38.60% CAGR over the outlook period. Pure-electric platforms exploit the chemistry's high energy density to extend range without enlarging packs, an advantage less critical to hybrids. PHEVs nonetheless gain from faster charge acceptance, which raises electric-only driving fractions and improves fleet emissions compliance.
Most automakers align their solid-state roadmaps with flagship electric architectures because premium margins can cover early cell premiums. As costs decline, PHEV and series-hybrid platforms will adopt thinner, lighter solid-state modules that free up packaging space or allow battery downsizing. In parallel, regulatory pressure for zero tailpipe emissions cements BEVs as the dominant propulsion fit for the technology.
Complete Report Scope:
- By Vehicle Type
- Passenger Cars
- Commercial Vehicles
- By Propulsion
- Battery Electric Vehicle (BEV)
- Plug-in Hybrid Electric Vehicle (PHEV)
- Hybrid Electric Vehicle (HEV)
- By Solid Electrolyte Type
- Sulfide-based
- Oxide-based
- Polymer-based
- By Anode Material
- Lithium-Metal
- Silicon-Composite
- Graphite-Composite
- By Battery Capacity
- Below 20 Ah
- 20 to 100 Ah
- Above 100 Ah
- By Geography
- North America
- United States
- Canada
- Rest of North America
- South America
- Europe
- Germany
- United Kingdom
- France
- Spain
- Russia
- Rest of Europe
- Asia-Pacific
- China
- Japan
- South Korea
- India
- Australia
- Rest of Asia-Pacific
- Middle East and Africa
- Saudi Arabia
- UAE
- South Africa
- Egypt
- Nigeria
- Rest of Middle East and Africa
- North America
Geography Analysis
Asia-Pacific led the solid-state battery market with 40.85% share in 2025, anchored by Japan's lithium-sulfide value chain and South Korea's pilot-line expertise. Government funding underpins cell R&D and early vehicle integration projects, while established lithium-ion export corridors shorten scale-up learning curves.
North America, supported by Inflation Reduction Act credits and a target of more than 1,200 GWh annual cell capacity by 2030, emerges as the next major growth pole. Volkswagen's planned St. Thomas gigafactory and multiple start-up pilot lines point to an ecosystem forming around domestic supply mandates. Companies leverage proximity to cobalt, lithium, and nickel deposits in Canada and the United States to secure raw-material resilience.
The Middle East and Africa register the highest CAGR at 35.40%, albeit from a small base, driven by green-hydrogen hubs and utility-scale storage pilots that leapfrog to solid-state chemistries for safety and durability reasons. Europe maintains steady progress with Germany's FestBatt initiative and multi-partner consortia targeting commercial output by decade's end. European automakers' integration efforts ensure eventual demand pull, while public-private funding pools accelerate material science breakthroughs.
- Toyota Motor Corporation
- Volkswagen AG
- Samsung SDI Co Ltd
- LG Energy Solution Ltd
- QuantumScape Corp
- CATL
- BYD Co Ltd
- Solid Power Inc
- Panasonic Holdings Corp
- ProLogium Technology Co Ltd
- Nissan Motor Co Ltd
- BMW AG
- Ford Motor Co
- Stellantis NV
- Hyundai Motor Co
Additional Benefits:
- The market estimate (ME) sheet in Excel format
- 3 months of analyst support
TABLE OF CONTENTS
1 Introduction
- 1.1 Study Assumptions and Market Definition
- 1.2 Scope of the Study
2 Research Methodology
3 Executive Summary
4 Market Landscape
- 4.1 Market Overview
- 4.2 Market Drivers
- 4.2.1 Rapid growth in global EV sales volumes
- 4.2.2 Energy-density and safety edge over Li-ion packs
- 4.2.3 Government ZEV mandates and battery incentives
- 4.2.4 Automaker in-house pilot lines (Toyota, VW, BMW)
- 4.2.5 Roll-to-roll sulfide electrolyte cost break-throughs
- 4.2.6 Insurance-sector push to cut battery-fire liabilities
- 4.3 Market Restraints
- 4.3.1 High production cost and low manufacturing yield
- 4.3.2 Limited gigascale capacity before 2028
- 4.3.3 Supply pinch in ultra-pure lithium-metal foils
- 4.3.4 Uncertain recycling pathways for solid electrolytes
- 4.4 Value / Supply-Chain Analysis
- 4.5 Porter,s Five Forces Analysis
- 4.5.1 Threat of New Entrants
- 4.5.2 Bargaining Power of Buyers
- 4.5.3 Bargaining Power of Suppliers
- 4.5.4 Threat of Substitutes
- 4.5.5 Intensity of Competitive Rivalry
- 4.6 Investment and Funding Landscape
5 Market Size and Growth Forecasts
- 5.1 By Vehicle Type
- 5.1.1 Passenger Cars
- 5.1.2 Commercial Vehicles
- 5.2 By Propulsion
- 5.2.1 Battery Electric Vehicle (BEV)
- 5.2.2 Plug-in Hybrid Electric Vehicle (PHEV)
- 5.2.3 Hybrid Electric Vehicle (HEV)
- 5.3 By Solid Electrolyte Type
- 5.3.1 Sulfide-based
- 5.3.2 Oxide-based
- 5.3.3 Polymer-based
- 5.4 By Anode Material
- 5.4.1 Lithium-Metal
- 5.4.2 Silicon-Composite
- 5.4.3 Graphite-Composite
- 5.5 By Battery Capacity
- 5.5.1 Below 20 Ah
- 5.5.2 20 to 100 Ah
- 5.5.3 Above 100 Ah
- 5.6 By Geography
- 5.6.1 North America
- 5.6.1.1 United States
- 5.6.1.2 Canada
- 5.6.1.3 Rest of North America
- 5.6.2 South America
- 5.6.3 Europe
- 5.6.3.1 Germany
- 5.6.3.2 United Kingdom
- 5.6.3.3 France
- 5.6.3.4 Spain
- 5.6.3.5 Russia
- 5.6.3.6 Rest of Europe
- 5.6.4 Asia-Pacific
- 5.6.4.1 China
- 5.6.4.2 Japan
- 5.6.4.3 South Korea
- 5.6.4.4 India
- 5.6.4.5 Australia
- 5.6.4.6 Rest of Asia-Pacific
- 5.6.5 Middle East and Africa
- 5.6.5.1 Saudi Arabia
- 5.6.5.2 UAE
- 5.6.5.3 South Africa
- 5.6.5.4 Egypt
- 5.6.5.5 Nigeria
- 5.6.5.6 Rest of Middle East and Africa
- 5.6.1 North America
6 Competitive Landscape
- 6.1 Market Concentration
- 6.2 Strategic Moves
- 6.3 Market Share Analysis
- 6.4 Company Profiles (includes Global Level Overview, Market Level Overview, Core Segments, Financials as Available, Strategic Information, Market Rank/Share for Key Companies, Products and Services, SWOT Analysis, and Recent Developments)
- 6.4.1 Toyota Motor Corporation
- 6.4.2 Volkswagen AG
- 6.4.3 Samsung SDI Co Ltd
- 6.4.4 LG Energy Solution Ltd
- 6.4.5 QuantumScape Corp
- 6.4.6 CATL
- 6.4.7 BYD Co Ltd
- 6.4.8 Solid Power Inc
- 6.4.9 Panasonic Holdings Corp
- 6.4.10 ProLogium Technology Co Ltd
- 6.4.11 Nissan Motor Co Ltd
- 6.4.12 BMW AG
- 6.4.13 Ford Motor Co
- 6.4.14 Stellantis NV
- 6.4.15 Hyundai Motor Co


