

|
시장보고서
상품코드
2116510
헬스케어 장비 리스 : 시장 점유율 분석, 업계 동향 및 통계, 성장 예측(2026-2031년)Healthcare Equipment Leasing - Market Share Analysis, Industry Trends & Statistics, Growth Forecasts (2026 - 2031) |
||||||
 Mordor Intelligence
Mordor Intelligence에 의하면, 헬스케어 장비 리스 시장 규모는 2025년 1,298억 3,000만 달러로 평가되었습니다. 2026년에는 1,496억 9,000만 달러로 확대되어 2026년부터 2031년에 걸쳐 CAGR 15.29%로 성장을 지속하여, 2031년에는 3,049억 3,000만 달러에 이를 것으로 예측됩니다.
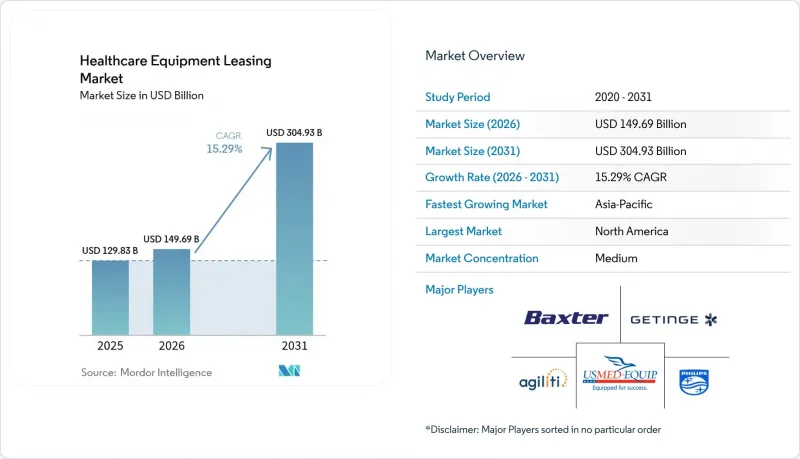
본 보고서는 제품별(영상 진단 장비 등), 리스 유형별(운영 리스 등), 최종 사용자별(병원 및 진료소 등), 기간별(단기, 중기, 장기), 지역별(북미, 유럽, 아시아태평양, 중동 및 아프리카, 남미)로 분류되어 있습니다. 시장 예측은 금액(달러) 기준으로 제시되어 있습니다.
세계의 헬스케어 장비 리스 시장 동향 및 인사이트
의료 기술에 대한 설비 투자 확대
MRI, CT, 로봇 수술 플랫폼의 가격이 수백만 달러를 초과하는 반면, 상환 일정이 엄격해짐에 따라 병원들은 자본 배분 측면에서 압박에 직면하고 있습니다. 리스를 활용함으로써 이러한 비용을 대차대조표에서 예측 가능한 영업 비용으로 전환하고, 임상 프로그램에 할당할 자금을 확보할 수 있습니다. 지멘스 헬스인어즈(Siemens Healthineers)와 타워 헬스(Tower Health) 간의 10년에 걸친 ‘밸류 파트너십(Value Partnership)’은 이 모델을 여실히 보여주며, 장비, 수명 주기 관리 및 노후화를 완화하기 위한 업그레이드를 하나의 패키지로 묶고 있습니다. 의료 제공업체들은 확보한 자본을 환자 중심의 이니셔티브에 재투자하면서도 최첨단 기술을 지속적으로 확보하고 있습니다. 고성능 영상 진단 및 치료 시스템이 2-3년마다 진화하는 가운데, 의료장비 리스 시장은 대규모 설비 투자의 급증 없이 현대화를 도모할 수 있는 바람직한 수단이 되고 있습니다.
의료 분야의 자산 경량화 운영 모델로의 전환
의료 시스템은 장비 소유가 아닌 임상 성과에 집중하기 위해 자산 경량화 전략을 채택하고 있습니다. ‘Everything-as-a-Service(EaaS)’형 계약에서는 일괄 구매 대신 성과 연동형 월정액 요금이 채택되어, 기술 이용과 제공되는 가치가 연동되도록 되어 있습니다. 이 모델은 레버리지 지표를 개선하고 감가상각 부담을 완화하는 동시에, 불확실한 경제 상황 하에서 기동성을 높여줍니다. 의료 기관은 확보된 자본을 원격 의료, 인재 확보, 디지털 접수 시스템 구축에 재투자하는 한편, 리스 회사는 감가상각 관리를 전문으로 담당합니다. 급속한 혁신 주기와 제한된 예산 사이의 격차가 확대되는 가운데, 리스는 헬스케어 장비 리스 시장 전체에서 재무적 회복력의 핵심 축으로서 확고한 입지를 다지고 있습니다.
엄격한 회계 기준으로 인해 대차대조표상의 부채 증가
ASC 842 및 IFRS 16에 따라 의료 시스템은 리스 부채를 계상해야 할 의무가 있으며, 기존의 대차대조표 외 계상의 이점은 줄어들고 있습니다. 이러한 변화로 인해 보고되는 레버리지 비율이 상승하고, 부채 계약 준수가 복잡해짐에 따라 CFO들은 구매 및 리스 모델을 재검토할 수밖에 없게 되었습니다. 현재 운영 리스는 금융 리스와 함께 계상되게 되어, 대출을 통한 자금 조달과의 격차가 줄어들고 있습니다. 미국 은행의 자문 부서는 신용등급 심사 과정에서 적절한 분류가 여전히 필수적이라고 지적하고 있습니다. 투명성은 향상되겠지만, 이 규정에 따라 주요 부채 지표에 민감한 조직의 경우, 의료장비 리스 시장의 과도한 성장이 억제될 것입니다.
부문별 분석
영상 진단 분야는 2025년 매출의 28.05%를 차지했으며, 이는 치료 과정에서 이 분야가 수행하는 중요한 역할과 막대한 설비 투자가 필요함을 여실히 보여줍니다. MRI, CT, 초음파 진단 장비는 고액의 리스 요금이 책정되어 있어, 의료 기관은 임상 처리 능력을 저해하는 장비 노후화를 방지하기 위해 이러한 리스 계약에 의존하고 있습니다. 종양학 및 심장학 분야에서 정밀 진단과 최소 침습 치료에 대한 수요가 증가하는 가운데, 의료기기 시장 내 영상 진단 분야의 점유율은 안정적입니다.
디지털·전자 기기는 AI 통합형 모니터, 커넥티드 인공호흡기, 스마트 주입 펌프에 힘입어 제품 카테고리 중 가장 높은 연평균 성장률(CAGR) 17.12%로 확대되고 있습니다. 기술 주기가 짧기 때문에 2-3년의 리스 기간과 주기 중반에 업그레이드가 일반적입니다. 상호 운용성 요건으로 인해 병원이 플랫폼 개편을 강요받는 가운데, 커넥티드 기기의 의료기기 시장 규모는 확대되고 있습니다. 환자 모니터링, 생명 유지 장치, 수술용 로봇은 교육 및 분석 지원을 포함한 리스 프로그램의 뒷받침을 받아 꾸준한 성장세를 보이고 있습니다. 내구성이 뛰어난 의료기기 및 임상 검사 분석 장비는 예측 가능한 교체 일정을 유지하고 있는 반면, 휴대용 재택 간호 기기는 고령화가 진행되는 사회에서 헬스케어 장비 리스 시장의 새로운 분야를 개척하고 있습니다.
2025년 거래 중 운영리스는 63.68%를 차지했으며, 계약 기간 종료 시 유연한 선택권과 노후화 위험을 상쇄할 수 있다는 점에서 지지를 받고 있습니다. 병원들은 이러한 계약 형태를 예산 주기에 맞추어 조정하고, 계절적 수술 건수에 따라 변동 사용 조항을 포함하는 경우가 많습니다. 운영 리스 계약과 연계된 헬스케어 장비 리스 시장 규모는 신용 한도를 확보할 수 있는 예측 가능한 월별 지불의 혜택을 받고 있습니다.
관리형 장비 서비스 계약은 연평균 성장률(CAGR) 17.24%로 확대되고 있으며, 이는 하드웨어, 소프트웨어 및 관리 서비스를 결합한 턴키 솔루션에 대한 수요를 반영합니다. 리스 회사는 유지보수, 규정 준수 및 성과 지표에 대한 책임을 맡음으로써 의료 기관의 운영 부담을 경감시킵니다. 자본 리스는 방사선 치료실과 같은 수명이 긴 자산에 대해 향후 소유권 취득을 목표로 하는 의료 기관에 매력적이며, 한편 세일 앤 리스백(Sale and Leaseback) 구조는 기존 장비군을 현금화하여 디지털화 업그레이드 자금으로 충당하는 방식입니다. 풀서비스 모델의 매력이 높아지고 있다는 점은 헬스케어 장비 리스 시장이 단순한 자금 조달 수단에서 통합된 성과 파트너십으로 진화하고 있음을 보여줍니다.
지역별 분석
북미는 정교한 상환 모델, 확립된 리스 인프라, 그리고 운영상의 유연성을 중시하는 규제 당국의 지원에 힘입어 2025년 매출의 41.25%를 차지했습니다. 의료 서비스 제공업체들은 가동 시간과 지속적인 업데이트를 보장하는 서비스 계약을 통해 자본 집약적인 영상 진단실 및 수술용 로봇을 갱신하고 있습니다. 이 지역의 의료기기 시장 규모는 병원의 이익률 압박과 경쟁력 있는 기술 벤치마킹의 혜택을 받고 있습니다.
유럽에서는 현대화 프로그램과 국경을 초월한 조달 이니셔티브를 통해 리스 체계가 표준화되어 꾸준한 성장을 이루고 있습니다. 고령화 및 디지털 헬스 관련 지침으로 인해 영상 진단, 정맥 주사, 모니터링 시스템 분야에서 정기적인 갱신 주기가 형성되고 있습니다. 연평균 성장률(CAGR) 16.08%로 가장 빠르게 성장하고 있는 아시아태평양에서는 중국, 인도, 아세안(ASEAN) 국가들을 중심으로 인프라 구축이 급속히 진행되고 있습니다. 민관 파트너십, 중산층 수요 증가, 임상 역량 부족으로 인해 리스는 시설의 적시 확장에 필수적인 요소가 되었습니다. 중동 및 아프리카에서는 걸프 연안 국가들의 정부 프로젝트가 새로운 전문 의료 센터를 위해 턴키 방식의 리스 패키지를 도입함에 따라 수요가 서서히 증가하고 있습니다. 남미에서는 경제 안정과 연동된 주기적인 수요 증가가 나타나고 있으며, 브라질과 칠레의 민간 보험사들은 AI를 활용한 진단 기술을 중시하고 있습니다. 이러한 지역적 확산은 헬스케어 장비 리스 시장이 규제, 재정, 임상상의 미묘한 차이에 맞추어 계약 조건을 조정함으로써, 시장의 성숙도와 관계없이 확대되고 있음을 보여줍니다.
기타 혜택 :
- 엑셀 형식 시장 예측(ME) 시트
- 3개월간의 애널리스트 지원
자주 묻는 질문
목차
제1장 서론
제2장 조사 방법
제3장 개요
제4장 시장 구도
제5장 시장 규모 및 성장 예측
제6장 경쟁 구도
제7장 시장 기회 및 향후 전망
KTH 26.08.31According to Mordor Intelligence, the healthcare equipment leasing market size is expected to grow from USD 129.83 billion in 2025 to USD 149.69 billion in 2026 and is forecast to reach USD 304.93 billion by 2031 at 15.29% CAGR over 2026-2031.
This report is Segmented by Product (Diagnostic Imaging Equipment, and More), Lease Type (Operating Lease, and More), End User (Hospitals & Clinics, and More), Duration (Short-Term, Medium-Term, Long-Term), and Geography (North America, Europe, Asia-Pacific, Middle East & Africa, South America). The Market Forecasts are Provided in Terms of Value (USD).
Global Healthcare Equipment Leasing Market Trends and Insights
Escalating Capital Expenditure for Medical Technology
Hospitals face capital allocation stress as MRI, CT, and robotic surgery platforms exceed multi-million-dollar price points while reimbursement schedules tighten. Leasing shifts these costs from balance sheets to predictable operating lines, freeing cash for clinical programs. Siemens Healthineers' 10-year value partnership with Tower Health illustrates the model, bundling equipment, lifecycle management, and upgrades to mitigate obsolescence. Providers redirect preserved capital toward patient-centric initiatives yet still secure leading-edge technology. As high-spec imaging and therapy systems evolve every two to three years, the healthcare equipment leasing market becomes the preferred pathway for modernization without large-scale capex spikes.
Shift Toward Asset-Light Operating Models in Healthcare
Health systems adopt asset-light strategies to concentrate on clinical outcomes rather than equipment ownership. Everything-as-a-Service arrangements replace lump-sum purchases with performance-linked monthly fees, aligning technology use with value delivered. The model improves leverage metrics, reduces depreciation pressure, and enhances agility in uncertain economic climates. Providers allocate freed capital to telehealth, workforce retention, and digital front-door initiatives while lessors specialize in depreciation management. The widening gap between brisk innovation cycles and limited budgets cements leasing as a core pillar of financial resilience across the healthcare equipment leasing market.
Stringent Accounting Standards Increasing On-Balance-Sheet Liabilities
ASC 842 and IFRS 16 oblige health systems to record lease liabilities, reducing prior off-balance-sheet advantages. The change raises reported leverage, complicates debt-covenant compliance, and forces CFOs to revisit purchase-versus-lease models. Operating leases now appear alongside finance leases, narrowing the gap to loan financing. U.S. Bank's advisory notes that proper classification remains vital for rating reviews. Although transparency improves, the rule tempers aggressive growth in the healthcare equipment leasing market for organizations sensitive to headline debt metrics.
Other drivers and restraints analyzed in the detailed report include:
- Expansion of Diagnostic Imaging and Surgical Infrastructure
- Rise of Outcome-Based Managed Equipment Service Contracts
- Availability of Refurbished and Second-Life Equipment Alternatives
For complete list of drivers and restraints, kindly check the Table Of Contents.
Segment Analysis
Diagnostic imaging held 28.05% of 2025 revenue, underscoring its critical role in treatment pathways and its sizable capital requirements. MRI, CT, and ultrasound systems command premium lease rates, and providers rely on these arrangements to avoid aging fleets that hinder clinical throughput. The healthcare equipment market share for imaging remains stable as demand for precision diagnostics and minimally invasive interventions rises in oncology and cardiology.
Digital and electronic equipment is advancing at 17.12% CAGR, the highest among product categories, propelled by AI-integrated monitors, connected ventilators, and smart IV pumps. Short technology cycles encourage two- to three-year terms with mid-cycle upgrades. The healthcare equipment market size for connected devices widens as interoperability mandates push hospitals toward platform overhaul. Patient monitoring, life-support, and surgical robotics follow with steady gains, each supported by leasing programs that bundle training and analytics support. Durable medical equipment and laboratory analyzers sustain predictable replacement schedules, while portable home-care devices open a new frontier for the healthcare equipment leasing market among aging populations.
Operating leases represented 63.68% of 2025 transactions, favored for their flexible end-of-term options and off-setting of obsolescence risk. Hospitals align these structures with budget cycles, often embedding variable usage clauses to match seasonal procedure volumes. The healthcare equipment leasing market size tied to operating agreements benefits from predictable monthly payments that preserve credit lines.
Managed equipment service agreements are expanding at 17.24% CAGR, reflecting demand for turnkey solutions that combine hardware, software, and managed services. Lessors assume maintenance, compliance, and performance metrics, easing the operational burden on providers. Capital leases appeal to institutions targeting eventual ownership for long-life assets such as radiotherapy vaults, while sale-leaseback structures monetize legacy fleets to fund digital upgrades. The growing appeal of full-service models demonstrates the healthcare equipment leasing market progression from financing tool to integrated performance partnership.
Complete Report Scope:
- By Product
- Diagnostic Imaging Equipment
- Durable Medical Equipment
- Surgical & Therapy Equipment
- Patient Monitoring & Life-support
- Digital & Electronic Equipment
- Storage & Transport Equipment
- Home-care Equipment
- Laboratory & Analytical Equipment
- By Lease Type
- Operating Lease
- Capital/Finance Lease
- Sale-Leaseback
- Managed Equipment Service Agreement
- By End User
- Hospitals & Clinics
- Diagnostic Imaging Centers
- Ambulatory Surgical Centers
- Home Healthcare Providers
- Long-term Care & Rehabilitation Facilities
- By Duration
- Short-term (< 12 months)
- Medium-term (1-3 years)
- Long-term (> 3 years)
- Geography
- North America
- United States
- Canada
- Mexico
- Europe
- Germany
- United Kingdom
- France
- Italy
- Spain
- Rest of Europe
- Asia-Pacific
- China
- Japan
- India
- Australia
- South Korea
- Rest of Asia-Pacific
- Middle East & Africa
- GCC
- South Africa
- Rest of Middle East & Africa
- South America
- Brazil
- Argentina
- Rest of South America
- North America
Geography Analysis
North America contributed 41.25% of 2025 revenue, supported by sophisticated reimbursement models, established leasing infrastructure, and regulators that value operational flexibility. Providers replace capital-intensive imaging suites and surgical robots via service contracts that ensure uptime and continuous updates. The healthcare equipment market size in the region benefits from tight hospital margins and competitive technology benchmarks.
Europe posts steady growth as modernization programs and cross-border procurement initiatives standardize leasing frameworks. Aging populations and digital health directives create recurring replacement cycles for imaging, infusion, and monitoring systems. Asia-Pacific, the fastest-growing territory at 16.08% CAGR, witnesses rapid infrastructure build-out across China, India, and ASEAN states. Public-private partnerships, rising middle-class demand, and clinical capacity shortages make leasing integral to timely facility expansion. Middle East and Africa add incremental demand as government projects in the Gulf integrate turnkey leasing packages for new specialty centers. South America experiences cyclical uptake tied to economic stability, with private payers in Brazil and Chile emphasizing AI-enhanced diagnostics. The geographic spread underscores that the healthcare equipment leasing market scales across maturity levels by tailoring contract terms to regulatory, fiscal, and clinical nuances.
- Agiliti Health Inc.
- Avensys UK Ltd.
- Baxter
- GE Healthcare
- Getinge
- Koninklijke Philips
- Med One Group
- Mizuho Leasing Company Ltd.
- Prudential Leasing
- Siemens Healthineers
- US Med-Equip
- De Lage Landen International (DLL)
- Stryker
- Siemens Financial Services
- Key Equipment Finance
- Meridian Leasing Corp.
- First American Healthcare Finance
- Canon Medical Systems USA Inc.
- National Technology Leasing Services
- Dragerwerk
- Hill-Rom
Additional Benefits:
- The market estimate (ME) sheet in Excel format
- 3 months of analyst support
TABLE OF CONTENTS
1 Introduction
- 1.1 Study Assumptions & Market Definition
- 1.2 Scope of the Study
2 Research Methodology
3 Executive Summary
4 Market Landscape
- 4.1 Market Overview
- 4.2 Market Drivers
- 4.2.1 Escalating Capital Expenditure for Medical Technology
- 4.2.2 Shift Toward Asset-Light Operating Models In Healthcare
- 4.2.3 Expansion of Diagnostic Imaging And Surgical Infrastructure
- 4.2.4 Growing Preference for Operational Flexibility And Cash-Flow Management
- 4.2.5 Acceleration of Technology Refresh Cycles in Medtech
- 4.2.6 Rise of Outcome-Based Managed Equipment Service Contracts
- 4.3 Market Restraints
- 4.3.1 Stringent Accounting Standards Increasing on-Balance-Sheet Liabilities
- 4.3.2 Availability of Refurbished and Second-Life Equipment Alternatives
- 4.3.3 Rising Cybersecurity and Data-Privacy Compliance Costs
- 4.3.4 Limited Awareness of Leasing Benefits Among Small Healthcare Providers
- 4.4 Regulatory Landscape
- 4.5 Porter's Five Forces Analysis
- 4.5.1 Threat of New Entrants
- 4.5.2 Bargaining Power of Buyers/Consumers
- 4.5.3 Bargaining Power of Suppliers
- 4.5.4 Threat of Substitute Products
- 4.5.5 Intensity of Competitive Rivalry
5 Market Size & Growth Forecasts (Value, USD)
- 5.1 By Product
- 5.1.1 Diagnostic Imaging Equipment
- 5.1.2 Durable Medical Equipment
- 5.1.3 Surgical & Therapy Equipment
- 5.1.4 Patient Monitoring & Life-support
- 5.1.5 Digital & Electronic Equipment
- 5.1.6 Storage & Transport Equipment
- 5.1.7 Home-care Equipment
- 5.1.8 Laboratory & Analytical Equipment
- 5.2 By Lease Type
- 5.2.1 Operating Lease
- 5.2.2 Capital/Finance Lease
- 5.2.3 Sale-Leaseback
- 5.2.4 Managed Equipment Service Agreement
- 5.3 By End User
- 5.3.1 Hospitals & Clinics
- 5.3.2 Diagnostic Imaging Centers
- 5.3.3 Ambulatory Surgical Centers
- 5.3.4 Home Healthcare Providers
- 5.3.5 Long-term Care & Rehabilitation Facilities
- 5.4 By Duration
- 5.4.1 Short-term (< 12 months)
- 5.4.2 Medium-term (1-3 years)
- 5.4.3 Long-term (> 3 years)
- 5.5 Geography
- 5.5.1 North America
- 5.5.1.1 United States
- 5.5.1.2 Canada
- 5.5.1.3 Mexico
- 5.5.2 Europe
- 5.5.2.1 Germany
- 5.5.2.2 United Kingdom
- 5.5.2.3 France
- 5.5.2.4 Italy
- 5.5.2.5 Spain
- 5.5.2.6 Rest of Europe
- 5.5.3 Asia-Pacific
- 5.5.3.1 China
- 5.5.3.2 Japan
- 5.5.3.3 India
- 5.5.3.4 Australia
- 5.5.3.5 South Korea
- 5.5.3.6 Rest of Asia-Pacific
- 5.5.4 Middle East & Africa
- 5.5.4.1 GCC
- 5.5.4.2 South Africa
- 5.5.4.3 Rest of Middle East & Africa
- 5.5.5 South America
- 5.5.5.1 Brazil
- 5.5.5.2 Argentina
- 5.5.5.3 Rest of South America
- 5.5.1 North America
6 Competitive Landscape
- 6.1 Market Concentration
- 6.2 Market Share Analysis
- 6.3 Company Profiles (includes Global level Overview, Market level overview, Core Business Segments, Financials, Headcount, Key Information, Market Rank, Market Share, Products and Services, and analysis of Recent Developments)
- 6.3.1 Agiliti Health Inc.
- 6.3.2 Avensys UK Ltd.
- 6.3.3 Baxter International Inc.
- 6.3.4 GE Healthcare
- 6.3.5 Getinge AB
- 6.3.6 Koninklijke Philips N.V.
- 6.3.7 Med One Group
- 6.3.8 Mizuho Leasing Company Ltd.
- 6.3.9 Prudential Leasing Inc.
- 6.3.10 Siemens Healthineers AG
- 6.3.11 US Med-Equip
- 6.3.12 De Lage Landen International (DLL)
- 6.3.13 Stryker Corporation
- 6.3.14 Siemens Financial Services
- 6.3.15 Key Equipment Finance
- 6.3.16 Meridian Leasing Corp.
- 6.3.17 First American Healthcare Finance
- 6.3.18 Canon Medical Systems USA Inc.
- 6.3.19 National Technology Leasing Services
- 6.3.20 Dragerwerk AG & Co. KGaA
- 6.3.21 Hill-Rom Holdings Inc.
7 Market Opportunities & Future Outlook
- 7.1 White-space & Unmet-Need Assessment


