|
시장보고서
상품코드
2117287
저비용 항공사(LCC) 시장 : 시장 점유율 분석, 업계 동향 및 통계, 성장 예측(2026-2031년)Low-Cost Carrier - Market Share Analysis, Industry Trends & Statistics, Growth Forecasts (2026 - 2031) |
||||||
 Mordor Intelligence
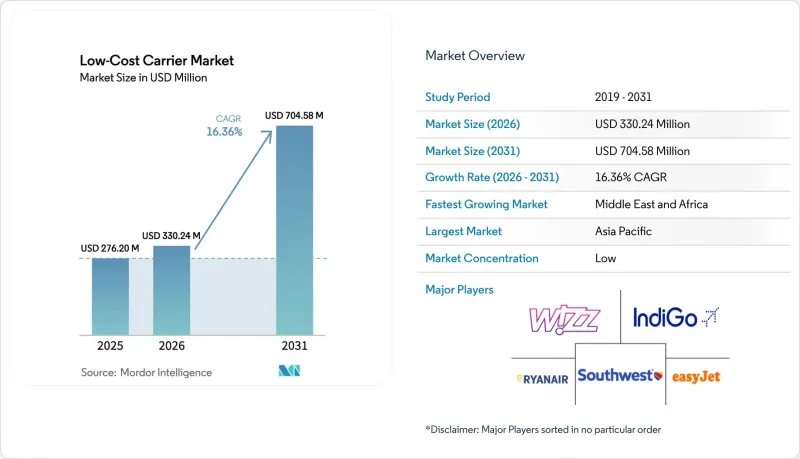
Mordor Intelligence에 의하면, 저비용 항공사(LCC) 시장 규모는 2025년 2억 7,620만 달러로 평가되었고, 2026년에는 3억 3,024만 달러로 추정되고, 2026-2031년 CAGR 16.36%로 성장을 지속할 전망이며, 2031년에는 7억 458만 달러에 이를 것으로 예측됩니다.
본 보고서는 항공기 유형별(나로우드기, 와이드바디기), 목적지별(국내선, 국제선), 항로 거리별(단거리, 중거리, 장거리), 유통 채널별(온라인 직접 판매, 여행사), 지역별(북미, 유럽, 아시아태평양, 남미, 중동 및 아프리카)로 분류되어 있습니다. 시장 전망은 금액(달러) 기준으로 제시되어 있습니다.
세계의 저비용 항공사(LCC) 시장 동향 및 인사이트
가격에 민감한 레저 여행 및 VFR 여행 수요의 지속적인 성장
친구나 친척 방문은 국제선 승객의 20-30%를 차지하며, 비즈니스 여행보다 가격 탄력성이 높기 때문에 기존 항공사보다 30-50% 저렴한 운임에 대한 수요가 촉진되고 있습니다. 인도의 중산층 확대에 따라 50달러 미만의 편도 항공편에 대한 수요가 증가함에 따라, IndiGo는 2025 회계연도 3분기까지 하루 2,000편 이상의 운항을 달성할 것으로 예측됩니다. 남아시아-걸프 국가, 남미-미국, 동유럽-서유럽과 같이 이용 빈도가 높은 이민 경로는 여행이 사실상 필수적이기 때문에 경기 침체 시에도 탑승률을 지탱해 주고 있습니다. 동적 가격 책정을 통해 긴 연휴 기간을 여러 운임 구역으로 나누어, 탑승률을 저하시키지 않으면서 수익성을 높이고 있습니다. 개인 여행 증가에 따라 예약은 직접 유통 채널로 이동하고 있으며, 항공사는 부가 서비스 수익을 모두 확보할 수 있게 되었습니다. 주요 저비용 항공사에서는 휴대전화 보급률이 70%를 초과하여, 출발 직전에 좌석, 수하물, 기내식, 보험을 판매하는 푸시형 오퍼가 가능해졌습니다.
비용 효율적인 협폭기 운항을 가능하게 하는 단일 기종 중심의 기체 전략
단일 기체 계열을 운용함으로써 훈련, 부품 재고, 승무원 편성의 복잡성이 단순화되어 지속적인 비용 우위를 확보할 수 있습니다. 라이언에어의 전 기종 B737 모델이나 사우스웨스트 항공의 B737 집중 운항을 통해, 조종사의 공동 풀화와 대기 인력을 최소화할 수 있게 되었습니다. A320neo 계열은 구형 기종에 비해 연료 소비량이 15-20% 적어, 직접 운항 비용을 30-40% 절감하고 있습니다. 인디고는 2023년에 A320neo 계열 500대의 인도를 확보하여, OEM의 수주 잔고가 7년 이상에 달하는 상황에서도 리스료 인상의 영향을 받지 않고 있습니다. 객실의 통일화로 지상 체류 시간이 단축됩니다. 이지젯(EasyJet)의 표준화된 갤리와 단일 클래스 좌석 배치를 통해 30분 미만의 턴어라운드가 가능해져, 하루 11-13시간의 가동률을 뒷받침하고 있습니다.
기체 및 엔진 공급망의 구조적 제약으로 인한 기단 확대 제한
에어버스는 2025년에 최대 800대의 제트기를 인도할 계획이었으나, CFM LEAP 엔진공급 부족과 기체 품질 문제에 직면하여 인도가 지연되었습니다. 보잉의 B737 MAX 생산 라인도 제조 감사를 받으며 목표 일정에 뒤처지고 있어, 많은 저비용 항공사들은 구형 기종의 리스 기간을 연장할 수밖에 없게 되었습니다. 2024-2025년 A321neo와 B737 MAX 각 모델의 리스 요율은 15% 이상 상승했으며, 연료비 절감이 자본 비용 상승을 상쇄하지 못할 경우 수익성이 압박받는 상황이 되고 있습니다. 수주 잔고가 7년 이상 앞으로 밀려나 있어, 항공사들은 수요 급증에 대응할 만큼 신속하게 기체 규모를 확대할 수 없게 되었고, 그 결과 시장 성장이 억제되고 있습니다.
부문 분석
2025년에는 나로우바디 항공기가 수송 능력의 82.01%를 차지했으며, LCC 시장의 경제적 기반으로서의 위상을 확고히 하고 있습니다. 지방 공항의 활주로, 게이트 규모, 여객 수는 단일 통로 항공기 운항에 맞추어 설계되어 있기 때문에 나로우바디 항공기는 여전히 필수적인 존재입니다. 나로우바디 항공기에 의한 LCC 시장 규모는 편당 연료 소비량을 줄여주는 A320neo와 B737 MAX의 인도에 힘입어 앞으로도 두 자릿수 성장률을 유지할 것으로 예측됩니다. 수주 잔고가 확보되어 있어 공급망에 부담이 가해지더라도 2031년까지의 기체 확충 계획은 보장되어 있습니다.
와이드바디 항공기의 운항은 여전히 틈새 시장이지만,항속 거리 4,700해리의 A321XLR이 로마-보스턴이나 쿠알라룸푸르-도쿄와 같은 장거리이자 수요가 적은 노선의 개척을 가능하게 함에 따라, 연평균 성장률(CAGR) 16.87%라는 견실한 속도로 확대되고 있습니다. 노스 애틀랜틱이나 에어아시아 X와 같은 항공사들은 높은 좌석 밀도와 불필요한 설비를 배제한 객실 구성 덕분에, 탑승률이 85%를 넘을 경우 200달러 미만의 대양 횡단 운임을 실현할 수 있음을 입증하고 있습니다. 성공의 열쇠는 높은 항공기 가동 일수와 좌석 밀도에 있습니다. 노스 애틀랜틱사의 338석 B787 레이아웃은 소유 비용을 더 많은 승객이 분담하도록 하고 있습니다. 이용률이 향상됨에 따라 2031년까지 LCC 시장에서 와이드바디 항공기의 점유율은 2배로 증가할 가능성이 있지만, 주요 장거리 공항의 슬롯 부족은 여전히 제약 요인으로 작용하고 있습니다.
2025년, 국내선은 LCC 시장에서 57.24%의 점유율을 유지했습니다. 이는 규제가 간소하고, 턴어라운드 시간이 짧으며, 입국 심사 절차가 없어 3시간 미만의 비행이라도 수익성을 확보할 수 있기 때문입니다. 미국에서는 사우스웨스트 항공, 프론티어 항공, 알레지언트 항공이 합쳐서 매일 수천 편의 항공편을 운항하고 있으며, 인도에서는 인디고 항공이 인도 국내 80개 도시에서 2,000편 이상의 국내선을 운항하고 있습니다. 국내선에서의 우위는 앞으로도 지속될 전망이지만, 성숙한 노선에서는 포화 상태가 진행되고 있어 연평균 성장률(CAGR)은 둔화되고 있습니다.
양자 협정에 따른 개혁으로 진입 장벽이 대폭 낮아짐에 따라, 국제 직항편은 연평균 성장률(CAGR) 18.01%로 성장하고 있습니다. EU와 아세안(ASEAN)의 협정 체결에 따라, 남아시아-중동 및 유럽-동남아시아와 같은 노선에서 국제 노선 LCC 시장 규모가 가장 빠르게 확대되고 있습니다. 에어 아라비아, 플라이 두바이, 위즈 에어는 네트워크형 항공사들이 오랫동안 간과해 온 지방 도시 간 노선을 추가하고 있습니다. 자유화 정책과 A321XLR의 항속 거리가 맞물려 LCC 시장의 이 부문은 확대될 전망이지만, 비자 및 환율 변동은 여전히 계획상의 과제로 남아 있습니다.
지역별 분석
2025년, 아시아태평양은 LCC 시장의 34.89%를 차지했습니다. 이는 인도 국내선의 두 자릿수 성장과 동남아시아의 오픈 스카이 개혁이 주도한 결과입니다. 그러나 엔진 공급 부족으로 인해 항공기 증편이 제한되고 있으며, 이로 인해 수요가 누적되어 운임이 높은 수준을 유지하고 있습니다. 중국의 스프링 항공, 세부퍼시픽 항공, 베트젯은 방콕이나 쿠알라룸푸르 등의 허브 공항을 경유하지 않는 지역 노선을 지속적으로 확대되고 있습니다.
중동 및 아프리카는 가장 빠르게 성장하고 있으며, 2031년의 연평균 성장률(CAGR)은 17.43%에 달할 전망입니다. 이는 사우디아라비아의 ‘비전 2030’에 따른 규제 완화가 신규 진출기업과 지방 공항의 확충을 촉진하고 있기 때문입니다. 플라이두바이의 150대 B737 MAX 발주는 아프리카와 남아시아 전역에서 서비스가 미치지 못하는 도시들을 연결하겠다는 이 회사의 야망을 여실히 보여주고 있습니다. 유럽에서는 시장 침투가 진행되면서 성장이 둔화되고 있지만, 경쟁은 여전히 치열합니다. 라이언에어, 이지젯, 위즈에어 등 3개사가 유럽 내 ASK의 40% 이상을 차지하고 있지만, 여전히 틈새 시장인 지방 도시 간 노선 개척을 추진하고 있습니다.
북미에서는 제트블루와의 합병이 저지된 데 이어, 2024년 11월 스피릿 항공이 연방 파산법 제11장 적용을 신청했습니다. 이로 인해 경쟁사들에게 귀중한 슬롯이 확보되었으며, 운임 경쟁을 유지하겠다는 규제 당국의 의지가 드러났습니다. 남미에서는 각 항공사가 환율 변동과 유류비 급등에 대응하는 가운데, 시장은 여전히 분산된 상태를 유지하고 있지만, 볼라리스와 비바 아에로바스는 미국으로의 국경 간 사업을 지속적으로 확대되고 있습니다. 전반적으로, 지역별 차이가 전 세계 저비용 항공사 시장의 위험-수익 프로파일에 영향을 미치고 있습니다.
기타 혜택
- 엑셀 형식 시장 예측(ME) 시트
- 3개월간의 애널리스트 지원
자주 묻는 질문
목차
제1장 서론
제2장 조사 방법
제3장 개요
제4장 시장 구도
제5장 시장 규모 및 성장 예측
제6장 경쟁 구도
제7장 시장 기회 및 향후 전망
AJY 26.09.01According to Mordor Intelligence, the low-cost carrier market size is expected to grow from USD 276.20 million in 2025 to USD 330.24 million in 2026 and is forecasted to reach USD 704.58 million by 2031 at a 16.36% CAGR over 2026-2031.
This report is Segmented by Aircraft Type (Narrowbody and Widebody), Destination (Domestic and International), Haul Length (Short-Haul, Medium-Haul, and Long-Haul), Distribution Channel (Online Direct and Travel Agency), and Geography (North America, Europe, Asia-Pacific, South America, and the Middle East and Africa). The Market Forecasts are Provided in Terms of Value (USD).
Global Low-Cost Carrier Market Trends and Insights
Sustained Growth in Price-Sensitive Leisure and VFR Travel Demand
Visiting friends and relatives account for 20-30% of international passengers and exhibit higher price elasticity than business travel, steering volumes toward fares that undercut legacy carriers by 30-50%. India's middle-class expansion has driven demand for one-way flights under USD 50, pushing IndiGo past 2,000 daily flights by the third quarter of FY2025. High-frequency immigrant corridors, such as the South Asia-Gulf, South America-US, and Eastern-Western Europe, buffer load factors during downturns because the trips are quasi-essential. Dynamic pricing now splits long weekends across multiple fare buckets, boosting yield without undermining occupancy. The rise of independent travel shifts bookings to direct channels where carriers capture every ancillary dollar. Mobile penetration exceeds 70% at leading low-cost carriers, enabling push offers that monetize seats, bags, meals, and insurance just moments before departure.
Single-Type Fleet Strategies Enabling Cost-Efficient Narrowbody Operations
Operating a single aircraft family simplifies training, parts inventory, and crew-rostering complexity, yielding durable cost advantages. Ryanair's all-B737 model and Southwest's B737 focus allow shared pilot pools and minimal standby staff. The A320neo family burns 15-20% less fuel than earlier variants, reducing direct operating expenses by 30-40%. IndiGo secured 500 A320neo-family deliveries in 2023, insulating itself from lease-rate increases as OEM backlogs extend beyond seven years. Uniform cabins reduce ground time; easyJet's standardized galleys and single-class seats enable sub-30-minute turns, supporting 11-13 hours of daily utilization.
Structural Aircraft and Engine Supply Chain Constraints Limiting Fleet Growth
Airbus planned to deliver up to 800 jets in 2025, yet faced CFM LEAP engine shortages and fuselage quality snags that slowed handovers. Boeing's B737 MAX line also lagged targets after manufacturing audits, forcing many low-cost carriers to extend leases on older aircraft. Lease rates for A321neo and B737 MAX variants rose more than 15% in 2024-2025, compressing returns when fuel savings fail to offset higher capital costs. With order backlogs stretching back more than 7 years, carriers cannot scale their fleets fast enough to capture demand spikes, thereby throttling market growth.
Other drivers and restraints analyzed in the detailed report include:
- Liberalization of Air-Service Agreements Expanding Point-to-Point Connectivity
- High Aircraft Utilization and Quick-Turnaround Operating Models
- Rising Environmental Compliance Costs on Short-Haul Aviation
For complete list of drivers and restraints, kindly check the Table Of Contents.
Segment Analysis
Narrowbody jets generated 82.01% of capacity in 2025, underscoring their status as the economic backbone of the low-cost carrier market. They remain crucial because runways, gate sizes, and passenger volumes across secondary airports are tailored to single-aisle operations. The low-cost carrier market size attributable to narrowbodies is projected to keep rising at double-digit rates, fueled by A320neo and B737 MAX deliveries that cut per-trip fuel burn. Order backlogs protect fleet expansion plans through 2031 even under supply chain stress.
Widebody operations, though still niche, are expanding at a robust 16.87% CAGR as the 4,700-nautical-mile A321XLR unlocks long-thin routes such as Rome to Boston and Kuala Lumpur to Tokyo. Airlines like Norse Atlantic and AirAsia X demonstrate that dense, no-frills cabins can deliver sub-USD 200 transoceanic fares when load factors exceed 85%. Success hinges on high aircraft days of use and seat density; Norse's 338-seat B787 layout spreads ownership costs across more travelers. As utilization improves, the widebody slice of the low-cost carrier market could double by 2031, although slot scarcity at major long-haul airports remains a limiting factor.
Domestic services retained a 57.24% share of the low-cost carrier market in 2025 because of regulatory simplicity, quick turnaround times, and the absence of immigration procedures, which make trips under three hours profitable. In the US, Southwest, Frontier, and Allegiant collectively schedule thousands of daily legs, while IndiGo operates more than 2,000 domestic flights across 80 Indian cities. Domestic dominance will persist, but its CAGR lags as saturation sets in mature corridors.
International point-to-point flights are growing at an 18.01% CAGR because bilateral reforms have slashed entry barriers. The low-cost carrier market size for international routes is rising fastest along corridors such as South Asia-Middle East and Europe-Southeast Asia, following the EU-ASEAN pact. Air Arabia, flydubai, and Wizz Air are adding secondary city pairs that network carriers have long overlooked. Liberal policies, combined with the A321XLR's range, will expand this slice of the low-cost carrier market, although visas and currency volatility remain planning challenges.
Complete Report Scope:
- By Aircraft Type
- Narrowbody
- Widebody
- By Destination
- Domestic
- International
- By Haul Length
- Short-Haul
- Medium-Haul
- Long-Haul
- By Distribution Channel
- Online Direct
- Travel Agency
- By Geography
- North America
- United States
- Canada
- Mexico
- Europe
- United Kingdom
- France
- Germany
- Italy
- Spain
- Rest of Europe
- Asia-Pacific
- China
- India
- Japan
- South Korea
- Rest of Asia-Pacific
- South America
- Brazil
- Rest of South America
- Middle East and Africa
- Middle East
- Saudi Arabia
- United Arab Emirates
- Rest of Middle East
- Africa
- South Africa
- Rest of Africa
- Middle East
- North America
Geography Analysis
Asia-Pacific held 34.89% of the low-cost carrier market in 2025, anchored by India's double-digit domestic growth and Southeast Asia's open-skies reforms. However, engine shortages limit aircraft additions, creating pent-up demand that supports fare strength. China's Spring Airlines, Cebu Pacific, and VietJet continue to expand their regional routes, which bypass hubs such as Bangkok and Kuala Lumpur.
The Middle East and Africa region is the fastest growing, with a 17.43% CAGR to 2031, as Vision 2030 deregulation spurs new entrants and secondary airport upgrades in Saudi Arabia. flydubai's 150-plane B737 MAX order underscores ambition to link underserved city pairs across Africa and South Asia. In Europe, mature penetration slows growth, but not competition; Ryanair, easyJet, and Wizz Air, together, control more than 40% of intra-European ASKs, yet still chase niche, secondary city pairs.
North America witnessed Spirit Airlines' November 2024 Chapter 11 filing, following its blocked merger with JetBlue, which opened up valuable slots for rivals and signaled a regulatory determination to preserve fare competition. South America remains fragmented as carriers navigate currency fluctuations and fuel cost spikes, although Volaris and Viva Aerobus continue to expand cross-border into the US. Overall, geographic divergence influences the risk-reward profiles within the global low-cost carrier market.
- Southwest Airlines Co.
- Ryanair
- AirAsia Group Berhad
- Indigo (InterGlobe Aviation Limited)
- easyJet PLC
- JetBlue Airways Corporation
- Spirit Airlines
- Norse Atlantic ASA
- Wizz Air Group
- Jetstar Airways Pty Ltd
- GOL Linhas Aereas
- Concesionaria Vuela Compania de Aviacion, S.A.P.I. de C.V. (Volaris)
- Frontier Group Holdings Inc.
- Pegasus Hava TasImacIlIgI A.S. (Pegasus)
- VietJet Aviation
- Cebu Pacific
- Dubai Aviation Corporation
- flynas Company LCC
- Jazeera Airways K.S.C
- WestJet Airlines Ltd. (Sunwing Vacations Inc.)
Additional Benefits:
- The market estimate (ME) sheet in Excel format
- 3 months of analyst support
TABLE OF CONTENTS
1 INTRODUCTION
- 1.1 Study Assumptions and Market Definition
- 1.2 Scope of the Study
2 RESEARCH METHODOLOGY
3 EXECUTIVE SUMMARY
4 MARKET LANDSCAPE
- 4.1 Market Overview
- 4.2 Market Drivers
- 4.2.1 Sustained growth in price sensitive leisure and VFR travel demand
- 4.2.2 Single-type fleet strategies enabling cost-efficient narrowbody operations
- 4.2.3 Liberalization of air service agreements expanding point-to-point connectivity
- 4.2.4 High aircraft utilization and quick turnaround operating models
- 4.2.5 Scalable ancillary revenue ecosystems improving per-seat profitability
- 4.2.6 Access to low-cost secondary airports supporting ultra-low operating expenses
- 4.3 Market Restraints
- 4.3.1 Structural aircraft and engine supply chain constraints limiting fleet growth
- 4.3.2 Rising environmental compliance costs on short-haul aviation
- 4.3.3 Jet fuel price volatility impacting operating margins
- 4.3.4 Global pilot and maintenance workforce shortages increasing unit costs
- 4.4 Value Chain Analysis
- 4.5 Regulatory Outlook
- 4.6 Technological Outlook
- 4.7 Porter's Five Forces Analysis
- 4.7.1 Bargaining Power of Buyers
- 4.7.2 Bargaining Power of Suppliers
- 4.7.3 Threat of New Entrants
- 4.7.4 Threat of Substitutes
- 4.7.5 Intensity of Competitive Rivalry
5 MARKET SIZE AND GROWTH FORECASTS (VALUE)
- 5.1 By Aircraft Type
- 5.1.1 Narrowbody
- 5.1.2 Widebody
- 5.2 By Destination
- 5.2.1 Domestic
- 5.2.2 International
- 5.3 By Haul Length
- 5.3.1 Short-Haul
- 5.3.2 Medium-Haul
- 5.3.3 Long-Haul
- 5.4 By Distribution Channel
- 5.4.1 Online Direct
- 5.4.2 Travel Agency
- 5.5 By Geography
- 5.5.1 North America
- 5.5.1.1 United States
- 5.5.1.2 Canada
- 5.5.1.3 Mexico
- 5.5.2 Europe
- 5.5.2.1 United Kingdom
- 5.5.2.2 France
- 5.5.2.3 Germany
- 5.5.2.4 Italy
- 5.5.2.5 Spain
- 5.5.2.6 Rest of Europe
- 5.5.3 Asia-Pacific
- 5.5.3.1 China
- 5.5.3.2 India
- 5.5.3.3 Japan
- 5.5.3.4 South Korea
- 5.5.3.5 Rest of Asia-Pacific
- 5.5.4 South America
- 5.5.4.1 Brazil
- 5.5.4.2 Rest of South America
- 5.5.5 Middle East and Africa
- 5.5.5.1 Middle East
- 5.5.5.1.1 Saudi Arabia
- 5.5.5.1.2 United Arab Emirates
- 5.5.5.1.3 Rest of Middle East
- 5.5.5.2 Africa
- 5.5.5.2.1 South Africa
- 5.5.5.2.2 Rest of Africa
- 5.5.5.1 Middle East
- 5.5.1 North America
6 COMPETITIVE LANDSCAPE
- 6.1 Market Concentration
- 6.2 Strategic Moves
- 6.3 Market Share Analysis
- 6.4 Company Profiles (includes Global level Overview, Market level overview, Core Segments, Financials as available, Strategic Information, Market Rank/Share for key companies, Products and Services, and Recent Developments)
- 6.4.1 Southwest Airlines Co.
- 6.4.2 Ryanair
- 6.4.3 AirAsia Group Berhad
- 6.4.4 Indigo (InterGlobe Aviation Limited)
- 6.4.5 easyJet PLC
- 6.4.6 JetBlue Airways Corporation
- 6.4.7 Spirit Airlines
- 6.4.8 Norse Atlantic ASA
- 6.4.9 Wizz Air Group
- 6.4.10 Jetstar Airways Pty Ltd
- 6.4.11 GOL Linhas Aereas
- 6.4.12 Concesionaria Vuela Compania de Aviacion, S.A.P.I. de C.V. (Volaris)
- 6.4.13 Frontier Group Holdings Inc.
- 6.4.14 Pegasus Hava TasImacIlIgI A.S. (Pegasus)
- 6.4.15 VietJet Aviation
- 6.4.16 Cebu Pacific
- 6.4.17 Dubai Aviation Corporation
- 6.4.18 flynas Company LCC
- 6.4.19 Jazeera Airways K.S.C
- 6.4.20 WestJet Airlines Ltd. (Sunwing Vacations Inc.)
7 MARKET OPPORTUNITIES AND FUTURE OUTLOOK
- 7.1 White-space and Unmet-Need Assessment