

|
시장보고서
상품코드
2117396
미국의 전기차 충전 서비스 : 시장 점유율 분석, 산업 동향 및 통계 데이터, 성장 예측(2026-2031년)United States EV Charging As A Service - Market Share Analysis, Industry Trends & Statistics, Growth Forecasts (2026 - 2031) |
||||||
 Mordor Intelligence
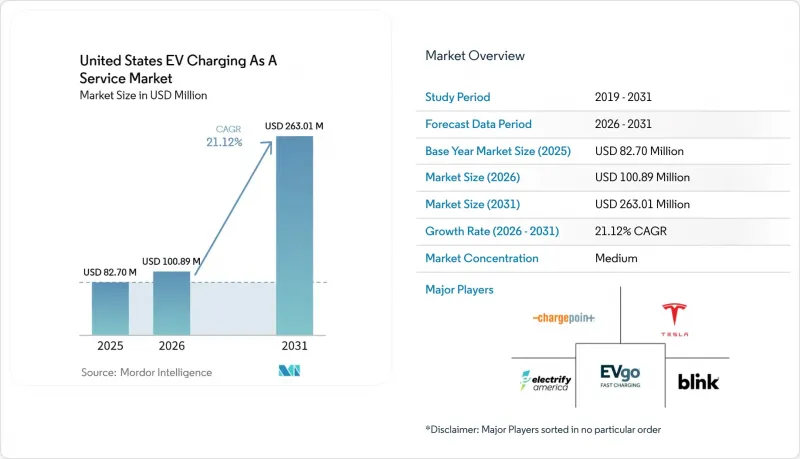
Mordor Intelligence에 의하면, 미국의 전기차 충전 서비스 시장 규모는 2025년에 8,270만 달러로 평가되었습니다. 2026년 1억 89만 달러에서 2031년까지 2억 6,301만 달러에 이를 것으로 예상되며, 예측 기간(2026-2031년)에 21.12%의 연평균 복합 성장률(CAGR)로 성장할 전망입니다.
본 보고서는 충전기 유형(AC 충전기, DC 급속 충전기), 출력(레벨 1/AC(22kW 미만), 레벨 2(22-50kW) 등), 차량 서비스 유형(사용차·차량 풀, 배송·물류 등), 최종 용도, 고객 비즈니스 모델 및 지역별로 분류되어 있습니다. 시장 전망은 금액(달러) 기준으로 제시되어 있습니다.
미국의 전기차 충전 서비스 시장 동향 및 인사이트
NEVI의 연방 및 주 정부 자금 지원 확대
NEVI 프로그램은 50억 달러를 배정하고 있으며, 보조금 대상인 각 사이트에 대해 150 kW 포트 4개 설치, 연중무휴 24시간 이용 가능, 그리고 97%의 가동률을 의무화하고 있습니다. 이로 인해 프로젝트 일정이 가속화되었으며, 원격 모니터링 기능이 미흡한 공급업체는 대상에서 제외되고 있습니다. 2026년 초까지 텍사스주는 수많은 회랑을 따라 위치한 거점에 막대한 자금을 배분했으며, 이미 가동 중인 거점이 몇 군데 있고 더 많은 거점이 개발 중입니다. 마찬가지로 오하이오주, 뉴욕주, 미시간주도 동등한 목표를 설정하고 있으며, 자금이 충분히 지원되지 않는 지역으로 자금을 유도하기 위해 보조금 지급을 형평성 지표와 연계하는 경우가 빈번하게 나타납니다.
기업의 ESG에 기반한 차량 전기화 의무
아마존, UPS, DB 쉔커는 2030년까지 라스트 마일 차량을 전기화하겠다고 약속했습니다. 이러한 움직임은 창고 충전 솔루션, 특히 하드웨어, 소프트웨어, 유지보수를 포괄하는 번들 서비스를 제공하는 솔루션에 대한 수요를 촉진하고 있습니다. 캘리포니아주에서는 WattEV의 트럭 허브가 클래스 8 트랙터를 단시간 내에 충전하는 데 성공하여, 지역 운송 분야에서 고출력 모델의 실용성을 입증하고 있습니다.
DC 급속 충전 거점의 높은 전력망 개조 비용
캘리포니아주에서는 계통 연계 신청 처리에 수년이 소요될 수 있으며, 변압기 업그레이드에는 막대한 재정적·물류적 과제가 수반됩니다. 이러한 요인으로 인해 예산 증액이나 용량이 더 큰 지역에 대한 투자가 중시되는 경향이 있습니다. 그러나 BP Pulse와의 제휴의 일환으로 개발된 FreeWire의 배터리 일체형 충전기는 피크 수요를 효율적으로 관리하고 대규모 인프라 업그레이드에 대한 의존도를 낮추는 솔루션을 제공함으로써 이러한 과제 중 일부를 해결하고 있습니다.
부문별 분석
미국의 전기차 충전 서비스 시장에서는 2025년 매출의 72.31%를 AC 레벨 2 충전기가 차지했습니다. 이들은 6시간의 주차 시간이 이용 패턴과 일치하는 직장이나 공동 주택의 차고를 거점으로 하고 있습니다. 한편, 물류 차량 및 장거리 이동자들의 30분 미만 충전 수요 증가에 따라 DC 급속 충전 시스템은 연평균 성장률(CAGR) 25.36%를 나타낼 것으로 예측됩니다. 테슬라가 2025년에 NACS 및 자사의 슈퍼차저 네트워크를 개방하기로 결정함에 따라, 차별화의 초점은 에너지 부하를 최적화하는 소프트웨어 계층의 서비스로 이동했습니다.
반공용 주차장의 경우, 하드웨어 경제성 측면에서 DC 급속 충전에 비해 여전히 비용 대비 효과가 높은 AC 충전이 주류를 이루고 있습니다. 그러나 FreeWire나 Voltera와 같은 기업이 제공하는 배터리 일체형 DC 솔루션 덕분에 전력망에 가해지는 부하가 점차 경감되고 있습니다. 이러한 혁신으로 인해 변압기 추가 비용 없이 새로운 설치 장소를 확보할 수 있게 되었습니다. 그 결과, 미국의 전기차 충전 서비스 시장에서는 ChargePoint와 같은 기존 기업들이 전략 전환을 모색하고 있습니다. ChargePoint사는 플릿 고객을 대상으로 첨단 ‘Omni Port’ 유닛을 발주하고 있습니다.
22-50 kW의 정격 출력을 가진 레벨 2 충전기는 설비 투자(CAPEX)가 낮고 전력망에 주는 부하가 적다는 장점 덕분에, 2025년 미국의 전기차 충전 서비스 시장 규모의 67.04%를 차지했습니다. 150kW를 초과하는 충전기는 연평균 성장률(CAGR) 29.45%로 성장할 전망입니다. 이는 배터리식 트럭이 디젤 차량과 동등한 정차 시간을 확보해야 하기 때문입니다. WattEV의 350kW 트럭용 충전소에서는 이미 90분 만에 충전 상태(SOC)의 80%까지 회복되고 있습니다.
50-150 kW의 중출력 시스템은 15-45분의 충전 시간이 허용되는 소형 상용차 차량군에 매력적입니다. 여러 거점에 걸쳐 있는 Rivian의 네트워크는 2025년에 높은 신뢰성을 기록하며, 브랜드 파워와 마찬가지로 신뢰성의 중요성을 부각시켰습니다. 배터리 화학 기술의 발전에 따라, 미국의 전기차 충전 서비스 시장은 초고출력 설비와 지능형 부하 분산을 조화시켜 거점의 처리 능력을 최적화할 준비가 차츰 갖춰지고 있습니다.
기타 혜택 :
- 엑셀 형식 시장 예측(ME) 시트
- 3개월간의 애널리스트 지원
자주 묻는 질문
목차
제1장 서론
제2장 분석 방법
제3장 개요
제4장 시장 구도
제5장 시장 규모 및 성장률 예측
제6장 경쟁 구도
제7장 시장 기회 및 향후 전망
KTH 26.09.02According to Mordor Intelligence, the United States EV charging as a service market size was valued at USD 82.70 million in 2025 and estimated to grow from USD 100.89 million in 2026 to reach USD 263.01 million by 2031, at a CAGR of 21.12% during the forecast period (2026-2031).
This report is Segmented by Charger Type (AC Chargers, DC Fast Chargers), Power Output (Level 1/AC (Less Than 22 KW), Level 2 (22-50 KW), and More), Fleet Service Type (Company Vehicles and Motor Pools, Delivery and Logistics, and More), End-Use, Customer Business Model, and Region. Market Forecasts are Provided in Terms of Value (USD).
United States EV Charging As A Service Market Trends and Insights
NEVI Federal-State Funding Roll-Out
The NEVI program allocates USD 5 billion and requires each funded site to offer four 150 kW ports, 24/7 access, and 97% uptime, accelerating project schedules and excluding vendors without remote-monitoring depth. By early 2026, Texas allocated significant funding across numerous corridor locations, with several active sites and many more under development. Similarly, Ohio, New York, and Michigan established comparable targets, frequently linking awards to equity metrics to direct funds into underserved neighborhoods.
Corporate ESG Fleet-Electrification Mandates
Amazon, UPS, and DB Schenker have committed to electrifying their last-mile fleets by 2030. This move is spurring a demand for depot-charging solutions, particularly those that offer bundled services encompassing hardware, software, and maintenance. In California, WattEV's truck hubs are successfully recharging Class 8 tractors within a short time frame, underscoring the viability of high-power models for regional hauling.
High Grid-Upgrade Costs for DC Fast Sites
In California, interconnection queues can take several years to process, and upgrading transformers involves significant financial and logistical challenges. These factors often lead to increased budgets and a focus on investments in areas with higher capacity. However, FreeWire's battery-integrated chargers, developed as part of a collaboration with BP Pulse, address some of these challenges by providing an efficient solution to manage peak demand and reduce dependency on extensive infrastructure upgrades.
Other drivers and restraints analyzed in the detailed report include:
- Declining Battery-Pack Costs Reach TCO Parity
- Utility Subscription-Ready Tariffs Cut Capex
- Interoperability and Payment-Standard Fragmentation
For complete list of drivers and restraints, kindly check the Table Of Contents.
Segment Analysis
AC Level 2 units supplied 72.31% of 2025 revenue in the United States EV Charging As A Service market, anchored in workplaces and multi-family garages where 6-hour dwell times align with usage patterns. DC fast systems, however, are projected for a 25.36% CAGR as logistics fleets and corridor travelers demand sub-30-minute stops. Tesla's 2025 decision to open NACS and its Supercharger network diverted differentiation toward software-layer services that optimize energy loads .
In semi-public lots, hardware economics continue to favor AC charging, which remains more cost-effective compared to DC fast charging. However, battery-integrated DC solutions from companies like FreeWire and Voltera are reducing grid footprints. This innovation allows for new deployment sites without the added expense of transformers. Consequently, the United States EV Charging As A Service market is seeing established players, such as ChargePoint, pivoting their strategies. ChargePoint has placed orders for advanced Omni Port units, targeting fleet customers.
Level 2 chargers rated 22-50 kW held 67.04% share of the United States EV Charging As A Service market size in 2025, driven by lower capex and grid friendliness. Chargers above 150 kW will post a 29.45% CAGR because battery-electric trucks must match diesel dwell times; WattEV's 350 kW truck stops already replenish 80% SOC in 90 minutes.
Mid-range 50-150 kW systems appeal to light-commercial fleets where 15-45-minute sessions are acceptable. Rivian's network, spanning multiple sites, recorded high reliability in 2025, underscoring the importance of reliability alongside brand strength. With the evolution of battery chemistries, the United States EV Charging As A Service market is poised to harmonize ultra-high power installations with intelligent load sharing, optimizing site throughput.
Complete Report Scope:
- By Charger Type
- AC Chargers (Level 2 Service)
- DC Fast Chargers
- By Power Output
- Level 1/AC (Less than 22 kW)
- Level 2 (22 to 50 kW)
- Fast (50 to 150 kW)
- High-Power (More than 150 kW)
- By Fleet Service Type
- Company Vehicles and Motor Pools
- Delivery and Logistics
- Passenger Transportation Fleets
- By End-Use
- Semi-Public Charging Setup
- Public Charging Setup
- By Customer Business Model
- Subscription-based (CaaS)
- Pay-per-Use
- Hybrid Models
- By Region
- Northeast
- Midwest
- South
- West
List of Companies Covered in this Report:
- ChargePoint, Inc.
- Tesla, Inc.
- Electrify America
- EVgo Inc.
- Blink Charging Co.
- Shell Recharge
- BP Pulse
- FLO Services USA Inc.
- EV Connect
- Rivian Adventure Network
- IONNA
- Francis Energy
- Voltera
- Tritium Charging
- Enel Group
Additional Benefits:
- The market estimate (ME) sheet in Excel format
- 3 months of analyst support
TABLE OF CONTENTS
1 Introduction
- 1.1 Study Assumptions and Market Definition
- 1.2 Scope of the Study
2 Research Methodology
3 Executive Summary
4 Market Landscape
- 4.1 Market Overview
- 4.2 Market Drivers
- 4.2.1 NEVI Federal-State Funding Roll-Out
- 4.2.2 Corporate ESG Fleet-Electrification Mandates
- 4.2.3 Declining Battery-Pack Costs Reach TCO Parity
- 4.2.4 Utility Subscription-Ready Tariffs Cut Capex
- 4.2.5 AI-Driven Predictive Maintenance Boosts Uptime
- 4.2.6 Emerging Idle-Fee Revenue-Sharing Models
- 4.3 Market Restraints
- 4.3.1 High Grid-Upgrade Costs for DC Fast Sites
- 4.3.2 Interoperability and Payment-Standard Fragmentation
- 4.3.3 Soaring Demand Charges in Key Utility Territories
- 4.3.4 Reliability-Penalty Clauses in NEVI Contracts
- 4.4 Value/Supply-Chain Analysis
- 4.5 Regulatory Landscape (Federal and Leading States)
- 4.6 Technological Outlook (V2G, NACS, Plug-and-Charge)
- 4.7 Porter's Five Forces
- 4.7.1 Threat of New Entrants
- 4.7.2 Bargaining Power of Suppliers
- 4.7.3 Bargaining Power of Buyers
- 4.7.4 Threat of Substitutes
- 4.7.5 Competitive Rivalry
5 Market Size and Growth Forecasts (Value, USD)
- 5.1 By Charger Type
- 5.1.1 AC Chargers (Level 2 Service)
- 5.1.2 DC Fast Chargers
- 5.2 By Power Output
- 5.2.1 Level 1/AC (Less than 22 kW)
- 5.2.2 Level 2 (22 to 50 kW)
- 5.2.3 Fast (50 to 150 kW)
- 5.2.4 High-Power (More than 150 kW)
- 5.3 By Fleet Service Type
- 5.3.1 Company Vehicles and Motor Pools
- 5.3.2 Delivery and Logistics
- 5.3.3 Passenger Transportation Fleets
- 5.4 By End-Use
- 5.4.1 Semi-Public Charging Setup
- 5.4.2 Public Charging Setup
- 5.5 By Customer Business Model
- 5.5.1 Subscription-based (CaaS)
- 5.5.2 Pay-per-Use
- 5.5.3 Hybrid Models
- 5.6 By Region
- 5.6.1 Northeast
- 5.6.2 Midwest
- 5.6.3 South
- 5.6.4 West
6 Competitive Landscape
- 6.1 Market Concentration
- 6.2 Strategic Moves
- 6.3 Market Share Analysis
- 6.4 Company Profiles (Includes Global Level Overview, Market Level Overview, Core Segments, Financials as Available, Strategic Information, Market Rank/Share for Key Companies, Products and Services, SWOT Analysis, and Recent Developments)
- 6.4.1 ChargePoint, Inc.
- 6.4.2 Tesla, Inc.
- 6.4.3 Electrify America
- 6.4.4 EVgo Inc.
- 6.4.5 Blink Charging Co.
- 6.4.6 Shell Recharge
- 6.4.7 BP Pulse
- 6.4.8 FLO Services USA Inc.
- 6.4.9 EV Connect
- 6.4.10 Rivian Adventure Network
- 6.4.11 IONNA
- 6.4.12 Francis Energy
- 6.4.13 Voltera
- 6.4.14 Tritium Charging
- 6.4.15 Enel Group
7 Market Opportunities and Future Outlook
- 7.1 White-space and Unmet-Need Assessment


