

|
시장보고서
상품코드
2117468
전기 밴 시장 : 점유율 분석, 업계 동향과 통계, 성장 예측(2025-2030년)Electric Van - Market Share Analysis, Industry Trends & Statistics, Growth Forecasts (2025 - 2030) |
||||||
 Mordor Intelligence
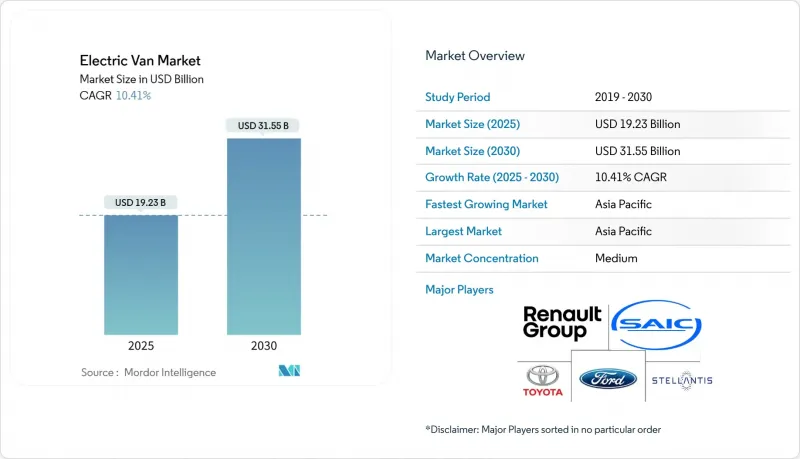
Mordor Intelligence에 의하면, 전기 밴 시장 규모는 2025년에 192억 3,000만 달러가 되고, 2030년까지 315억 5,000만 달러에 이를 것으로 예측되며, 예측 기간 중은 CAGR 10.41%로 확대하는 전망입니다.
본 보고서는 차종별(화물 밴, 승용 밴, 미니밴, 패널 밴), 적재량별(2톤 이하, 2-3톤, 3-5.5톤), 구동 방식별(하이브리드 전기차, 플러그인 하이브리드 전기차, 배터리 전기차), 용도별(상업용, 개인용),및 지역(북미, 남미, 아시아태평양, 기타)별로 분류되어 있습니다. 시장 전망은 금액(미 달러) 및 수량(대수)으로 제시되어 있습니다.
전 세계 전기 밴 시장 동향 및 인사이트
도시 내 배송 차량에 대한 정부의 ZEV 규제
규제 체계는 배출량 감축의 다음 단계로 상용차를 점점 더 대상으로 삼고 있으며, 도시 지역 배송 차량에는 기존의 차량 교체 주기를 단축하는 의무적인 전동화 일정이 부과되고 있습니다. 영국의 제로 배출 차량(ZEV) 규제는 2030년까지 판매되는 신형 밴의 70%를 제로 배출 차량으로할 것을 의무화하고 있으며, 한편,캘리포니아주의 ‘첨단 청정 차량(ACF)’ 규제는 2024년까지 대규모 차량 보유 사업자에게 구매 차량의 100%를 제로 배출 차량으로할 것을 의무화하고 있습니다. 이러한 규제로 인해 자연스러운 차량 교체율을 상회하는 인위적인 수요 급증이 발생하여, 자본 투자의 가속화가 불가피한 상황입니다. 차량 운영 사업자들은 규제 준수 비용을 경감하기 위해 리스 기간 연장 협상이나 잔존 가치 보장을 요구함으로써 대응하고 있습니다. 지자체 계약에 무공해 요건이 점점 더 명시됨에 따라 규제의 연쇄 효과가 나타나, 직접적인 규제를 넘어 2차적인 수요 압력이 발생하고 있습니다.
세컨드 라이프 배터리 리스 모델을 통한 TCO 절감
배터리 리스 계약은 가장 비용이 많이 드는 구성 요소를 차량 소유에서 분리함으로써, 차량 함대 도입의 경제성을 근본적으로 변화시키고, 소규모 사업자도 전기 밴 기술을 이용할 수 있게 합니다. 성능이 저하된 EV 배터리를 고정형 에너지 저장 시스템으로 재활용하는 ‘세컨드 라이프’를 활용함으로써 잔존 가치라는 수입원이 창출되며, 차량의 전체 수명 주기 동안 실질적인 배터리 비용을 20-30% 절감합니다. 플릿 사업자는 예측 가능한 월간 배터리 비용의 혜택을 누리는 동시에, 배터리 화학 기술의 발전에 따른 기술 노후화 위험을 피할 수 있습니다. 이 모델은 일일 주행 거리 패턴을 통해 배터리 성능 저하를 정확하게 예측할 수 있는 도시 지역 내 배송 용도에서 특히 매력적입니다. 이러한 접근 방식을 통해 막대한 설비 투자가 필요 없이 차량 함대를 전기화할 수 있게 되어, 그동안 전기 밴을 경제적으로 감당할 수 없습니다고 생각했던 비용 중심의 사업자들이 도입을 가속화하고 있습니다.
클래스 II 및 III 밴용 공공 급속 충전 인프라 부족
공공 충전 인프라 구축에서는 상용차보다 승용차가 우선시되고 있어, 거점 간 이동 경로 이외의 구간에서 운행하는 전기 밴에게는 운영상의 제약이 되고 있습니다. 클래스 II 및 III 밴은 승용차보다 높은 충전 출력과 긴 충전 시간이 필요하지만, 대부분의 공공 충전소에는 상용차의 효율적인 충전에 필요한 150kW 이상의 용량이 갖추어져 있지 않습니다. 이러한 인프라 격차는 거점에서의 충전이 현실적이지 않은 도시 간 배송 노선에서 특히 심각한 문제로 대두되고 있습니다. 차량 운영 사업자들은 충전 인프라 구축 현황이 차량 구매 비용이나 주행 거리 제한보다 더 큰 문제이며, 전기 밴 도입에 있어 가장 큰 제약 요인이라고 보고하고 있습니다. 인프라 투자 일정과 차량 전동화 의무화 시기가 맞지 않는 것은 도입 결정을 지연시키는 운영상의 위험을 초래하고 있습니다.
부문 분석
패널 밴은 연평균 성장률(CAGR) 16.31%(2025-2030년)로 가장 빠른 성장세를 보이고 있으며, 2024년에 41.06%라는 최대 시장 점유율을 유지하고 있는 기존 카고 밴 부문을 앞지르고 있습니다. 이러한 성장률의 차이는 이동식 작업장, 냉장 유닛, 맞춤형 내장 구성이 필요한 라스트 마일 배송 용도 등 특수 개조에 대한 패널 밴의 뛰어난 적응성을 반영합니다. 카고밴은 확립된 물류 파트너십과 표준화된 차량 조달 프로세스를 통해 우위를 유지하고 있는 반면, 승합밴은 도시 지역의 셔틀 서비스와 같은 틈새 용도로 활용되고 있습니다. 미니밴은 규모가 가장 작은 부문이지만, 도시 지역 가족들이 일상적인 이동 수단으로 무공해 모빌리티를 도입함에 따라 개인 이용의 확대로 인한 혜택을 누리고 있습니다.
이 부문의 동향을 통해 획일적인 접근 방식이 아닌, 용도에 특화된 차량 설계로의 전략적 전환을 엿볼 수 있습니다. 2026년에 도입될 메르세데스-벤츠의 ‘VAN.EA’ 아키텍처는 장시간 정차가 필요한 패널 밴 용도를 위해 특별히 설계된 800V 전기 시스템과 22kW AC 충전 기능을 탑재하고 있습니다. 이러한 기술적 차별화를 통해 제조업체는 특수 용도를 위해 프리미엄 가격을 책정하는 한편, 대량 생산되는 화물 밴 부문에서는 비용 경쟁력을 갖춘 제품을 지속적으로 제공할 수 있게 됩니다. 모듈식 플랫폼으로의 전환 추세에 따라 단일 생산 라인에서 여러 차종을 생산할 수 있게 되어 제조의 복잡성을 줄이는 동시에, 새로운 용도에 대한 신속한 시장 대응이 가능해집니다.
2024년에는 배터리식 전기차가 시장 점유율의 86.61%를 차지하며, 플릿 사업자가 충전 인프라의 제약을 피하기 위해 플러그인 하이브리드 차량의 성장률이 연평균 성장률(CAGR) 23.12%로 가장 빠른 속도를 보이고 있습니다. 이러한 성장 양상은 순수한 제로 에미션 주행보다 업무 연속성을 우선시하는 현실적인 차량 관리 전략을 반영하고 있습니다. 배터리 비용의 하락과 충전 인프라 확충에 따라 하이브리드 전기 시스템의 역할은 점차 축소되고 있지만, 플러그인 하이브리드 구성은 도시 간 배송 노선에서 주행 거리의 확실성을 제공합니다.
구동 방식별 분석에 따르면 도입 양상에 지역적 차이가 나타나며, 도시 시장에서는 배터리식 전기차가 주류를 이루는 반면, 지방에서는 하이브리드 차량이 선호되고 있습니다. 차량 운영 사업자들은 도시 지역 배송과 장거리 주행 요건이 결합된 혼합 주행 사이클에서 플러그인 하이브리드 시스템을 점점 더 많이 지정하고 있습니다. 이를 통해 차종을 구분하여 관리하는 대신 단일 차량으로 대응할 수 있게 됩니다. 이러한 운영상의 유연성은 전문적인 차량 배정을 정당화할 만한 규모를 갖추지 못한 소규모 차량 운영 사업자에게 특히 가치 있는 요소로 작용하고 있습니다. 이 부문의 추이를 살펴보면, 충전 인프라가 정비되고 배터리의 에너지 밀도가 향상됨에 따라 하이브리드 기술은 일시적인 역할에 그칠 것으로 시사되고 있습니다.
지역별 분석
아시아태평양은 2024년 45.72%의 시장 점유율로 1위를 차지했으며, 중국의 제조 경쟁력과 신흥 시장을 겨냥한 적극적인 수출 전략에 힘입어 연평균 성장률(CAGR) 14.32%(2025-2030년)라는 지역 내 가장 빠른 성장률을 보이고 있습니다. BYD나 SAIC 등 중국 제조업체들은 국내에서의 규모 우위를 활용하여 유럽 경쟁사들보다 2-3배 저렴한 가격의 전기 밴을 제공하고 있으며, 이러한 경쟁 압력이 전 세계적인 보급을 가속화하고 있습니다. 인도는 주요 성장 시장으로 부상하고 있으며, 타타 모터스는 전기 상용차 시장에서 큰 점유율을 차지하고 있습니다. 이 회사는 2024 회계연도에 5,590대를 판매했을 뿐만 아니라, 타타 파워사와의 제휴를 통해 200곳 이상의 급속 충전소를 구축하며 충전 인프라 확충을 추진하고 있습니다. 태국은 연간 40만-50만 대의 전기차 생산 능력을 갖춘 지역 생산 거점으로서의 입지를 확고히 하고 있으며, 국내 수요는 물론 동남아시아 전역의 수출 시장에도 대응하고 있습니다. 이 지역의 성장 궤적은 전기차 제조에 대한 정부의 지원과, 무공해 배송 솔루션을 뒷받침하는 급속히 확장되는 도시 물류 네트워크를 반영하고 있습니다.
유럽은 중국산 수입차로 인한 경쟁 압력에 직면해 있음에도 불구하고 여전히 큰 시장 점유율을 유지하고 있습니다. 이는 EU의 차량군 평균 CO₂ 배출량 규제 등 규제 체계로 인해 전기 상용차에 대한 지속적인 수요가 발생하고 있기 때문입니다. 이 지역은 확립된 자동차 제조 능력과 예측 가능한 차량 교체 주기를 만들어내는 제로 에미션 규제의 조기 도입이라는 이점을 누리고 있습니다. 유럽 제조업체들은 기술적 차별화를 통해 이에 대응하고 있으며, 메르세데스-벤츠의 ‘VAN.EA’ 아키텍처와 스텔란티스 및 이베코 간의 10년간 공급 계약은 프리미엄 기능과 통합된 서비스 제공에 중점을 두고 있음을 보여줍니다. 파리존(Farizon)과 같은 중국 브랜드가 유럽에서 사업을 전개하며, 기존 설계 방식에 도전하는 드라이브-바이-와이어 기술과 모듈형 플랫폼을 제공함에 따라 경쟁 구도는 격화되고 있습니다.
북미에서는 연방 정부의 인센티브와 주 차원의 제로 배출 규제의 뒷받침을 받아 꾸준한 성장이 나타나고 있습니다. 특히 캘리포니아주의 ‘Advanced Clean Fleets’ 규정에 따라 대규모 차량 운영 사업자에 대한 도입 의무화 일정이 설정되어 있습니다. 이 지역에서는 제너럴 모터스(GM)가 쉐보레 딜러 네트워크에 ‘BrightDrop’을 통합한 것과, 포드가 ‘E-Transit’의 주행 거리를 개선하여 하이루프 사양에서 최대 32%의 주행 거리 향상을 실현한 것 등, 국내 생산 능력이 활용되고 있습니다. 시장 개발은 공공 충전 네트워크보다 거점 기반 충전 인프라 및 차량 대여 서비스의 통합에 중점을 두고 있으며, 이는 상용차 우선 도입 패턴을 반영하고 있습니다. 남미, 중동 및 아프리카는 현재 시장에서의 입지가 제한적이지만, 도시 지역 배송 용도나 정부의 차량 현대화 프로그램에서 전기 상용차에 대한 관심이 높아지고 있어 새로운 기회를 내포하고 있습니다.
기타 혜택:
- 엑셀 형식 시장 예측(ME) 시트
- 3개월간의 애널리스트 지원
자주 묻는 질문
목차
제1장 서론
제2장 조사 방법
제3장 개요
제4장 시장 구도
제5장 시장 규모와 성장 예측
제6장 경쟁 구도
제7장 시장 기회와 향후 전망
JHS 26.09.01According to Mordor Intelligence, the electric van market size stood at USD 19.23 billion in 2025 and is projected to climb to USD 31.55 billion by 2030, advancing at a 10.41% CAGR over the forecast period.
This report is Segmented by Vehicle Type (Cargo Van, Passenger Van, Minivan, Panel Van), Tonnage Capacity (Up To 2 Tons, 2 To 3 Tons, 3 To 5. 5 Tons), Propulsion Type (Hybrid Electric, Plug-In Hybrid Electric, Battery Electric), End-Use (Commercial, Personal), and Geography (North America, South America, Asia-Pacific, and More). The Market Forecasts are Provided in Terms of Value (USD) and Volume (Units).
Global Electric Van Market Trends and Insights
Government ZEV Mandates on Urban Delivery Fleets
Regulatory frameworks increasingly target commercial vehicles as the next frontier for emission reductions, with urban delivery fleets facing mandatory electrification timelines that compress traditional fleet replacement cycles. The UK's Zero Emission Vehicle mandate requires 70% of new vans sold to be zero-emission by 2030, while California's Advanced Clean Fleets regulation mandates 100% zero-emission purchases for large fleets by 2024. These mandates create artificial demand spikes that exceed natural fleet turnover rates, forcing accelerated capital deployment. Fleet operators respond by negotiating extended lease terms and seeking guaranteed residual values to mitigate regulatory compliance costs. The regulatory cascade effect emerges as municipal contracts increasingly specify zero-emission requirements, creating secondary demand pressure beyond direct mandates.
Falling TCO from Second-Life Battery Leasing Models
Battery leasing arrangements decouple the highest-cost component from vehicle ownership, fundamentally altering fleet acquisition economics and enabling smaller operators to access electric van technology. Second-life applications for degraded EV batteries in stationary energy storage create residual value streams that reduce effective battery costs by 20-30% over the vehicle lifecycle. Fleet operators benefit from predictable monthly battery costs while avoiding technology obsolescence risks as battery chemistry advances. This model proves particularly attractive for urban delivery applications where daily mileage patterns allow precise battery degradation modeling. The approach enables fleet electrification without large capital commitments, accelerating adoption among cost-sensitive operators who previously viewed electric vans as financially prohibitive.
Limited Public Fast-Charging Layout for Class-II and III Vans
Public charging infrastructure development prioritizes passenger vehicles over commercial applications, creating operational constraints for electric vans that operate beyond depot-based routes. Class-II and III vans require higher power charging rates and longer dwell times than passenger vehicles, yet most public charging stations lack the 150kW+ capacity needed for efficient commercial vehicle charging. The infrastructure gap proves particularly problematic for inter-city delivery routes where depot charging becomes impractical. Fleet operators report that charging infrastructure availability ranks as the primary constraint on electric van deployment, ahead of vehicle purchase costs or range limitations. The mismatch between infrastructure investment timelines and fleet electrification mandates creates operational risks that delay adoption decisions.
Other drivers and restraints analyzed in the detailed report include:
- E-commerce Same-Day Delivery Pushing Depot Rapid-Charge Infrastructure
- EU CO2 Fleet-Average Tightening for Light Commercial Vehicles Post-2025
- Payload Penalty Due to Battery Mass in 3 to 5.5 Ton Segment
For complete list of drivers and restraints, kindly check the Table Of Contents.
Segment Analysis
Panel vans demonstrate the fastest growth at 16.31% CAGR (2025-2030), outpacing the established cargo van segment that maintains the largest market share at 41.06% in 2024. This growth differential reflects panel vans' superior adaptability for specialized conversions, including mobile workshops, refrigerated units, and last-mile delivery applications that require customized interior configurations. Cargo vans retain dominance through established logistics partnerships and standardized fleet procurement processes, while passenger vans serve niche applications in urban shuttle services. Minivans occupy the smallest segment but benefit from personal-use adoption as urban families embrace zero-emission mobility for daily transportation needs.
The segment dynamics reveal a strategic shift toward application-specific vehicle design rather than one-size-fits-all approaches. Mercedes-Benz's VAN.EA architecture, launching in 2026, incorporates 800V electrical systems and 22kW AC charging specifically designed for panel van applications requiring extended stationary periods. This technological differentiation enables manufacturers to command premium pricing for specialized applications while maintaining cost-competitive offerings in high-volume cargo van segments. The trend toward modular platforms allows single production lines to serve multiple vehicle types, reducing manufacturing complexity while enabling rapid market response to emerging applications.
Battery electric vehicles command 86.61% market share in 2024, yet plug-in hybrid electric variants exhibit the fastest growth at 23.12% CAGR as fleet operators hedge against charging infrastructure limitations. This growth pattern reflects pragmatic fleet management strategies that prioritize operational continuity over pure zero-emission operation. Hybrid electric systems occupy a diminishing role as battery costs decline and charging infrastructure expands, while plug-in hybrid configurations provide range assurance for inter-city delivery routes.
The propulsion type segmentation reveals geographic variations in adoption patterns, with battery electric dominance in urban markets contrasting with hybrid preference in rural applications. Fleet operators increasingly specify plug-in hybrid systems for mixed-duty cycles that combine urban delivery with longer-range requirements, enabling single-fleet solutions rather than maintaining separate vehicle types. This operational flexibility proves particularly valuable for smaller fleet operators who lack the scale to justify specialized vehicle assignments. The segment evolution suggests a temporary role for hybrid technologies as charging infrastructure matures and battery energy density improves.
Complete Report Scope:
- By Vehicle Type
- Cargo Van
- Passenger Van
- Minivan
- Panel Van
- By Tonnage Capacity
- Up to 2 Tons
- 2 to 3 Tons
- 3 to 5.5 Tons
- By Propulsion Type
- Hybrid Electric
- Plug-in Hybrid Electric
- Battery Electric
- By End-Use
- Commercial
- Personal
- By Region
- North America
- United States
- Canada
- Rest of North America
- South America
- Brazil
- Argentina
- Rest of South America
- Europe
- United Kingdom
- Germany
- Spain
- Italy
- France
- Russia
- Rest of Europe
- Asia-Pacific
- India
- China
- Japan
- South Korea
- Rest of Asia-Pacific
- Middle East and Africa
- United Arab Emirates
- Saudi Arabia
- Turkey
- Egypt
- South Africa
- Rest of Middle East and Africa
- North America
Geography Analysis
Asia-Pacific leads with 45.72% market share in 2024 and the fastest regional growth at 14.32% CAGR (2025-2030), driven by China's manufacturing dominance and aggressive export strategies targeting emerging markets. Chinese manufacturers like BYD and SAIC leverage domestic scale to offer electric vans priced 2-3 times lower than European competitors, creating competitive pressure that accelerates global adoption. India emerges as a key growth market with Tata Motors commanding a significant market share in electric commercial vehicles, selling 5,590 units in FY2024 while expanding charging infrastructure through partnerships with Tata Power's 200+ fast charging stations. Thailand positions itself as a regional production hub with 400,000-500,000 EVs annual capacity, serving both domestic demand and export markets across Southeast Asia. The regional growth trajectory reflects government support for electric vehicle manufacturing and rapidly expanding urban logistics networks that favor zero-emission delivery solutions.
Europe maintains significant market presence despite facing competitive pressure from Chinese imports, with regulatory frameworks like the EU's CO2 fleet-average requirements creating sustained demand for electric commercial vehicles. The region benefits from established automotive manufacturing capabilities and early adoption of zero-emission mandates that create predictable fleet replacement cycles. European manufacturers respond through technological differentiation, with Mercedes-Benz's VAN.EA architecture and Stellantis' 10-year supply agreement with Iveco demonstrate a focus on premium features and integrated service offerings. The competitive landscape intensifies as Chinese brands like Farizon establish European operations, offering drive-by-wire technology and modular platforms that challenge traditional design approaches.
North America experiences steady growth driven by federal incentives and state-level zero-emission mandates, with California's Advanced Clean Fleets regulation creating mandatory adoption timelines for large fleet operators. The region benefits from domestic manufacturing capabilities through General Motors' BrightDrop integration into Chevrolet's dealer network and Ford's E-Transit range improvements that deliver up to 32% additional range for high-roof configurations. Market development focuses on depot-based charging infrastructure and fleet service integration rather than public charging networks, reflecting the commercial-first adoption pattern. South America, the Middle East, and Africa represent emerging opportunities with limited current market presence but growing interest in electric commercial vehicles for urban delivery applications and government fleet modernization programs.
- Renault Group
- Stellantis N.V.
- Mercedes-Benz Group AG
- Ford Motor Company
- SAIC Motor Corp. Ltd.
- Nissan Motor Co., Ltd.
- Volkswagen AG
- Hyundai Motor (Kia Corp.)
- BYD Company Ltd.
- General Motors Company
- Rivian Automotive, Inc.
- Arrival Ltd.
- Maxus (SAIC)
- StreetScooter GmbH
- Tata Motors Ltd.
- Mahindra and Mahindra Ltd.
- Mitsubishi Fuso Truck and Bus Corp.
- Geely Automobile Holdings
- Changan Automobile
- Workhorse Group Inc.
- Bollinger Motors
- Canoo Inc.
- Lightning eMotors
- ElectricBrands AG
- Volta Trucks AB
Additional Benefits:
- The market estimate (ME) sheet in Excel format
- 3 months of analyst support
TABLE OF CONTENTS
1 Introduction
- 1.1 Study Assumptions and Market Definition
- 1.2 Scope of the Study
2 Research Methodology
3 Executive Summary
4 Market Landscape
- 4.1 Market Overview
- 4.2 Market Drivers
- 4.2.1 Government ZEV Mandates on Urban Delivery Fleets
- 4.2.2 Falling TCO from Second-Life Battery Leasing Models
- 4.2.3 E-Commerce Same-Day Delivery Pushing Depot Rapid-Charge Infrastructure
- 4.2.4 EU CO2 Fleet-Average Tightening for Light Commercial Vehicles Post-2025
- 4.2.5 Chinese Export Surge of Low-Cost Electric Vans to Emerging Markets
- 4.2.6 Development of Modular Skateboard Platforms Enabling Multi-Tonnage Variants
- 4.3 Market Restraints
- 4.3.1 Limited Public Fast-Charging Layout for Class-II and III Vans
- 4.3.2 Payload Penalty Due to Battery Mass in 3 to 5.5 Tons Segment
- 4.3.3 Upstream Battery-Grade Graphite Supply Bottlenecks After 2027
- 4.3.4 Residual Value Uncertainty Depressing Fleet Leasing Uptake
- 4.4 Value/Supply-Chain Analysis
- 4.5 Regulatory Landscape
- 4.6 Technological Outlook
- 4.7 Porter's Five Forces
- 4.7.1 Threat of New Entrants
- 4.7.2 Bargaining Power of Suppliers
- 4.7.3 Bargaining Power of Buyers
- 4.7.4 Threat of Substitutes
- 4.7.5 Competitive Rivalry
- 4.8 Investment and Funding Trends
5 Market Size and Growth Forecasts (Value (USD) and Volume (Units))
- 5.1 By Vehicle Type
- 5.1.1 Cargo Van
- 5.1.2 Passenger Van
- 5.1.3 Minivan
- 5.1.4 Panel Van
- 5.2 By Tonnage Capacity
- 5.2.1 Up to 2 Tons
- 5.2.2 2 to 3 Tons
- 5.2.3 3 to 5.5 Tons
- 5.3 By Propulsion Type
- 5.3.1 Hybrid Electric
- 5.3.2 Plug-in Hybrid Electric
- 5.3.3 Battery Electric
- 5.4 By End-Use
- 5.4.1 Commercial
- 5.4.2 Personal
- 5.5 By Region
- 5.5.1 North America
- 5.5.1.1 United States
- 5.5.1.2 Canada
- 5.5.1.3 Rest of North America
- 5.5.2 South America
- 5.5.2.1 Brazil
- 5.5.2.2 Argentina
- 5.5.2.3 Rest of South America
- 5.5.3 Europe
- 5.5.3.1 United Kingdom
- 5.5.3.2 Germany
- 5.5.3.3 Spain
- 5.5.3.4 Italy
- 5.5.3.5 France
- 5.5.3.6 Russia
- 5.5.3.7 Rest of Europe
- 5.5.4 Asia-Pacific
- 5.5.4.1 India
- 5.5.4.2 China
- 5.5.4.3 Japan
- 5.5.4.4 South Korea
- 5.5.4.5 Rest of Asia-Pacific
- 5.5.5 Middle East and Africa
- 5.5.5.1 United Arab Emirates
- 5.5.5.2 Saudi Arabia
- 5.5.5.3 Turkey
- 5.5.5.4 Egypt
- 5.5.5.5 South Africa
- 5.5.5.6 Rest of Middle East and Africa
- 5.5.1 North America
6 Competitive Landscape
- 6.1 Market Concentration
- 6.2 Strategic Moves
- 6.3 Market Share Analysis
- 6.4 Company Profiles (Includes Global level Overview, Market level overview, Core Segments, Financials as available, Strategic Information, Market Rank/Share for key companies, Products and Services, and Recent Developments)
- 6.4.1 Renault Group
- 6.4.2 Stellantis N.V.
- 6.4.3 Mercedes-Benz Group AG
- 6.4.4 Ford Motor Company
- 6.4.5 SAIC Motor Corp. Ltd.
- 6.4.6 Nissan Motor Co., Ltd.
- 6.4.7 Volkswagen AG
- 6.4.8 Hyundai Motor (Kia Corp.)
- 6.4.9 BYD Company Ltd.
- 6.4.10 General Motors Company
- 6.4.11 Rivian Automotive, Inc.
- 6.4.12 Arrival Ltd.
- 6.4.13 Maxus (SAIC)
- 6.4.14 StreetScooter GmbH
- 6.4.15 Tata Motors Ltd.
- 6.4.16 Mahindra and Mahindra Ltd.
- 6.4.17 Mitsubishi Fuso Truck and Bus Corp.
- 6.4.18 Geely Automobile Holdings
- 6.4.19 Changan Automobile
- 6.4.20 Workhorse Group Inc.
- 6.4.21 Bollinger Motors
- 6.4.22 Canoo Inc.
- 6.4.23 Lightning eMotors
- 6.4.24 ElectricBrands AG
- 6.4.25 Volta Trucks AB
7 Market Opportunities and Future Outlook
- 7.1 White-space and Unmet-Need Assessment


