

|
시장보고서
상품코드
2118002
물류 소프트웨어 시장 : 점유율 분석, 업계 동향과 통계, 성장 예측(2026-2031년)Logistics Software - Market Share Analysis, Industry Trends & Statistics, Growth Forecasts (2026 - 2031) |
||||||
 Mordor Intelligence
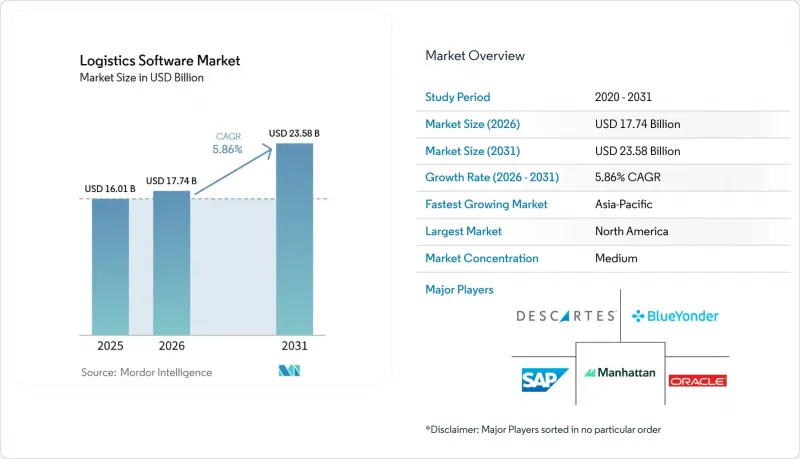
Mordor Intelligence에 의하면, 물류 소프트웨어 시장 규모는 2025년 160억 1,000만 달러에서 2031년까지 235억 8,000만 달러에 이를 것으로 예상되고 있어 2026년부터 2031년까지 CAGR 5.86%로 성장할 전망입니다.
본 보고서는 구성 요소(소프트웨어 및 서비스), 도입 형태(클라우드 기반, On-Premise형 등), 최종 사용자 기업 규모(대기업 등), 최종 사용자 산업(공업 제조, 소매 및 전자상거래, 식품 및 음료 등), 운송 수단(도로, 철도, 항공 등) 및 지역별로 분류되어 있습니다. 시장 전망은 금액(달러) 기준으로 제시되어 있습니다.
세계 물류 소프트웨어 시장 동향 및 인사이트
전자상거래 및 옴니채널 배송의 복잡화
전자상거래의 부상으로 물류 소프트웨어 시장은 단순한 경로 계획의 범주를 넘어, 채널과 거점을 아우르는 주문 이행(fulfillment)을 관리하는 시스템으로 변화했습니다. 2025년 MIT 교통·물류 센터가 647명공급망 전문가를 대상으로 실시한 설문조사에 따르면, 51%가 온라인과 오프라인 채널 통합을 주요 전략적 과제로 꼽았으며, 이는 전년의 44%에서 증가한 수치입니다. 같은 조사에서 응답자의 81%가 전자상거래의 성장을 지속적으로 경험하고 있으며, 이로 인해 업무의 복잡성이 증가하고 있는 것으로도 보고되었습니다. 보고된 서비스 제공 비용에 대한 압박은 38%에서 42%로 상승했으며, 반품과 관련된 비용 압박도 33%에서 40%로 증가했습니다. 운송, 주문 처리, 라스트 마일용 소프트웨어를 활용하면 수동 개입 없이 매장, 물류 센터, 제3자 물류(3PL) 거점 간에 주문을 라우팅할 수 있습니다. 재고 가시성과 물류 실행을 연계하지 못하는 기업은 판매 채널이 늘어남에 따라 주문 처리 오류가 발생할 위험이 높아집니다.
중소기업의 클라우드 네이티브 물류 소프트웨어 도입
클라우드 네이티브 제품은 소규모 사업자가 대규모 인프라를 자체적으로 구축하지 않고도 운송업체와의 연계, 출하 현황 가시화, 경로 설정 지원, 워크플로우 도구 등 과거에는 대기업에만 국한되었던 기능을 이용할 수 있게 함으로써 물류 소프트웨어 시장을 확대되고 있습니다. 구독형 가격 책정을 통해, 많은 중소기업이 엔터프라이즈급 도구를 도입하는 데 걸림돌이 되었던 초기 투자 부담이 해소되었습니다. 클라우드 도입은 몇 주 만에 완료될 수 있지만, 기존의 On-Premise형 프로젝트에서는 설정이나 인프라 구축에 수개월이 소요되는 경우가 흔했습니다. 또한, 거래 기반 또는 사용자 기반의 요금 체계를 통해 벤더는 그동안 스프레드시트나 운송업체가 제공하는 도구에 의존하던 사업자에게도 서비스를 제공할 수 있게 되었습니다. 아시아태평양과 남미에서는 많은 소규모 사업자가 기존 플랫폼을 대체하는 것이 아니라, 처음으로 본격적인 운송 시스템이나 창고 관리 시스템을 도입하고 있어 도입이 급속히 진행되고 있습니다. 일본의 ‘2026-2030년도 종합물류정책대강’은 물류의 디지털화와 친환경화를 지원하고 있으며, 소규모 사업자의 도입을 촉진하는 조치도 포함되어 있습니다.
레거시 ERP, EDI, 텔레매틱스 통합의 복잡성
통합은 물류 소프트웨어 시장에서 큰 제약 요인으로 작용하고 있습니다. 이는 대규모 화주들이 오랜 기간에 걸쳐 구축된 시스템을 운영하는 경우가 많으며, 중요한 업무 프로세스가 서로 다른 시기에 서로 다른 팀에 의해 구매, 맞춤화, 유지보수된 여러 시스템에 분산되어 있기 때문입니다. 이러한 환경에는 구형 EDI 게이트웨이, 맞춤형 On-Premise형 ERP 시스템, 운송사 고유의 텔레매틱스 연결 등이 포함될 수 있습니다. 각 계층에서는 서로 다른 데이터 형식, 업데이트 속도, 업무 규칙이 사용되고 있을 가능성이 있습니다. 또한, 문서화되지 않은 EDI 매핑에는 운송업체별 예외 처리, 경로 규칙, 재무 대조 프로세스 등이 포함되어 있을 수 있으며, 업무에 지장을 주지 않고 이를 대체하는 것은 어렵습니다. 배치 처리에 의한 EDI 처리나 실시간 애플리케이션 프로그래밍 인터페이스(API)의 경우, 기술적 연결이 확립된 후에도 데이터에 타이밍 차이가 발생할 수 있습니다. 전용 ERP, EDI 및 운송 관리 시스템(TMS) 커넥터를 제공하는 벤더는 도입 기간을 단축하고 복잡한 기업 요구 사항에 대한 대응력을 높일 수 있습니다.
부문 분석
2025년, 소프트웨어는 물류 소프트웨어 시장 점유율의 76.44%를 차지하며 주요 구성 범주가 되었습니다. 또한, 구독 및 라이선싱 수익이 이 범주 내 지출의 주요 원천이었습니다. 운송 관리 시스템, 창고 관리 시스템, 공급망 가시화 제품은 공유 클라우드 플랫폼상의 연동 모듈로 제공되는 사례가 증가하고 있으며, 사용자에게 여러 실행 작업에 대응하는 공통 데이터 환경을 제공합니다. 기업의 구매 담당자는 여러 포인트 솔루션 계약보다 단일 플랫폼 계약을 선호하는 경향이 있습니다. 이는 단일 공급업체라면 운송, 창고, 출하 가시화 각 워크플로우 전반에 걸친 연계된 의사결정을 지원할 수 있기 때문입니다. 이러한 추세로 인해, 하나의 워크플로우만을 다루고 관련 운영 체제와의 통합이 쉽지 않은 독립형 소프트웨어 제품의 적용 범위는 제한되고 있습니다. 서비스는 도입, 교육, 통합 및 관리형 지원을 통해 나머지 구성 요소 수요를 차지하고 있으며, 특히 고객이 광범위한 설정이 필요한 복잡한 프로세스를 보유하고 있는 경우 이러한 경향이 두드러집니다.
물류 소프트웨어 시장은 플랫폼의 지속적인 도입과 기존 고객 계정 내 기능 추가에 힘입어 2026년부터 2031년까지 연평균 성장률(CAGR) 6.38%를 나타낼 것으로 예측됩니다. 벤더는 AI 에이전트, 배기 가스 모니터링, 야드 관리 및 기존 시스템을 확장하는 관련 기능을 추가함으로써 기존 고객으로부터의 소프트웨어 수익을 증가시킬 수 있습니다. 임베디드 AI는 플랫폼 외부에서 독립적인 분석 계층으로 기능하는 것이 아니라 창고 및 운송 워크플로우 내에서 작동하므로, 일상 업무에서 새로운 기능을 보다 쉽게 활용할 수 있게 해줍니다. 이러한 제품 접근 방식을 통해 여러 물류 기능에 걸쳐 공통 플랫폼의 가치를 높이고, 용도 간 개별 데이터 전송의 필요성을 줄일 수 있습니다. 유럽연합 집행위원회 시행규칙(EU) 2025/2243은 eFTI 플랫폼의 기능 요건을 규정하고 있으며, 유럽 화물 정보 워크플로우를 지원하는 벤더에게는 규정 준수상의 고려 사항이 되며, 구형 시스템이 필요한 기능이나 보안 사양을 충족하지 못하는 경우 업그레이드가 권장됩니다.
2025년에는 클라우드 기반 도입이 물류 소프트웨어 시장의 63.91%를 차지하며 가장 큰 도입 모델이 되었습니다. 이는 전체 고객 그룹에서 공급업체 관리형 시스템이 널리 채택되고 있음을 반영합니다. 클라우드 시스템을 통해 고객은 자사 시설 내에서 서버 인프라를 구매, 운영, 유지보수해야 할 필요성이 줄어듭니다. 또한, 소프트웨어 업그레이드가 정기적인 사내 프로젝트에서 공급업체 관리형 릴리스로 전환됨에 따라, 사용자는 사내에서 상당한 기술적 작업을 수행하지 않고도 업데이트된 기능을 이용할 수 있게 됩니다. 이 모델은 사내 기술 자원이 제한적인 기업의 기술적 부담을 줄여주고, 연계된 운송업체, 창고, 가시화 서비스에 대한 신속한 접근을 지원합니다. On-Premise 구축은 엄격한 데이터 관리 요건을 가진 대형 제조업체나 정부 관련 화주들 사이에서 여전히 중요한 역할을 하고 있으며, 이러한 경우 도입 선택은 단순한 선호 문제가 아니라 규정 준수 의무에 의해 점점 더 좌우되고 있습니다.
구독 방식에 따른 비용 장벽이 낮아짐에 따라 On-Premise 도입이 우세했던 상황은 변화하고 있으며, 클라우드 기반 도입은 2031년까지 연평균 성장률(CAGR) 7.28%를 나타낼 것으로 예측되는데, 이는 도입 형태 중 가장 높은 성장률입니다. 하이브리드 모델에서는 기밀성이 높은 운영 데이터를 로컬 시스템에 보관하면서, 가시화, 분석 및 특정 조정 기능을 클라우드에 배치할 수 있습니다. 이 접근 방식은 데이터 주권 요건이 시스템 아키텍처나 운영 데이터의 저장 위치에 영향을 미칠 가능성이 있는 중국, 인도, 독일 등 시장에서 효과적입니다. 중견 기업 및 중소기업 고객은 클라우드 수요의 중요한 원천이 되고 있습니다. 이들 중 다수가 운송, 창고, 또는 시각화 기술에 처음으로 본격적인 투자를 하고 있기 때문입니다. 아시아태평양이나 남미에서는 성숙한 지역에 비해 레거시 On-Premise 환경에 대한 의존도가 낮기 때문에 클라우드 도입이 용이해질 가능성이 있습니다. 한편, 일본의 2026년부터 2030년까지의 물류 정책에서는 물류 시스템의 표준화와 디지털화에 더욱 주목하고 있습니다.
지역별 분석
북미는 2025년 물류 소프트웨어 시장 점유율의 37.04%를 차지하며, 지역별 최대 점유율을 기록했습니다. 이는 밀집된 운송업체 네트워크와 대형 화주들의 광범위한 운송·창고 관리 시스템 도입에 힘입은 결과입니다. 미국이 해당 지역 수요 대부분을 차지하고 있으며, 개별 용도에서 단일 공급업체와의 계약 하에 운송, 창고, 가시화 기능을 결합한 형태로 전환되고 있습니다. 캐나다와 멕시코는 국경을 넘는 무역 워크플로우를 통해 수요를 견인하고 있으며, 미국·멕시코·캐나다 협정(USMCA)에서는 물류 파트너 간의 조율된 정보 공유가 요구되고 있습니다. 이 지역에서는 소수공급업체가 물류 업무를 위한 AI 기능을 개발하고 있어, 화주와 물류 사업자에게 계획 수립 및 예외 관리 개선을 요구하는 경쟁 압력이 강해지고 있습니다. 한편, 운송 관리 시스템 도입이 성숙 단계에 접어들면서 단순한 초기 도입이 아닌 연동 기능에 대한 관심이 높아지고 있습니다.
유럽은 주요 물류 소프트웨어 시장입니다. 그 이유는 규제가 복잡하기 때문에 규정을 준수하는 화물 정보 플랫폼과 신뢰성 높은 물류 데이터 교환에 대한 수요가 증가하고 있기 때문입니다. 유럽연합 집행위원회 시행규칙(EU) 2025/2243은 운송 수단을 아우르는 전자화물운송정보(eFTI)를 지원하는 플랫폼에 대해 상세한 기능 요건을 규정하고 있습니다. 2025년 6월 스마트 프레이트 센터(Smart Freight Centre)와 SINE 재단이 출범시킨 iLEAP 프로토콜은 시스템 간 물류 배출량 데이터를 구조화하고 교환하기 위한 프레임워크를 제공합니다. 이러한 규정과 데이터 표준으로 인해 화물 데이터 및 배출량 데이터를 일관된 방식으로 수집, 교환, 보고하는 시스템에 대한 수요가 증가하고 있습니다. 유럽에서는 독일, 영국, 프랑스, 네덜란드의 소프트웨어 지출이 가장 집중되어 있는 반면, 남유럽 및 동유럽 시장은 도입 주기의 초기 단계에 머물러 있어 시스템을 처음 도입할 여지가 더 큰 상황입니다.
아시아태평양은 2031년까지 연평균 성장률(CAGR) 7.57%를 나타낼 것으로 예측되며, 중국의 산업용 전자상거래 거래액, 인도의 확대되는 제3자 물류(3PL) 부문, 그리고 일본의 디지털화 추진 정책에 힘입어 가장 빠르게 성장하는 지역 시장이 되고 있습니다. 일본의 ‘2026-2030년도 종합물류정책대강’에서는 물류의 디지털화와 친환경 전환이 국가 정책의 우선 과제로 자리 잡고 있습니다. 중동 시장, 특히 사우디아라비아와 아랍에미리트(UAE)에서는 디지털 인프라 구축 프로그램과 항만 현대화 프로젝트를 통해 물류 기술 도입이 추진되고 있습니다. 아프리카는 아직 초기 단계에 있지만, 남아프리카공화국, 나이지리아, 이집트에서는 항만 물류, 정부의 화물 규제 준수, 소비재 유통 분야에서 가장 높은 이용률을 보이고 있습니다. 광대역 및 클라우드 인프라 구축이 진전되면 아프리카 시장 전체에 걸쳐 보급이 촉진될 것입니다. 한편, 남미는 라스트 마일 배송 관리 분야의 벤더 투자 대상으로서 점점 더 주목받고 있습니다.
기타 혜택:
- 엑셀 형식 시장 예측(ME) 시트
- 3개월간의 애널리스트 지원
자주 묻는 질문
목차
제1장 서론
제2장 조사 방법
제3장 개요
제4장 시장 구도
제5장 시장 규모와 성장 예측
제6장 경쟁 구도
제7장 시장 기회와 향후 전망
JHS 26.09.01According to Mordor Intelligence, the logistics software market size is expected to increase from USD 16.01 billion in 2025 to reach USD 23.58 billion by 2031, growing at a CAGR of 5.86% over 2026-2031.
This report is Segmented by Component (Software, and Services), Deployment Mode (Cloud-Based, On-Premises, and More), End-Use Enterprise Size (Large Enterprises, and More), End-User Industry (Industrial Manufacturing, Retail and E-Commerce, Food and Beverage, and More), Mode of Transportation (Roadways, Railways, Airways, and More), and Geography. The Market Forecasts are Provided in Terms of Value (USD).
Global Logistics Software Market Trends and Insights
E-Commerce and Omnichannel Delivery Complexity
E-commerce has changed the logistics software market from a routing category into a system for managing fulfillment across channels and locations. A 2025 MIT Center for Transportation and Logistics survey of 647 supply chain professionals found that 51% identified online and offline channel integration as their main strategic challenge, up from 44% in the prior year. The same study reported that 81% of respondents continued to experience e-commerce growth, which added to operating complexity. Reported cost-to-serve pressure rose from 38% to 42%, while returns-related cost pressure increased from 33% to 40%. Transportation, order, and last-mile software can route orders across stores, distribution centers, and third-party logistics nodes without manual intervention. Companies that cannot connect inventory visibility with logistics execution face a higher risk of fulfillment errors as the number of selling channels grows.
Cloud-Native Logistics Software Adoption by SMEs
Cloud-native products are broadening the logistics software market by enabling smaller operators to access capabilities once limited to large enterprises, including carrier connectivity, shipment visibility, routing support, and workflow tools, without building extensive local infrastructure. Subscription pricing removes the upfront capital commitment that had kept many small and medium enterprises from adopting enterprise-grade tools. Cloud deployments can be completed in weeks, while older on-premises projects often require months of configuration and infrastructure work. Transaction-based and user-based pricing also allows vendors to serve operators that previously relied on spreadsheets or carrier-provided tools. Asia-Pacific and South America are seeing strong adoption because many smaller operators are installing their first formal transportation or warehouse system rather than replacing an older platform. Japan's Comprehensive Logistics Policy Outline for 2026-2030 supports logistics digitization and green transformation, including measures that can encourage adoption by smaller operators.
Legacy ERP, EDI, and Telematics Integration Complexity
Integration is a major restraint on the logistics software market because large shippers often operate systems assembled over many years, with important business processes spread across systems that were purchased, customized, and maintained by different teams at different times. These environments can include older EDI gateways, customized on-premises enterprise resource planning systems, and carrier-specific telematics connections. Each layer can use different data formats, update speeds, and business rules. Undocumented EDI mappings may also contain carrier exceptions, route rules, and financial reconciliation processes that are difficult to replace without disrupting operations. Batch EDI processing and real-time application programming interfaces can create timing differences in data even after a technical connection is established. Vendors that offer dedicated ERP, EDI, and transportation management system connectors can reduce deployment time and improve their position in complex enterprise requests.
Other drivers and restraints analyzed in the detailed report include:
- AI-Enabled Predictive ETA and Route Optimization
- Warehouse Automation and Labor Productivity Requirements
- Cybersecurity, Data Sovereignty, and Operational Technology Exposure
For complete list of drivers and restraints, kindly check the Table Of Contents.
Segment Analysis
Software held 76.44% of the logistics software market share in 2025, making it the principal component category, and subscription and license revenue were the main sources of category spending. Transportation management systems, warehouse management systems, and supply chain visibility products are increasingly offered as connected modules on shared cloud platforms, providing users with a common data environment for multiple execution tasks. Enterprise buyers often prefer a single-platform contract rather than multiple point-solution contracts because a single provider can support coordinated decisions across transport, warehouse, and shipment visibility workflows. This preference limits the scope of independent software products that cover only one workflow and do not integrate easily with related operating systems. Services accounted for the remaining component demand through implementation, training, integration, and managed support, particularly when customers have complex processes that require extensive configuration.
The logistics software market is projected to grow at a 6.38% CAGR from 2026 to 2031, supported by recurring platform adoption and the addition of functions within existing customer accounts. Vendors can increase software revenue from current customers as they add AI agents, emissions monitoring, yard management, and related capabilities that extend the original system. Embedded AI can operate in warehouse and transportation workflows instead of sitting outside the platform as a separate analytics layer, which can make new functions easier to use in daily work. This product approach can increase the value of a common platform across several logistics functions and can reduce the need for separate data transfers between applications. Commission Implementing Regulation (EU) 2025/2243 sets functional requirements for eFTI platforms, creating a compliance consideration for vendors serving European freight information workflows and encouraging upgrades where older systems do not meet required functions or security specifications.
Cloud-based deployment commanded a 63.91% share of the logistics software market in 2025 and was the largest deployment model, reflecting the broad adoption of vendor-managed systems across customer groups. Cloud systems reduce the need for customers to buy, operate, and maintain server infrastructure within their own facilities. They also shift software upgrades from periodic internal projects to vendor-managed releases, giving users access to updated capabilities without the same level of local technical work. This model can reduce the technical burden for companies with limited internal technology resources and can support quicker access to connected carrier, warehouse, and visibility services. On-premises deployment still has a role among large manufacturers and government-related shippers with strict data control requirements, where deployment choice is increasingly shaped by compliance obligations rather than preference alone.
Cloud-based deployment is projected to grow at a 7.28% CAGR through 2031, the highest rate among deployment modes, as subscription economics reduce the cost barrier that once favored on-premises implementations. Hybrid models can keep sensitive operating data on local systems while placing visibility, analytics, and selected coordination functions in the cloud. This approach is relevant in markets such as China, India, and Germany, where data sovereignty requirements can affect system architecture and the location of operational data. Mid-market and SME customers are an important source of cloud demand because many are making their first formal investment in transportation, warehouse, or visibility technology. In Asia-Pacific and South America, fewer legacy on-premises commitments can make cloud adoption easier than in mature regions, while Japan's 2026-2030 logistics policy gives further attention to logistics system standards and digitization.
Complete Report Scope:
- By Component
- Software
- Transportation Management Systems
- Warehouse Management Systems
- Fleet and Carrier Management Software
- Supply Chain Visibility Software
- Order Fulfillment and Delivery Management
- Freight Execution and Audit Software
- Yard Management Systems
- Services
- Software
- By Deployment Mode
- Cloud-Based
- On-Premises
- Hybrid
- By End Use Enterprise Size
- Large Enterprises
- Small and Medium Enterprises
- Micro Enterprises
- By End-User Industry
- Industrial Manufacturing
- Retail and E-Commerce
- Third-Party Logistics and Logistics Service Providers
- Food and Beverage
- Healthcare and Pharmaceuticals
- Automotive
- Oil and Gas
- Government and Defense
- Technology, Telecommunications, and IT
- By Mode of Transportation
- Roadways
- Railways
- Airways
- Maritime
- By Geography
- North America
- United States
- Canada
- Mexico
- South America
- Brazil
- Argentina
- Rest of South America
- Europe
- Germany
- United Kingdom
- France
- Italy
- Spain
- Russia
- Rest of Europe
- Asia-Pacific
- China
- Japan
- India
- South Korea
- Australia and New Zealand
- Rest of Asia-Pacific
- Middle East
- Saudi Arabia
- United Arab Emirates
- Turkey
- Rest of Middle East
- Africa
- South Africa
- Nigeria
- Egypt
- Rest of Africa
- North America
Geography Analysis
North America held 37.04% of the logistics software market share in 2025, the largest regional share, supported by dense carrier networks and the broad adoption of transportation and warehouse management systems among large shippers. The United States accounts for most regional demand and is moving from individual applications toward contracts that combine transportation, warehousing, and visibility functions under a single vendor relationship. Canada and Mexico add demand through cross-border trade workflows, and the United States-Mexico-Canada Agreement requires coordinated information sharing across logistics partners. A concentrated group of vendors is developing AI capabilities for logistics operations in the region, increasing competitive pressure on shippers and logistics providers to improve planning and exception management, while mature transportation management system deployments are driving interest in connected functions rather than just first-time adoption.
Europe is a major logistics software market because its regulatory complexity supports demand for compliant freight information platforms and reliable logistics data exchange. Commission Implementing Regulation (EU) 2025/2243 provides detailed functional requirements for eFTI platforms that support electronic freight transport information across transport modes. The iLEAP protocol, launched by the Smart Freight Centre and SINE Foundation in June 2025, provides a framework for structuring and exchanging logistics emissions data between systems. These rules and data standards increase demand for systems that capture, exchange, and report freight and emissions data in a consistent way. Germany, the United Kingdom, France, and the Netherlands have the highest concentration of software spending in Europe, while Southern and Eastern European markets remain at an earlier point in their adoption cycle and have more room for first-time system adoption.
Asia-Pacific is projected to grow at a 7.57% CAGR through 2031 and is the fastest-growing regional market, supported by China's industrial e-commerce volume, India's expanding third-party logistics sector, and Japan's digitization agenda. Japan's Comprehensive Logistics Policy Outline for 2026-2030 places logistics digitization and green transformation within national policy priorities. Middle East markets, particularly Saudi Arabia and the United Arab Emirates, are using digital infrastructure programs and port modernization projects to support logistics technology adoption. Africa is at an earlier stage, with South Africa, Nigeria, and Egypt showing the highest use in port logistics, government freight compliance, and consumer goods distribution. Better broadband and cloud infrastructure would support wider adoption across African markets, while South America remains a growing focus for vendor investment in last-mile delivery management.
- Manhattan Associates, Inc.
- Blue Yonder Group, Inc.
- SAP SE
- Oracle Corporation
- The Descartes Systems Group Inc.
- WiseTech Global Limited
- Ehrhardt Partner Group
- Infor (US), LLC
- Generix Group
- Tecsys Inc.
- Trimble Inc.
- Alpega Group
- project44 Holdings, Inc.
- FourKites, Inc.
- Shippeo SAS
- Made4net
- TESISQUARE S.p.A.
- VTradEx Technology Co., Ltd.
Additional Benefits:
- The market estimate (ME) sheet in Excel format
- 3 months of analyst support
TABLE OF CONTENTS
1 INTRODUCTION
- 1.1 Study Assumptions and Market Definition
- 1.2 Scope of the Study
2 RESEARCH METHODOLOGY
3 EXECUTIVE SUMMARY
4 MARKET LANDSCAPE
- 4.1 Market Overview
- 4.2 Impact of Macroeconomic Factors on the Market
- 4.3 Market Drivers
- 4.3.1 E-Commerce and Omnichannel Delivery Complexity
- 4.3.2 Cloud-Native Logistics Software Adoption by SMEs
- 4.3.3 AI-Enabled Predictive ETA and Route Optimization
- 4.3.4 Warehouse Automation and Labor Productivity Requirements
- 4.3.5 Regulatory Digitization of Freight and Emissions Data
- 4.3.6 Network Disruption and Supply Chain Resilience Investment
- 4.4 Market Restraints
- 4.4.1 Legacy ERP, EDI, and Telematics Integration Complexity
- 4.4.2 Cybersecurity, Data Sovereignty, and Operational Technology Exposure
- 4.4.3 High Implementation Cost and Change-Management Burden
- 4.4.4 Fragmented Carrier Data Standards and Limited Data Completeness
- 4.5 Industry Value Chain Analysis
- 4.6 Regulatory Landscape
- 4.7 Technological Outlook
- 4.8 Porter's Five Forces Analysis
- 4.8.1 Threat of New Entrants
- 4.8.2 Bargaining Power of Suppliers
- 4.8.3 Bargaining Power of Buyers
- 4.8.4 Threat of Substitutes
- 4.8.5 Competitive Rivalry
- 4.9 Functional Capability and Application Assessment
- 4.9.1 Transportation and Freight Operations
- 4.9.2 Warehouse Operations
- 4.9.3 Last-Mile Delivery
- 4.9.4 Supply Chain Visibility and Control Tower
- 4.9.5 Order Fulfillment
- 4.9.6 Trade Compliance
- 4.9.7 Reverse Logistics
5 MARKET SIZE AND GROWTH FORECASTS (VALUE)
- 5.1 By Component
- 5.1.1 Software
- 5.1.1.1 Transportation Management Systems
- 5.1.1.2 Warehouse Management Systems
- 5.1.1.3 Fleet and Carrier Management Software
- 5.1.1.4 Supply Chain Visibility Software
- 5.1.1.5 Order Fulfillment and Delivery Management
- 5.1.1.6 Freight Execution and Audit Software
- 5.1.1.7 Yard Management Systems
- 5.1.2 Services
- 5.1.1 Software
- 5.2 By Deployment Mode
- 5.2.1 Cloud-Based
- 5.2.2 On-Premises
- 5.2.3 Hybrid
- 5.3 By End Use Enterprise Size
- 5.3.1 Large Enterprises
- 5.3.2 Small and Medium Enterprises
- 5.3.3 Micro Enterprises
- 5.4 By End-User Industry
- 5.4.1 Industrial Manufacturing
- 5.4.2 Retail and E-Commerce
- 5.4.3 Third-Party Logistics and Logistics Service Providers
- 5.4.4 Food and Beverage
- 5.4.5 Healthcare and Pharmaceuticals
- 5.4.6 Automotive
- 5.4.7 Oil and Gas
- 5.4.8 Government and Defense
- 5.4.9 Technology, Telecommunications, and IT
- 5.5 By Mode of Transportation
- 5.5.1 Roadways
- 5.5.2 Railways
- 5.5.3 Airways
- 5.5.4 Maritime
- 5.6 By Geography
- 5.6.1 North America
- 5.6.1.1 United States
- 5.6.1.2 Canada
- 5.6.1.3 Mexico
- 5.6.2 South America
- 5.6.2.1 Brazil
- 5.6.2.2 Argentina
- 5.6.2.3 Rest of South America
- 5.6.3 Europe
- 5.6.3.1 Germany
- 5.6.3.2 United Kingdom
- 5.6.3.3 France
- 5.6.3.4 Italy
- 5.6.3.5 Spain
- 5.6.3.6 Russia
- 5.6.3.7 Rest of Europe
- 5.6.4 Asia-Pacific
- 5.6.4.1 China
- 5.6.4.2 Japan
- 5.6.4.3 India
- 5.6.4.4 South Korea
- 5.6.4.5 Australia and New Zealand
- 5.6.4.6 Rest of Asia-Pacific
- 5.6.5 Middle East
- 5.6.5.1 Saudi Arabia
- 5.6.5.2 United Arab Emirates
- 5.6.5.3 Turkey
- 5.6.5.4 Rest of Middle East
- 5.6.6 Africa
- 5.6.6.1 South Africa
- 5.6.6.2 Nigeria
- 5.6.6.3 Egypt
- 5.6.6.4 Rest of Africa
- 5.6.1 North America
6 COMPETITIVE LANDSCAPE
- 6.1 Market Concentration
- 6.2 Strategic Moves
- 6.3 Market Share Analysis
- 6.4 Company Profiles (includes Global Level Overview, Market Level Overview, Core Segments, Financials as available, Strategic Information, Market Rank/Share, Products and Services, Recent Developments)
- 6.4.1 Manhattan Associates, Inc.
- 6.4.2 Blue Yonder Group, Inc.
- 6.4.3 SAP SE
- 6.4.4 Oracle Corporation
- 6.4.5 The Descartes Systems Group Inc.
- 6.4.6 WiseTech Global Limited
- 6.4.7 Ehrhardt Partner Group
- 6.4.8 Infor (US), LLC
- 6.4.9 Generix Group
- 6.4.10 Tecsys Inc.
- 6.4.11 Trimble Inc.
- 6.4.12 Alpega Group
- 6.4.13 project44 Holdings, Inc.
- 6.4.14 FourKites, Inc.
- 6.4.15 Shippeo SAS
- 6.4.16 Made4net
- 6.4.17 TESISQUARE S.p.A.
- 6.4.18 VTradEx Technology Co., Ltd.
7 MARKET OPPORTUNITIES AND FUTURE OUTLOOK
- 7.1 White-Space and Unmet-Need Assessment


