

|
시장보고서
상품코드
2118018
바이오 이미징 기술 시장 : 점유율 분석, 업계 동향과 통계, 성장 예측(2026-2031년)Bio-imaging Technologies - Market Share Analysis, Industry Trends & Statistics, Growth Forecasts (2026 - 2031) |
||||||
 Mordor Intelligence
에 의하면, 바이오 이미징 기술 시장 규모는 2025년에 117억 3,000만 달러로 평가되었고 2026년 124억 8,000만 달러에서 2031년까지 177억 3,000만 달러에 이를 것으로 예측되며, 예측 기간(2026-2031년) CAGR은 7.28%를 나타낼 전망입니다.
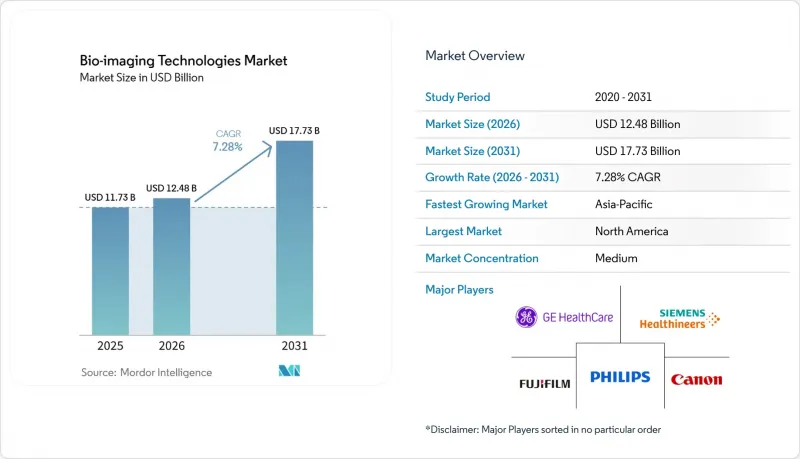
본 보고서는 기술 유형(의료용 바이오 이미징, 분자 바이오 이미징, 기타),모달리티(X선, CT, 자기공명영상법 등), 용도(종양학, 신경학, 심장학 등), 최종 사용자(병원, 영상진단센터 등), 지역(북미, 유럽 등)별로 분류되어 있습니다. 시장 예측은 금액(달러) 기준으로 제시되어 있습니다.
세계 바이오이미징 기술 시장 동향 및 인사이트
질병 조기 발견을 위한 고해상도 바이오 이미징에 대한 수요 증가
암의 조기 발견 및 신경퇴행성 질환의 선별 검사를 통해 구매자가 영상 진단 시스템에 요구하는 요건은 변화하고 있습니다. 병원에서는 일상적인 임상 판단을 위해 서브mm급 해상도나 조직의 체적 특성 평가를 요구하는 경향이 강해지고 있습니다. GE 헬스케어는 AIR Recon DL이 2025년 중반까지 8,000만 명 이상의 환자 스캔에 사용될 것이며, 스캔 시간을 최대 50% 단축할 수 있다고 밝혔습니다.
MRI 검사의 신속화는 스캐너의 처리 능력을 향상시키지만, 그만큼 영상 보고서 작성 및 판독 능력에 대한 부담이 증가합니다. 또한, 광자 계수 CT는 기존의 CT로는 얻을 수 없는 조직 정보를 제공하여 병변의 조기 평가를 지원합니다. 신경학 및 종양학 분야에서는 7T MRI와 PET-MRI의 활용으로 고해상도 및 다중 모달 영상 진단에 대한 수요가 더욱 확대되고 있습니다.
AI를 활용한 영상 재구성 및 정량 분석의 부상
바이오 이미징 기술 시장에서는 AI를 활용한 영상 재구성의 보급에 따라, 경쟁의 초점이 검출기 하드웨어에서 소프트웨어 성능 및 임상 워크플로우의 가치로 이동하고 있습니다. 지멘스 헬스인어즈(Siemens Healthineers)의 보고에 따르면, NHS 파이프(NHS Fife)에서는 ‘Deep Resolve’ 도입으로 MRI 스캔 시간이 20% 이상 단축되었으며, 그 결과 6개월 동안 1,900건 분량의 추가 예약 슬롯을 확보할 수 있었습니다. Philips는 AI 재구성 엔진을 채택한 검출기 기반 스펙트럼 CT 시스템 ‘Verida’에 대해 FDA의 510(k) 승인을 획득했습니다. Philips에 따르면, 이 시스템은 초당 145장의 이미지를 재구성하며, 하루 최대 270건의 검사를 처리할 수 있습니다. 소프트웨어 업데이트를 통해 장비를 교체하지 않고도 기존 스캐너 군의 성능을 향상시킬 수 있습니다. 이로 인해 병원의 도입 장벽은 낮아지는 한편, 소프트웨어 통합 및 조달 기준의 중요성이 더욱 높아지고 있습니다.
첨단 영상 진단 시스템 및 소프트웨어 업그레이드의 높은 도입 비용
바이오 이미징 기술 시장은 첨단 이미징 플랫폼을 도입하는 데 스캐너 구매 가격 이상의 비용이 들기 때문에 비용 면에서 장벽에 직면해 있습니다. 1.5T 또는 3.0T MRI 시스템의 가격은 90만 달러부터 시작하지만, 설치 비용, 서비스 계약, 소프트웨어 라이선스 비용 등이 더해지면서 전체 수명 주기 동안의 지출이 증가합니다. 입력 데이터에 따르면, 설치 비용은 15만-50만 달러, 연간 서비스 비용은 4만 2,000-13만 4,000달러입니다. 이러한 비용은 특히 자금 조달 옵션이 제한적인 시장에서 지역 병원이나 진단센터의 도입 승인을 지연시키는 요인이 될 수 있습니다. 2026년 유럽 46개국을 대상으로 실시된 조사에서도 인프라, 교육 및 보험 환급이 심혈관 MRI에 대한 공평한 접근을 저해하는 장벽으로 지목되었습니다. 리퍼브 시스템을 이용하면 초기 투자를 30%에서 60%까지 절감할 수 있지만, 구매자는 이러한 비용 절감 효과와 소프트웨어 호환성 및 보증 제한 사항을 신중히 따져보아야 합니다.
부문 분석
의료용 바이오 이미징은 2025년 매출 점유율의 62.34%를 차지하며, 병원 영상의학과, 진단 영상 센터 및 응급 의료 분야에서 핵심적인 역할을 반영하고 있습니다. 이러한 위상은 확립된 임상 워크플로우와 일상적인 진단 판단에 사용되는 규제 대상 모달리티에 의해 뒷받침되고 있습니다.
분자 바이오 이미징은 2031년까지 연평균 성장률(CAGR) 10.56%로 가장 높은 성장률을 나타낼 것으로 예측됩니다. 이 부문은 환자 선별 및 치료 모니터링을 위해 조영제와 치료용 방사성 의약품을 결합한 ‘테라노스틱스’의 혜택을 받고 있습니다. 란테우스(Lanteus)는 2026년, 제조 효율과 공급 유연성을 향상시키기 위해 재조제된 PSMA-PET 조영제 ‘PYLARIFY TruVu’에 대해 FDA 승인을 획득했습니다.
바이오 이미징 기술 시장에서 2025년에는 자기공명영상(MRI)이 시장 규모의 22.36%를 차지했습니다. MRI는 연조직 종양학, 신경학적 평가, 순환기학 및 전리 방사선을 피하는 것이 중요한 임상 경로에서 여전히 중요한 역할을 하고 있습니다. 핵의학 영상 시장은 2031년까지 연평균 성장률(CAGR) 9.54%를 나타낼 것으로 예측됩니다.
이 부문은 방사성 의약품의 승인, 세라노스틱(치료·진단 겸용) 케어 모델, 그리고 종양학 및 신경학 분야의 임상 활용 확대에 힘입어 성장하고 있습니다. 란테우스(Lanteus)는 2026년 3월, 위장관·췌장 신경내분비종양(GEP-NET) 치료제로 루테튬 Lu-177 도타테이트와 동등한 방사성 의약품인 PNT2003에 대해 FDA로부터 잠정 승인을 획득했습니다. 이번 승인은 방사성 리간드 요법에 대한 접근성을 확대할 가능성이 있는 제네릭 의약품의 길을 열어주는 것입니다.
지역별 분석
2025년 기준, 북미는 매출 점유율의 41.34%를 차지했습니다. 이 지역은 임상 영상 진단 장비 도입 실적이 풍부하고, 다중 모달 프로토콜을 채택하는 주요 암 센터가 존재하며, 보험 급여 환경도 변화하고 있습니다. 2026년 4월에 발표된 CMS-FDA의 RAPID 패스웨이를 통해, 대상 의료기기에 대해 규제 당국의 승인과 메디케어 적용 범위의 일관성이 더욱 높아질 가능성이 있습니다. 이 지역 내에서 미국이 가장 큰 점유율을 차지하고 있습니다. 캐나다와 멕시코는 규모가 작은 시장이지만, 클라우드 영상 진단 및 원격 방사선 진단을 통해 의료 서비스가 미치지 않는 지역으로 진단 서비스를 확대할 수 있습니다.
아시아태평양은 2031년까지 연평균 성장률(CAGR) 10.32%로 확대될 것으로 예측되며, 제공된 데이터 중 가장 빠른 지역 성장률을 보일 것으로 예측됩니다. 이러한 성장은 정책 방향, 국내 기술 투자, 그리고 확대되는 민간 진단 부문과 관련이 있습니다. 2025년 11월 중국에서 발표된 지침에 따르면, 2030년까지 모든 중급 이상 병원에서 AI를 활용한 의료 영상 진단의 도입이 요구되고 있습니다.
기타 혜택:
- 엑셀 형식 시장 예측(ME) 시트
- 3개월간의 애널리스트 지원
자주 묻는 질문
목차
제1장 서론
제2장 조사 방법
제3장 개요
제4장 시장 구도
제5장 시장 규모와 성장 예측
제6장 경쟁 구도
제7장 시장 기회와 향후 전망
JHS 26.09.01According to Mordor Intelligence, the bio-imaging technologies market size was valued at USD 11.73 billion in 2025 and is estimated to grow from USD 12.48 billion in 2026 to reach USD 17.73 billion by 2031, at a CAGR of 7.28% during the forecast period (2026-2031).
This report is Segmented by Technology Type (Medical Bio-Imaging, Molecular Bio-Imaging, Others), Modality (X-Ray, CT, Magnetic Resonance Imaging, and More), Application (Oncology, Neurology, Cardiology, and More), End User (Hospitals, Diagnostic Imaging Centers, and More), and Geography (North America, Europe, and More). The Market Forecasts are Provided in Terms of Value (USD).
Global Bio-imaging Technologies Market Trends and Insights
Growing Need for High-Resolution Biological Imaging in Early Disease Detection
Early cancer detection and neurodegenerative disease screening are changing what buyers expect from imaging systems. Hospitals increasingly seek sub-millimeter resolution and volumetric tissue characterization for routine clinical decisions. GE HealthCarestated that AIR Recon DL had been used in more than 80 million patient scans by mid-2025 and could reduce scan times by up to 50%.
Faster MRI examinations can improve scanner throughput, although they shift more pressure to image reporting and interpretation capacity. Photon-counting CT also offers tissue information that conventional CT cannot provide, supporting earlier assessment of lesions. In neurology and oncology, the use of 7T MRI and PET-MRI supports broader demand for high-resolution and multimodal imaging.
Rising AI-Enabled Image Reconstruction and Quantitative Analysis
The bio-imaging technologies market is seeing AI reconstruction shift competition from detector hardware toward software performance and clinical workflow value. Siemens Healthineers reported that Deep Resolve supported an MRI scan-time reduction of more than 20% at NHS Fife, which created capacity for 1,900 additional appointments in 6 months. Philipsreceived FDA 510(k) clearance for Verida, a detector-based spectral CT system that uses an AI reconstruction engine. Philips stated that the system reconstructs 145 images per second and can support up to 270 examinations daily. Software updates can improve the performance of legacy scanner fleets without a capital replacement. This reduces barriers to adoption for hospitals while increasing the importance of software integration and procurement standards.
High Capital Cost of Advanced Imaging Systems and Software Upgrades
The bio-imaging technologies market faces a cost barrier because acquiring an advanced imaging platform extends beyond the scanner purchase price. A 1.5T or 3.0T MRI system can start at USD 900,000, while installation, service contracts, and software licenses increase lifecycle expenditure. The input data indicates installation costs of USD 150,000 to USD 500,000 and annual service costs of USD 42,000 to USD 134,000. These costs can delay approvals at community hospitals and diagnostic centers, especially in markets with limited financing. A 2026 study across 46 European countries also identified infrastructure, training, and reimbursement as barriers to equitable cardiovascular MRI access. Refurbished systems can reduce capital outlay by 30% to 60%, but buyers must weigh those savings against software compatibility and warranty limitations.
Other drivers and restraints analyzed in the detailed report include:
- Expanding Biopharma Use in Drug Discovery, Companion Diagnostics, and Translational Research
- Procurement Shift toward Portable, Cloud-Connected, and Workflow-Integrated Imaging Platforms
- Reimbursement Pressure, Validation Requirements, and Workforce Constraints
For complete list of drivers and restraints, kindly check the Table Of Contents.
Segment Analysis
Medical Bio-Imaging held 62.34% of the revenue share in 2025, reflecting its central role in hospital radiology, diagnostic imaging centers, and emergency care. Its position rests on established clinical workflows and regulated modalities used in everyday diagnostic decisions.
Molecular Bio-Imaging is projected to record the highest growth at a 10.56% CAGR through 2031. The segment benefits from theranostics, where an imaging agent is linked to a therapeutic radiopharmaceutical for patient selection and treatment monitoring. Lantheus received FDA approval for PYLARIFY TruVu in 2026, a reformulated PSMA PET imaging agent that is intended to improve manufacturing efficiency and supply flexibility.
Within the bio-imaging technologies market, Magnetic Resonance Imaging held 22.36% of the bio-imaging technologies market size in 2025. MRI remains important in soft-tissue oncology, neurological assessment, cardiology, and clinical pathways where avoiding ionizing radiation has value. Nuclear Imaging is forecast to grow at a 9.54% CAGR through 2031.
The segment is supported by radiopharmaceutical approvals, theranostic care models, and broader clinical use in oncology and neurology. Lantheus received FDA tentative approval for PNT2003 in March 2026, a radioequivalent to Lutetium Lu 177 Dotatate for gastroenteropancreatic neuroendocrine tumors. The approval points to a generic pathway that could broaden access to radioligand procedures.
Complete Report Scope:
- By Technology Type
- Medical Bio-Imaging
- Molecular Bio-Imaging
- Others (Functional Bio-Imaging, Preclinical Bio-Imaging and More)
- By Modality
- X-Ray
- Computed Tomography
- Magnetic Resonance Imaging
- Ultrasound Imaging
- Nuclear Imaging
- Optical Imaging
- Others (Positron Emission Tomography, Photoacoustic Imaging, and More)
- By Application
- Oncology
- Neurology
- Cardiology
- Orthopedics
- Gastroenterology
- Others (Precision Medicine, Regenerative Medicine, and More)
- By End User
- Hospitals And Clinics
- Diagnostic Imaging Centers
- Academic And Research Institutes
- Pharmaceutical And Biotechnology Companies
- Contract Research Organizations
- By Geography
- North America
- United States
- Canada
- Mexico
- Europe
- Germany
- United Kingdom
- France
- Italy
- Spain
- Rest of Europe
- Asia-Pacific
- China
- India
- Japan
- Australia
- South Korea
- Rest of Asia-Pacific
- Middle East and Africa
- GCC
- South Africa
- Rest of Middle East and Africa
- South America
- Brazil
- Argentina
- Rest of South America
- North America
Geography Analysis
North America held 41.34% of the revenue share in 2025. The region has a large installed base of clinical imaging equipment, major cancer centers using multimodal protocols, and an evolving reimbursement environment. The CMS-FDA RAPID pathway announced in April 2026 may better align regulatory authorization and Medicare coverage for eligible devices. The United States represents the largest share within the region. Canada and Mexico are smaller markets where cloud imaging and teleradiology can extend diagnostic services into underserved areas.
Asia-Pacific is projected to expand at a 10.32% CAGR through 2031, the fastest regional pace in the supplied data. The growth is linked to policy direction, domestic technology investment, and an expanding private diagnostic sector. China's November 2025 directive called for AI-assisted medical imaging diagnosis in all secondary-level and higher hospitals by 2030.
- Agilent Technologies
- Bayer
- Bracco Imaging S.p.A.
- Bruker
- Canon
- Carestream Health
- Esaote S.p.A.
- FUJIFILM
- GE Healthcare
- Hologic
- Koninklijke Philips
- Lantheus Holdings, Inc.
- Mediso
- Revvity, Inc.
- Samsung Group
- Shimadzu
- Siemens Healthineers
- Thermo Fisher Scientific
Additional Benefits:
- The market estimate (ME) sheet in Excel format
- 3 months of analyst support
TABLE OF CONTENTS
1 Introduction
- 1.1 Study Assumptions & Market Definition
- 1.2 Scope of the Study
2 Research Methodology
3 Executive Summary
4 Market Landscape
- 4.1 Market Overview
- 4.2 Market Drivers
- 4.2.1 Growing Need for High-Resolution Biological Imaging in Early Disease Detection
- 4.2.2 Rising AI-Enabled Image Reconstruction and Quantitative Analysis
- 4.2.3 Expanding Biopharma Use in Drug Discovery, Companion Diagnostics, and Translational Research
- 4.2.4 Procurement Shift Toward Portable, Cloud-Connected, and Workflow-Integrated Imaging Platforms
- 4.2.5 Increasing Clinical Need for Multimodal Imaging in Oncology, Neurology, and Cardiovascular Care
- 4.2.6 Growing Installed Base of Research-Grade Microscopy and Preclinical Imaging Systems in Emerging Labs
- 4.3 Market Restraints
- 4.3.1 High Capital Cost of Advanced Imaging Systems and Software Upgrades
- 4.3.2 Reimbursement Pressure and Slow Clinical Validation for Novel Imaging Workflows
- 4.3.3 Data Interoperability Gaps Across Hardware, AI Models, and Laboratory Information Systems
- 4.3.4 Shortage of Imaging Scientists, AI Trained Radiology Staff, and Advanced Application Specialists
- 4.4 Supply Chain Analysis
- 4.5 Regulatory Landscape
- 4.6 Technological Outlook
- 4.7 Porter's Five Forces
- 4.7.1 Threat of New Entrants
- 4.7.2 Bargaining Power of Suppliers
- 4.7.3 Bargaining Power of Buyers
- 4.7.4 Threat of Substitutes
- 4.7.5 Industry Rivalry
5 Market Size & Growth Forecasts (Value, USD)
- 5.1 By Technology Type
- 5.1.1 Medical Bio-Imaging
- 5.1.2 Molecular Bio-Imaging
- 5.1.3 Others (Functional Bio-Imaging, Preclinical Bio-Imaging and More)
- 5.2 By Modality
- 5.2.1 X-Ray
- 5.2.2 Computed Tomography
- 5.2.3 Magnetic Resonance Imaging
- 5.2.4 Ultrasound Imaging
- 5.2.5 Nuclear Imaging
- 5.2.6 Optical Imaging
- 5.2.7 Others (Positron Emission Tomography, Photoacoustic Imaging, and More)
- 5.3 By Application
- 5.3.1 Oncology
- 5.3.2 Neurology
- 5.3.3 Cardiology
- 5.3.4 Orthopedics
- 5.3.5 Gastroenterology
- 5.3.6 Others (Precision Medicine, Regenerative Medicine, and More)
- 5.4 By End User
- 5.4.1 Hospitals And Clinics
- 5.4.2 Diagnostic Imaging Centers
- 5.4.3 Academic And Research Institutes
- 5.4.4 Pharmaceutical And Biotechnology Companies
- 5.4.5 Contract Research Organizations
- 5.5 By Geography
- 5.5.1 North America
- 5.5.1.1 United States
- 5.5.1.2 Canada
- 5.5.1.3 Mexico
- 5.5.2 Europe
- 5.5.2.1 Germany
- 5.5.2.2 United Kingdom
- 5.5.2.3 France
- 5.5.2.4 Italy
- 5.5.2.5 Spain
- 5.5.2.6 Rest of Europe
- 5.5.3 Asia-Pacific
- 5.5.3.1 China
- 5.5.3.2 India
- 5.5.3.3 Japan
- 5.5.3.4 Australia
- 5.5.3.5 South Korea
- 5.5.3.6 Rest of Asia-Pacific
- 5.5.4 Middle East and Africa
- 5.5.4.1 GCC
- 5.5.4.2 South Africa
- 5.5.4.3 Rest of Middle East and Africa
- 5.5.5 South America
- 5.5.5.1 Brazil
- 5.5.5.2 Argentina
- 5.5.5.3 Rest of South America
- 5.5.1 North America
6 Competitive Landscape
- 6.1 Market Concentration
- 6.2 Market Share Analysis
- 6.3 Company Profiles {(includes Global level Overview, Market level overview, Core Segments, Financials as available, Strategic Information, Market Rank/Share for key companies, Products & Services, and Recent Developments)}
- 6.3.1 Agilent Technologies, Inc.
- 6.3.2 Bayer AG
- 6.3.3 Bracco Imaging S.p.A.
- 6.3.4 Bruker Corporation
- 6.3.5 Canon Inc.
- 6.3.6 Carestream Health, Inc.
- 6.3.7 Esaote S.p.A.
- 6.3.8 FUJIFILM Holdings Corporation
- 6.3.9 GE HealthCare
- 6.3.10 Hologic, Inc.
- 6.3.11 Koninklijke Philips N.V.
- 6.3.12 Lantheus Holdings, Inc.
- 6.3.13 Mediso Ltd.
- 6.3.14 Revvity, Inc.
- 6.3.15 Samsung Medison Co., Ltd.
- 6.3.16 Shimadzu Corporation
- 6.3.17 Siemens Healthineers AG
- 6.3.18 Thermo Fisher Scientific Inc.
7 Market Opportunities & Future Outlook
- 7.1 White-space & unmet-need assessment


