

|
시장보고서
상품코드
2118026
OTT TV 시리즈 시장 : 점유율 분석, 업계 동향과 통계, 성장 예측(2026-2031년)OTT TV Series - Market Share Analysis, Industry Trends & Statistics, Growth Forecasts (2026 - 2031) |
||||||
 Mordor Intelligence
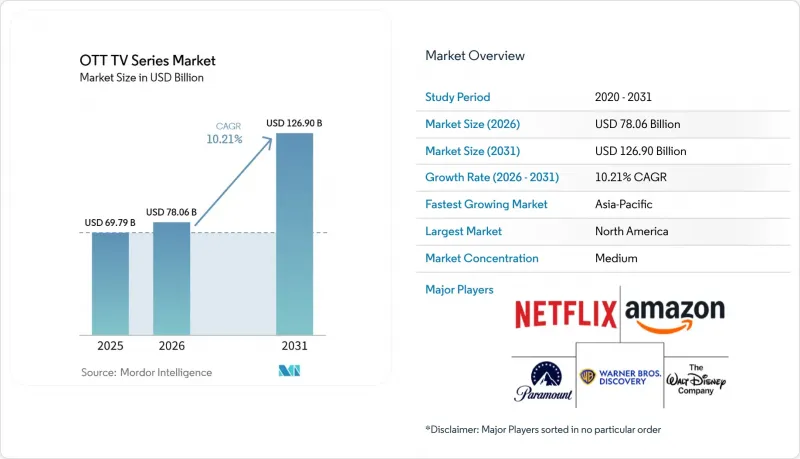
Mordor Intelligence에 의하면, OTT TV 시리즈 시장 규모는 2025년 697억 9,000만 달러, 2026년 780억 6,000만 달러에서 2031년까지 1,269억 달러로 확대된다고 예측되고 있어 2026년부터 2031년까지 연평균 성장률(CAGR)은 10.21%를 나타낼 전망입니다.
본 보고서는 수익화 모델(SVOD, AVOD, TVOD, 하이브리드, 프리미엄), 장르(드라마, 코미디, 액션·어드벤처, 범죄·스릴러 등), 기기 유형(스마트폰·태블릿,스마트 TV 등), 시청자 연령대(어린이·10대, 청년·고령자), 지역(북미, 유럽, 아시아태평양 등)별로 분류되어 있습니다. 시장 예측은 금액(달러) 기준으로 제시되어 있습니다.
세계 OTT TV 시리즈 시장 동향 및 인사이트
전 세계적으로 증가하는 연속형 오리지널 컨텐츠에 대한 수요
OTT TV 시리즈 시장은 성숙한 시청 지역과 신흥 시청 지역 모두에서 연속 드라마 형식의 스토리에 대한 강력한 수요의 혜택을 지속적으로 누리고 있습니다. 시청자가 새 시즌의 전개나 장기적인 스토리 전개를 따라가고 있는 경우, 구독을 해지할 가능성이 낮아지기 때문에 여러 에피소드로 구성된 오리지널 작품은 이제 중요한 사용자 유지 도구로 기능하고 있습니다. 이에 대응하여 각 플랫폼은 타이틀별 수익화 기준을 엄격히 적용하면서도 오리지널 시리즈에 대한 투자액을 높은 수준으로 유지하고 있습니다. 넷플릭스는 2025년 컨텐츠 투자액을 171억 달러로 보고했으며, 2026년에는 180억 달러를 목표로 하고 있어, 대형 서비스 사업자에게 프리미엄 시리즈가 여전히 주요 성장 동력임을 보여주고 있습니다. 디즈니 역시 2026 회계연도 컨텐츠 예산을 240억 달러로 유지하고 있으며, 이는 프리미엄 프로그램 라인업을 강화하기 위한 지속적인 투자라는 유사한 추세를 뒷받침합니다. 이에 따라 OTT TV 시리즈 시장은 지역을 초월하여 확장 가능하며, 구독자의 관심을 더 오랜 기간 유지할 수 있는 수는 적지만 가치가 높은 오리지널 작품에 계속 초점을 맞출 것입니다.
스마트 TV의 보급과 ‘린백형 시청’으로의 전환
OTT TV 시리즈 시장은 장시간 시청을 위한 메인 스크린으로서 스마트 TV의 부상으로 재편되고 있습니다. 이는 중요한 점입니다. TV 화면은 보다 전통적인 ‘린백형’ 시청 환경을 지원하며, 이는 시리즈 완주율, 재시청률 및 광고 인벤토리의 질 향상으로 이어지는 경향이 있기 때문입니다. 미국에서는 2025년 3분기 기준 TV의 85%가 스트리밍 컨텐츠에 접속하고 있으며, 이는 스트리밍이 가정의 메인 스크린에 얼마나 깊이 침투했는지를 보여줍니다. 광고 효과 역시 마찬가지로 중요합니다. 미국에서는 2026년에 커넥티드 TV 광고비가 전체 TV 광고비의 43%를 나타낼 것으로 예측되기 때문입니다. 이러한 변화가 진행됨에 따라 OTT TV 시리즈 시장은 프리미엄 시청 행동과 광고 수익 사이의 가교 역할을 더욱 공고히할 것입니다. 그 결과, 높은 참여도와 폭넓은 수익 창출을 모두 필요로 하는 플랫폼에 있어 더욱 균형 잡힌 비즈니스 모델이 실현될 것입니다.
성숙한 스트리밍 시장에서 나타나는 ‘구독 피로감’
OTT TV 시리즈 시장은 각 가구가 이미 여러 정기 결제 서비스를 관리하고 있는 성숙한 국가에서 뚜렷한 한계에 직면해 있습니다. 플랫폼이 충분한 신작 시리즈의 가치를 제공하지 못하거나 가격 조정 속도가 너무 빠를 경우, 소비자들은 서비스를 변경하거나 일시 정지하거나 해지하는 경향이 강해지고 있습니다. 이러한 압박은 규제 당국의 주목도 받고 있는데, 해지 절차 간소화가 보다 광범위한 소비자 보호 논의의 일부가 되고 있기 때문입니다. 미국 연방거래위원회(FTC)는 ‘클릭 투 캔슬’에 관한 규칙 제정 절차를 추진하고 있으며, 2026년 1월에는 초당파적인 ‘Unsubscribe Act(해지 촉진법)’가 하원에 제출되었습니다. 이러한 움직임은 스트리밍 자체에 대한 수요를 줄이는 것은 아니지만, 자동 갱신에 의존하고 있는 플랫폼 입장에서는 고객 유지를 더욱 어렵게 만들게 됩니다. OTT TV 시리즈 시장에서 이러한 상황은 사업자들에게 번들 요금제 도입, 저가 요금제 확충, 그리고 컨텐츠 배포 계획의 보다 치밀한 수립을 요구하게 될 것입니다.
부문 분석
2025년, SVOD는 매출의 42.48%를 차지하며 OTT TV 시리즈 시장에서 최대 수익원으로서의 지위를 유지했습니다. 이러한 지위는 시청자가 다른 곳에서 쉽게 대체할 수 없는 독점 제공 작품이나 연속 시리즈를 중심으로 구축된 구독 라이브러리의 지속적인 가치를 반영합니다. 하지만 2026년부터 2031년까지 AVOD가 연평균 성장률(CAGR) 11.40%로 확대될 것으로 예측됨에 따라, 성장의 중심은 점차 이동하고 있습니다. 광고 포함 요금제는 현재월이용료 전액을 지불하지 않고도 프리미엄 컨텐츠에 접근하기를 원하는 많은 사용자에게 주요 진입 경로 역할을 하고 있습니다. 순 증가 수 데이터도 이미 이러한 추세를 보여주고 있으며, 2025년 1분기에는 프리미엄 구독 플랫폼 전체 순 증가 수의 57%를 광고 포함 요금제가 차지했습니다. 따라서 OTT TV 시리즈 시장은 이전 스트리밍 주기에 비해 순수 구독 성장에 대한 의존도가 낮아지고 있습니다.
이러한 변화가 SVOD의 위상을 약화시키는 것은 아닙니다. 오히려 플랫폼 구성 내에서 SVOD에 기대되는 역할이 변화하고 있는 것입니다. 프리미엄 구독 요금제는 여전히 독점 방영되는 대표 시리즈, 조기 시청의 가치, 그리고 높은 1인당 평균 수익(ARPU)과 가장 밀접한 연관성을 가지고 있습니다. 동시에 AVOD는 사업자에게 더 큰 고객 확보 경로를 제공하며, 그렇지 않았다면 유료 서비스 대상에서 제외되었을 가구로부터의 수익화를 가능하게 합니다. 2026년 미국의 디지털 동영상 광고 지출액 819억 달러는 이러한 방향성을 뒷받침하며, 수익화 모델에 실질적인 성장 여지를 가져다주고 있습니다. 실무적으로 OTT TV 시리즈 업계는 SVOD가 수익 기반을 확보하고, AVOD가 더 넓은 도달 범위를 주도하는 ‘다층적 수익화’로 전환되고 있습니다.
2025년, 드라마는 OTT TV 시리즈 시장 규모의 27.32%를 차지하며 조사 기간 동안 가장 큰 장르가 되었습니다. 드라마가 여전히 중심적인 위치를 차지하는 이유는 장기간에 걸친 캐릭터의 성장 스토리와 시즌 간의 연속성이 시청자 유지를 위한 가장 강력한 수단 중 하나이기 때문입니다. 시청자들은 인기 시리즈의 후속작을 보기 위해 구독을 유지하는 경우가 많아, 제작 비용이 높더라도 드라마의 가치는 유지됩니다. 한편, 액션·어드벤처는 2031년까지 연평균 성장률(CAGR) 11.80%로 확대될 것으로 예측되며, 대상 장르 중 가장 높은 성장 속도를 보일 것으로 전망됩니다. 이러한 성장 추세는 일부 코미디 형식에 비해 언어적 뉘앙스에 덜 의존하기 때문에 액션 중심의 스토리텔링이 지역을 불문하고 통하기 쉬운 점을 반영합니다. OTT TV 시리즈 시장에서 이러한 특성 덕분에 액션·어드벤처는 여러 국가로의 진출 및 프랜차이즈 확장을 위한 신뢰할 수 있는 선택지가 되고 있습니다.
드라마는 현지 및 세계 제작 위탁 전략 모두에 기여하기 때문에 여전히 컨텐츠 라이브러리의 두께를 지탱하는 주축이 되고 있습니다. 또한, EU 사용자를 보유한 플랫폼은 카탈로그의 최소 30%를 유럽 작품으로 구성해야 한다는 유럽의 컨텐츠 규제도 이 부문을 강화하고 있습니다. 이러한 요건은 현지 언어로 제작된 드라마나 해당 지역 내에서 전개 가능한 범죄 관련 시나리오 형식에 대한 투자를 촉진하고 있습니다. 액션과 어드벤처 장르에는 또 다른 장점이 있습니다. 바로 인지도가 높은 세계관이라면 시즌을 넘어서 전개하거나, 스핀오프 작품 및 머천다이징 계획으로 쉽게 확장할 수 있기 때문입니다. 리얼리티 프로그램이나 라이프스타일 프로그램은 안정적인 광고주에게 어필하면서도 저비용 카테고리를 추구하는 플랫폼에게 있어, OTT TV 시리즈 업계에서 여전히 유용합니다. 그 결과, 드라마가 사용자 유지율을 뒷받침하고, 액션이나 어드벤처가 국경을 초월한 폭넓은 확장을 가져오는 장르 구성이 형성되고 있습니다.
지역별 분석
2025년, 북미는 전 세계 매출의 30.34%를 차지하며 OTT TV 시리즈 시장에서 최대 지역 블록으로서의 위상을 유지했습니다. 이 지역은 사용자 1인당 지출액이 높고, 플랫폼 간 경쟁이 성숙하며, 커넥티드 TV 이용이 정착되어 있어 여전히 중요한 위치를 차지하고 있습니다. 미국에서는 2025년 3분기 TV의 85%가 스트리밍 컨텐츠에 접속하고 있어, 시리즈 시청이 스트리밍 환경에 얼마나 깊이 침투해 있는지를 뒷받침하고 있습니다. 또한, 이 지역은 수익화 혁신에서도 중심적인 역할을 수행하고 있으며, 프리미엄 구독, 광고 포함 요금제, 번들 상품 모두 이 지역에서 상당한 규모를 자랑하고 있습니다. 넷플릭스는 2026 회계연도 매출을 507억-517억 달러, 광고 수익을 30억 달러로 전망하고 있으며, 이는 수익 확대가 얼마나 강력하게 이중 수익 모델에 의존하고 있는지를 보여줍니다.
아시아태평양은 2026년부터 2031년까지 연평균 성장률(CAGR) 11.45%를 나타낼 것으로 예측되며, OTT TV 시리즈 시장에서 가장 눈에 띄는 성장을 보이는 지역입니다. 이 지역의 성장은 디지털 접근성 확대, 스마트폰 사용의 보급, 그리고 현지 언어로 제작된 시리즈에 대한 강력한 수요가 맞물려 뒷받침되고 있습니다. 이러한 성장은 많은 가구가 북미나 서유럽 가구에 비해 스트리밍 서비스 도입 주기가 아직 초기 단계에 있다는 사실도 반영하고 있습니다. 이 지역경쟁 구도는 세계 브랜드 인지도뿐만 아니라 국내 시장에서의 관련성에 의해 형성되고 있습니다. 인도, 일본, 중국 및 인근 국가에서 OTT TV 시리즈 시장이 성장함에 따라, 지역 언어 컨텐츠와 유연한 가격 정책에 투자하는 플랫폼일수록 신규 시청자를 확보하는 데 유리한 입지를 점하고 있습니다.
유럽은 주요 국가에서 유료 스트리밍의 보급이 이미 정착되어 있어, OTT TV 시리즈 시장에서 계속해서 중요한 위치를 차지하고 있습니다. 프랑스의 경우, 2026년에 가구의 74%가 적어도 하나의 유료 스트리밍 서비스를 이용할 것으로 예상되며, 이는 성숙하고 안정적인 수요 기반을 보여줍니다. 또한, EU 사용자에게 서비스를 제공하는 플랫폼은 카탈로그 내 유럽 작품의 비율을 최소 30%로 유지해야 한다는 유럽의 규제 체계 역시 현지 제작을 뒷받침하고 있습니다. 남미, 중동 및 아프리카는 여전히 발전 중인 시장이지만, 스마트폰을 통한 시청 및 광대역 접속이 낮은 수준에서 점차 개선되고 있어 중요한 시장으로 부상하고 있습니다. CANAL+는 2026년 7월 MultiChoice 인수를 완료했는데, 이는 OTT TV 시리즈 시장에서 장기적인 성장 분야로서 아프리카에 대한 지속적인 신뢰를 보여주는 것입니다. 이 지역 전반에 걸쳐 성장은 프리미엄 가격 책정에만 기인하기보다는 현지 시장에 대한 적합성 향상과 접근성 확대를 통해 이루어질 가능성이 높다고 볼 수 있습니다.
기타 혜택:
- 엑셀 형식 시장 예측(ME) 시트
- 3개월간의 애널리스트 지원
자주 묻는 질문
목차
제1장 서론
제2장 조사 방법
제3장 개요
제4장 시장 구도
제5장 시장 규모와 성장 예측
제6장 경쟁 구도
제7장 시장 기회와 향후 전망
JHS 26.09.01According to Mordor Intelligence, the OTT TV series market size is projected to expand from USD 69.79 billion in 2025 and USD 78.06 billion in 2026 to USD 126.90 billion by 2031, registering a CAGR of 10.21% between 2026 to 2031.
This report is Segmented by Monetization Model (SVOD, AVOD, TVOD, Hybrid, and Freemium), Genre (Drama, Comedy, Action and Adventure, Crime and Thriller, and More), Device Type (Smartphones and Tablets, Smart TVs, and More), Viewer Age Group (Children/Teens and Young Adults/Seniors), and Geography (North America, Europe, Asia-Pacific, and More). The Market Forecasts are Provided in Terms of Value (USD).
Global OTT TV Series Market Trends and Insights
Rising Global Appetite for Serialized Original Content
The OTT TV series market continues to benefit from strong demand for serialized storytelling across both mature and emerging viewing regions. Multi-episode originals now work as a core retention tool because viewers are less likely to cancel when they are following returning seasons or longer story arcs. Platforms have responded by keeping original series spending high even as they tighten title-level return thresholds. Netflix reported USD 17.1 billion in content spend for 2025 and targeted USD 18 billion for 2026, which shows that large services still treat premium series as a primary growth lever. Disney also maintained a FY2026 content budget of USD 24 billion, which supports the same pattern of continued investment in premium programming depth. This keeps the OTT TV series market focused on fewer but more valuable originals that can travel across territories and hold subscriber attention for longer periods.
Smart TV Penetration and Lean-Back Viewing Shift
The OTT TV series market is being reshaped by the rise of smart TVs as the main screen for long-session viewing. This matters because a television screen supports a more traditional lean-back environment, and that tends to lift series completion, repeat viewing, and ad inventory quality. In the United States, 85% of television sets accessed streaming content in Q3 2025, which shows how deeply streaming has moved into the main household screen. The advertising effect is just as important because connected TV ad spend in the United States is expected to reach 43% of total TV ad spend in 2026. As that shift continues, the OTT TV series market gains a stronger bridge between premium viewing behavior and advertising revenue. The result is a more balanced business model for platforms that need both strong engagement and broader monetization.
Subscription Fatigue Across Mature Streaming Markets
The OTT TV series market faces a clear limit in mature countries where households already manage several recurring services. Consumers are more willing to switch, pause, or cancel when a platform does not provide enough fresh series value or when pricing changes arrive too quickly. That pressure has also drawn regulatory attention because easier cancellation standards are now part of the broader consumer protection discussion. The U.S. Federal Trade Commission pursued its click-to-cancel rulemaking process, and a bipartisan Unsubscribe Act was introduced in the House of Representatives in January 2026. These developments do not reduce demand for streaming itself, but they do make retention harder for platforms that depend on passive renewals. In the OTT TV series market, this pushes operators toward bundles, lower-priced tiers, and tighter content release planning.
Other drivers and restraints analyzed in the detailed report include:
- Multi-Tier Monetization Expands Audience Reach
- Platform Differentiation Through Franchise IP Investment
- Content Cost Inflation Compresses Return on Originals
For complete list of drivers and restraints, kindly check the Table Of Contents.
Segment Analysis
SVOD held 42.48% of revenue in 2025, which kept it as the largest monetization block in the OTT TV series market. That position reflects the lasting value of subscription libraries built around exclusive and recurring series that viewers cannot easily replace elsewhere. Even so, the center of growth has moved because AVOD is projected to expand at 11.40% CAGR during 2026-2031. Ad-supported plans now work as the main entry tier for many users who want premium catalog access without taking on the full subscription price. Gross additions data already points in that direction, with ad-supported tiers accounting for 57% of additions across premium subscription platforms in Q1 2025. The OTT TV series market is therefore becoming less dependent on pure subscription growth than it was in earlier streaming cycles.
The shift does not weaken SVOD. It changes what SVOD is expected to do inside the platform mix. Premium subscription tiers still carry the strongest link to exclusive tentpole series, early access value, and higher average revenue per user. At the same time, AVOD gives operators a larger funnel and helps them monetize households that would otherwise remain outside the paid stack. Digital video ad spending of USD 81.9 billion in the United States in 2026 supports that path and gives the monetization model real headroom. In practical terms, the OTT TV series industry is moving toward layered monetization where SVOD secures the revenue base and AVOD drives wider reach.
Drama captured 27.32% of the OTT TV series market size in 2025, which made it the largest genre in the period under review. Drama remains central because long-form character arcs and season continuity make it one of the strongest tools for retention. Viewers often stay subscribed to follow returning prestige titles, and that keeps drama valuable even when production costs are high. Action and adventure, however, is projected to expand at 11.80% CAGR through 2031, which gives it the strongest growth pace among the listed genres. This growth profile reflects the portability of action-led storytelling across regions because it depends less on language nuance than some comedy formats. In the OTT TV series market, that makes action and adventure a reliable choice for multi-country launches and franchise expansion.
Drama still anchors library depth because it serves both local and global commissioning strategies. European content rules also strengthen this segment because platforms with EU users must keep at least 30% European works in their catalogs. That requirement supports investment in local-language drama and in crime-related scripted formats that can travel within the region. Action and adventure gains from a different advantage because recognizable universes are easier to extend across seasons, spin-offs, and merchandising plans. Reality and lifestyle remains useful in the OTT TV series industry where platforms want a lower-cost category with steady advertiser appeal. The result is a genre mix where drama supports stickiness and action and adventure provides wider cross-border scaling.
Complete Report Scope:
- By Monetization Model
- SVOD
- AVOD
- TVOD
- Hybrid
- Freemium
- By Genre
- Drama
- Comedy
- Action and Adventure
- Crime and Thriller
- Reality and Lifestyle
- Other Genres
- By Device Type
- Smartphones and Tablets
- Smart TVs
- Laptops and Desktops
- Other Device Types
- By Viewer Age Group
- Children/ Teens
- Young Adults/ Seniors
- By Geography
- North America
- United States
- Canada
- Mexico
- South America
- Brazil
- Argentina
- Chile
- Rest of South America
- Europe
- Germany
- United Kingdom
- France
- Italy
- Spain
- Rest of Europe
- Asia-Pacific
- China
- Japan
- India
- South Korea
- Australia
- Rest of Asia-Pacific
- Middle East
- Saudi Arabia
- United Arab Emirates
- Qatar
- Rest of Middle East
- Africa
- South Africa
- Egypt
- Nigeria
- Rest of Africa
- North America
Geography Analysis
North America held 30.34% of global revenue in 2025, which kept it as the largest regional block in the OTT TV series market. The region remains important because it combines high spending per user, mature platform competition, and deep connected television usage. In the United States, 85% of television sets accessed streaming content in Q3 2025, which confirms how deeply series viewing has moved into the streaming environment. The region is also central to monetization innovation because premium subscriptions, ad-supported tiers, and bundle offers all have meaningful scale there. Netflix guided USD 50.7-51.7 billion in revenue for FY2026 and expected advertising revenue of USD 3 billion, which shows how strongly revenue expansion now depends on dual monetization.
Asia-Pacific is projected to expand at 11.45% CAGR during 2026-2031, which makes it the fastest-growing regional area in the OTT TV series market. The region is being lifted by a mix of rising digital access, broader smartphone usage, and strong demand for local-language series. Growth also reflects the fact that many households are still earlier in their streaming adoption cycle than those in North America and Western Europe. Competition in this region is shaped more by domestic relevance than by global brand recognition alone. Platforms that invest in regional language content and pricing flexibility are better positioned to capture new viewers as the OTT TV series market grows across India, Japan, China, and nearby countries.
Europe continues to hold a significant position in the OTT TV series market because paid streaming penetration is already well established in major countries. In France, 74% of households accessed at least one paid streaming service in 2026, which shows a mature and stable demand base. The European framework also favors local commissioning because platforms serving EU users must maintain a minimum 30% share of European works in their catalogs. South America, the Middle East, and Africa remain earlier-stage markets, but they matter because smartphone viewing and broadband access are improving from lower bases. CANAL+ completed its acquisition of MultiChoice in July 2026, which signals continued confidence in Africa as a longer-term expansion field for the OTT TV series market. Across these regions, growth is more likely to come from better local fit and wider access than from premium pricing alone.
- Netflix, Inc.
- The Walt Disney Company
- Warner Bros. Discovery, Inc.
- Amazon.com, Inc.
- Apple Inc.
- Comcast Corporation
- Paramount Skydance Corporation
- Sony Group Corporation
- Tencent Holdings Limited
- iQIYI, Inc.
- Rakuten Group, Inc.
- Zee Entertainment Enterprises Limited
- Roku, Inc.
- JioStar India Private Limited
- PCCW Limited
- MBC Group
- CANAL+ S.A.
- ITV plc
- ProSiebenSat.1 Media SE
- TelevisaUnivision, Inc.
Additional Benefits:
- The market estimate (ME) sheet in Excel format
- 3 months of analyst support
TABLE OF CONTENTS
1 INTRODUCTION
- 1.1 Study Assumptions and Market Definition
- 1.2 Scope of the Study
2 RESEARCH METHODOLOGY
3 EXECUTIVE SUMMARY
4 MARKET LANDSCAPE
- 4.1 Market Overview
- 4.2 Market Drivers
- 4.2.1 Rising Global Appetite for Serialized Original Content
- 4.2.2 Smart TV Penetration and Lean-Back Viewing Shift
- 4.2.3 Multi-Tier Monetization Expands Audience Reach
- 4.2.4 Platform Differentiation Through Franchise IP Investment
- 4.2.5 Local-Language Content Accelerates Subscriber Acquisition
- 4.2.6 AI-Assisted Content Discovery Improves Completion Rates
- 4.3 Market Restraints
- 4.3.1 Subscription Fatigue Across Mature Streaming Markets
- 4.3.2 Content Cost Inflation Compresses Return on Originals
- 4.3.3 Fragmented Rights Ownership Limits Library Reuse
- 4.3.4 Advertising Load Sensitivity Reduces Ad-Supported Monetization Efficiency
- 4.4 Industry Value Chain Analysis
- 4.5 Industry Supply Chain Analysis
- 4.6 Impact of Macroeconomic Factors on the Market
- 4.7 Regulatory Landscape
- 4.8 Technological Outlook
- 4.9 Porter's Five Forces Analysis
- 4.9.1 Bargaining Power of Buyers
- 4.9.2 Bargaining Power of Suppliers
- 4.9.3 Threat of New Entrants
- 4.9.4 Threat of Substitutes
- 4.9.5 Competitive Rivalry
5 MARKET SIZE AND GROWTH FORECASTS (VALUE)
- 5.1 By Monetization Model
- 5.1.1 SVOD
- 5.1.2 AVOD
- 5.1.3 TVOD
- 5.1.4 Hybrid
- 5.1.5 Freemium
- 5.2 By Genre
- 5.2.1 Drama
- 5.2.2 Comedy
- 5.2.3 Action and Adventure
- 5.2.4 Crime and Thriller
- 5.2.5 Reality and Lifestyle
- 5.2.6 Other Genres
- 5.3 By Device Type
- 5.3.1 Smartphones and Tablets
- 5.3.2 Smart TVs
- 5.3.3 Laptops and Desktops
- 5.3.4 Other Device Types
- 5.4 By Viewer Age Group
- 5.4.1 Children/ Teens
- 5.4.2 Young Adults/ Seniors
- 5.5 By Geography
- 5.5.1 North America
- 5.5.1.1 United States
- 5.5.1.2 Canada
- 5.5.1.3 Mexico
- 5.5.2 South America
- 5.5.2.1 Brazil
- 5.5.2.2 Argentina
- 5.5.2.3 Chile
- 5.5.2.4 Rest of South America
- 5.5.3 Europe
- 5.5.3.1 Germany
- 5.5.3.2 United Kingdom
- 5.5.3.3 France
- 5.5.3.4 Italy
- 5.5.3.5 Spain
- 5.5.3.6 Rest of Europe
- 5.5.4 Asia-Pacific
- 5.5.4.1 China
- 5.5.4.2 Japan
- 5.5.4.3 India
- 5.5.4.4 South Korea
- 5.5.4.5 Australia
- 5.5.4.6 Rest of Asia-Pacific
- 5.5.5 Middle East
- 5.5.5.1 Saudi Arabia
- 5.5.5.2 United Arab Emirates
- 5.5.5.3 Qatar
- 5.5.5.4 Rest of Middle East
- 5.5.6 Africa
- 5.5.6.1 South Africa
- 5.5.6.2 Egypt
- 5.5.6.3 Nigeria
- 5.5.6.4 Rest of Africa
- 5.5.1 North America
6 COMPETITIVE LANDSCAPE
- 6.1 Market Concentration
- 6.2 Strategic Moves
- 6.3 Market Share Analysis
- 6.4 Company Profiles (includes Global Level Overview, Market Level Overview, Core Segments, Financials as available, Strategic Information, Market Rank/Share, Products and Services, Recent Developments)
- 6.4.1 Netflix, Inc.
- 6.4.2 The Walt Disney Company
- 6.4.3 Warner Bros. Discovery, Inc.
- 6.4.4 Amazon.com, Inc.
- 6.4.5 Apple Inc.
- 6.4.6 Comcast Corporation
- 6.4.7 Paramount Skydance Corporation
- 6.4.8 Sony Group Corporation
- 6.4.9 Tencent Holdings Limited
- 6.4.10 iQIYI, Inc.
- 6.4.11 Rakuten Group, Inc.
- 6.4.12 Zee Entertainment Enterprises Limited
- 6.4.13 Roku, Inc.
- 6.4.14 JioStar India Private Limited
- 6.4.15 PCCW Limited
- 6.4.16 MBC Group
- 6.4.17 CANAL+ S.A.
- 6.4.18 ITV plc
- 6.4.19 ProSiebenSat.1 Media SE
- 6.4.20 TelevisaUnivision, Inc.
7 MARKET OPPORTUNITIES AND FUTURE OUTLOOK
- 7.1 White-Space and Unmet-Need Assessment


