

|
시장보고서
상품코드
2118256
스마트 TV OTT 스트리밍 시장 : 시장 점유율 분석, 업계 동향 및 통계, 성장 예측(2026-2031년)Smart TV OTT Streaming - Market Share Analysis, Industry Trends & Statistics, Growth Forecasts (2026 - 2031) |
||||||
 Mordor Intelligence
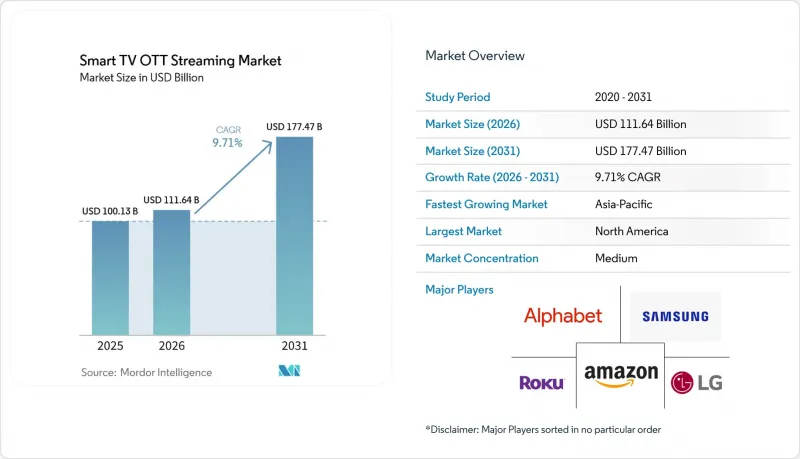
Mordor Intelligence에 의하면, 스마트 TV OTT 스트리밍 시장 규모는 2025년에 1,001억 3,000만 달러로 평가되었고, 2026년 1,116억 4,000만 달러에서 2031년까지 1,774억 7,000만 달러에 이를 것으로 예측되며, 예측 기간(2026-2031년) CAGR은 9.71%를 나타낼 전망입니다.
본 보고서는 스트리밍 유형별(동영상 스트리밍 및 오디오 스트리밍), 수익 모델별(SVOD, TVOD/PPV, AVOD/FAST, 하이브리드 수익화 과금), 광고 형식별(인스트림 동영상, 프로그래매틱 CTV, 브랜드 컨텐츠, 쇼핑 기능 포함/QR), 컨텐츠 유형별(영화, TV 프로그램 및 에피소드형 컨텐츠, 다큐멘터리), 그리고 지역별로 분류되어 있습니다. 시장 예측은 금액(달러) 기준으로 제시되어 있습니다.
세계의 스마트 TV OTT 스트리밍 시장 동향 및 인사이트
고속 광대역 및 가정용 Wi-Fi의 보급
광섬유 구축과 5G 고정 무선 접속은 가정 내 대형 화면 재생 환경을 개선함으로써 스마트 TV OTT 스트리밍 시장의 확산을 뒷받침하고 있습니다. 국제전기통신연합(ITU) 보고서에 따르면, 인터넷 사용자는 전 세계 인구의 대다수를 차지하고 있으며, 5G 가입자 수는 모바일 광대역 연결의 상당 부분을 차지하고 있습니다. 5G 네트워크는 전 세계 인구의 절반 이상을 커버하고 있지만, 접속률은 고소득 국가가 저소득 국가보다 훨씬 높은 수준입니다. 연방통신위원회(FCC)는 2025년 5월, 미국 가정 및 소규모 기업의 96%가 5G 모바일 서비스를 이용할 수 있다고 보고했습니다. 광섬유 및 고정 무선 네트워크에 대한 지속적인 투자는 TV 스트리밍을 장시간 시청하기에 적합한 가정용 연결의 보급을 촉진하고 있습니다. 가정 내 연결 환경이 개선됨에 따라 버퍼링이 줄어들고 스마트 TV 이용 시간이 길어지므로, 플랫폼 사업자가 활용할 수 있는 광고 공간이 확대되고, 중단 없는 재생에 의존하는 서비스에서 스마트 TV 시청 경험이 더욱 안정적으로 제공됩니다.
FAST 채널과 광고 포함 요금제의 보급
FAST 및 광고 지원형 요금제는 스마트 TV OTT 스트리밍 시장의 수익 성장 핵심 요소입니다. Amagi는 광범위한 FAST 채널 배포 실적을 바탕으로, 전 세계 FAST 시청 시간 및 광고 노출 수가 전년 대비 견조하게 증가했다고 보고했습니다. 이 회사의 조사에 따르면, 주요 FAST 사업자 다수가 플랫폼 간 메타데이터 재포맷팅을 큰 운영상의 부담으로 인식하는 한편, 메타데이터의 미비함이 수익 및 컨텐츠 가시성을 저하시키고 있다는 지적도 다수 있었습니다. IAB는 디지털 동영상이 미국 내 TV 및 동영상 광고 지출의 과반수를 차지하는 것이 사상 처음으로 될 것으로 예측했습니다. 또한, 미국 내 커넥티드 TV 광고 지출은 전년 대비 지속적으로 증가할 것으로 전망하고 있습니다. 이러한 상황은 여러 플랫폼에 걸친 컨텐츠 메타데이터 관리, 광고 결정 및 배포를 관리할 수 있는 사업자에게 유리하게 작용합니다. 따라서 스마트 TV의 OTT 스트리밍 시장에서는 효과적인 컨텐츠 관리 시스템을 갖춘 대규모 서비스가 우위를 점하게 될 것입니다.
분산된 TV OS 생태계
OS의 파편화는 스마트 TV OTT 스트리밍 시장의 전송 효율을 제한하고 있습니다. 북미, 유럽, 아시아태평양에서 영향력을 확대하려는 서비스는 앱 스토어, 용도 인터페이스, 광고 도구, 기술 요구 사항이 서로 다른 5-7개의 OS 환경 모두에서 인증을 유지해야 합니다. 이러한 작업으로 인해 수익 분배 의무와 개발 비용이 발생하며, 특히 광범위한 기술 지원 기반을 갖추지 못한 제공업체의 경우 컨텐츠 투자에 할당되는 자금이 감소할 가능성이 있습니다. 유럽의 ‘디지털 시장법(Digital Markets Act)’도 TV OS 제공업체에 대한 정책 수립에 영향을 미치고 있습니다. 유럽의 방송 사업자들은 2026년 3월, 경쟁 당국에 안드로이드 TV, 아마존 파이어 OS, 삼성 타이젠을 잠재적인 게이트키퍼로 평가해 줄 것을 요청했습니다. 이에 따라 용도의 비차별적 배치와 상호 운용성이 요구될 가능성이 있습니다. OS 계층보다 상위 단계에서의 소유권 변경은 소매 기업이나 방송 그룹이 광고 기술 및 커넥티드 TV 플랫폼에 투자함에 따라 새로운 형태의 접근 제어를 초래할 가능성이 있습니다. 이러한 환경 하에서는 OS, 시청자 데이터, 광고 도구, 컨텐츠에 대한 접근을 통합하고 있는 제공업체에게 여전히 유리한 상황이 지속될 것으로 보입니다.
부문 분석
2025년, 스마트 TV의 OTT 스트리밍 시장에서 동영상 스트리밍은 85.22%의 점유율을 차지했습니다. 스마트 TV는 대형 화면에서의 동영상 전송을 염두에 두고 설계되어, 스포츠 생중계, 각본 기반 프로그램, 다큐멘터리 등의 시청에 대응하고 있습니다. 선형 TV에서 스트리밍 서비스로의 프로그램 제공 전환이 진행됨에 따라, 커넥티드 스크린용 동영상 컨텐츠가 더욱 증가하고 있습니다. 또한, 동영상은 가정 내에서 TV를 공유하여 시청하는 정착된 습관으로부터도 혜택을 받고 있습니다. 이러한 상황으로 인해 동영상은 플랫폼 시청 시간의 핵심 원천으로 자리 잡고 있습니다.
오디오 스트리밍은 2031년까지 연평균 성장률(CAGR) 10.11%를 나타낼 것으로 예측됩니다. 스마트 TV는 동영상이 재생되지 않는 시간대에 음악, 팟캐스트, 오디오북을 위한 홈 허브로서의 역할을 점점 더 많이 수행하고 있습니다. 또한, 각 팟캐스트 서비스 업체들도 거실 화면에 적합한 동영상 기반 형식을 개발하여 TV의 오디오 시스템을 더욱 효과적으로 활용하고 있습니다. 오디오는 동일한 가정 내 시청 세션에서 이후 동영상 시청으로 이어지는 계기를 만들어낼 수 있습니다. 하나의 인터페이스 내에서 오디오와 동영상을 통합하고 있는 사업자는 이러한 행동 패턴을 활용하여 포맷을 초월한 참여도를 구축할 수 있습니다.
2025년 기준, 스마트 TV OTT 스트리밍 시장에서 정기 구독형 과금이 45.36%를 차지했습니다. 프리미엄 오리지널 작품, 독점 스포츠 중계권, 광고 없는 시청 환경은 여러 유료 서비스를 관리해야 한다는 소비자의 우려가 커지고 있음에도 불구하고 구독 수요를 뒷받침하고 있습니다. SVOD 플랫폼은 경쟁 서비스에서는 구할 수 없는 컨텐츠를 제공함으로써 가치를 유지할 수 있습니다. 트랜잭션 과금은 신작 프리미엄 영화나 주요 스포츠 생중계와 같이 특정 시기에 집중되는 수요에 대응하고 있습니다. 하이브리드 모델은 구독 주도형과 광고 주도형 접근 방식을 전환하는 서비스를 대상으로 합니다.
AVOD 및 FAST를 포함한 광고 지원형 과금 모델은 2026-2031년 연평균 성장률(CAGR) 10.57%를 나타낼 것으로 예측됩니다. 이는 가격에 민감한 가구의 요구를 충족시키는 동시에, 기존 TV 편성으로는 도달할 수 없는 커넥티드 TV 시청자층에 광고주가 접근할 수 있는 수단을 제공합니다. IAB의 조사에 따르면, 2026년 커넥티드 TV에 대한 추가 투자의 54%는 선형 TV 예산의 재분배를 통해 직접 조달된 것으로 나타났습니다. 통신 사업자의 번들 서비스는 가구 보급률을 높일 수 있지만, 30%에서 45%의 할인이 적용될 경우 번들에 포함된 서비스 1 가입자당 실질 수익이 감소할 가능성이 있습니다. 따라서 AVOD 및 FAST의 스마트 TV OTT 스트리밍 시장 규모는 광고주 수요에 의해 뒷받침되고 있지만, 이익률은 번들 조건에 따라 쉽게 좌우되는 상황이 지속되고 있습니다. 이러한 비즈니스 모델이 성숙해짐에 따라 사업자는 규모, 광고량, 수익 분배, 그리고 시청 경험의 질 간의 균형을 맞추어야 합니다.
지역별 분석
2025년, 북미는 전체 시장의 41.37%를 차지했습니다. 성숙한 광대역 네트워크, 높은 스마트 TV 보급률, 그리고 리니어 TV 예산이 프로그래매틱 커넥티드 TV로 이동한 것이 이 지역의 성장을 뒷받침했습니다. 미국의 커넥티드 TV 광고 지출은 2026년에 293억 달러에 달할 것으로 예상되는 반면, 디지털 비디오에 대한 지출은 2021년 390억 달러에서 2026년에는 819억 달러로 증가할 것으로 전망됩니다. 컴캐스트는 2026년 4월, 이미 Peacock, Netflix, Apple TV를 포함하고 있던 번들 패키지에 Disney+, Hulu, HBO Max를 추가하여 StreamSaver를 확대함으로써, 통신사 주도의 서비스 통합과 스트리밍 서비스 및 가정용 광대역 계약 간의 긴밀한 연계를 강화했습니다. 캐나다와 멕시코도 지역 수요에 기여하고 있으며, 특히 멕시코에서는 유료 TV에서 광고 지원형 서비스로 전환하는 가구들 사이에서 FAST 서비스에 대한 수요가 발생하고 있습니다.
아시아태평양은 2031년까지 연평균 성장률(CAGR) 10.49%를 나타낼 것으로 예측됩니다. 인도에서는 2025년, 크리켓 중계권과 JioHotstar, ZEE5, SonyLIV, Amazon 간의 경쟁에 힘입어 OTT 월간 활성 사용자 수가 14억 5,000만 명을 넘어 3년 만에 20% 증가했습니다. 인도네시아, 태국, 필리핀, 말레이시아, 싱가포르의 유료 스트리밍 계정 수는 전년 대비 19% 증가하여 2025년에는 6,100만 건을 넘어섰습니다. 한편, 베트남과 필리핀에서는 AVOD 및 FAST 중심의 소비를 통해 시장이 발전하고 있습니다. 일본과 한국은 스마트 TV 보급이 진전되고, 현지 컨텐츠 생태계가 확립된 성숙한 시청자층을 보유하고 있습니다. 아시아 비디오 산업 협회(AVIA)는 2025년 아시아태평양의 온라인 동영상 매출을 700억 달러로 예측하고 있으며, 이 중 88%를 중국, 일본, 호주, 한국, 인도가 차지할 것으로 전망됩니다.
유럽은 스마트 TV 보급률이 높은 데다 다국어 컨텐츠에 대한 수요와 상세한 규제가 존재하기 때문에 여전히 중요한 시장입니다. 독일, 영국, 프랑스, 이탈리아, 스페인은 유럽의 5대 시장이며, 이들 시장에서는 무료 디지털 방송 서비스와 공영 방송사의 스트리밍 서비스가 구독형 및 FAST 시청자를 놓고 경쟁하고 있습니다. 남미에서는 2026년에 FAST의 성장률이 가장 높았으며, 시청 시간은 전년 대비 190% 증가, 광고 노출 수는 124% 증가를 기록했습니다. 이는 브라질, 아르헨티나, 칠레의 가격에 민감한 가구들이 주도한 결과입니다. 중동에서는 사우디아라비아와 아랍에미리트(UAE)가 프리미엄 스마트 TV의 보급을 주도하고 있으며, 2026년 7월에는 LG Channels가 UAE에서 한국 엔터테인먼트 컨텐츠 패키지를 출시했습니다. 아프리카는 아직 발전 단계가 초기이지만, 2026년 6월 CANAL+와 삼성은 아프리카 18개국에서 판매되는 신형 삼성 스마트 TV에 ‘DStv Stream’을 사전 설치하기 시작했으며, 유료 TV 인프라가 충분히 갖춰지지 않은 시장에서 스트리밍 서비스로의 직접적인 진입로를 마련했습니다.
기타 혜택 :
- 엑셀 형식 시장 예측(ME) 시트
- 3개월간의 애널리스트 지원
자주 묻는 질문
목차
제1장 서론
제2장 조사 방법
제3장 개요
제4장 시장 구도
제5장 시장 규모 및 성장 예측
제6장 경쟁 구도
제7장 시장 기회 및 향후 전망
AJY 26.09.01According to Mordor Intelligence, the smart TV OTT streaming market size was valued at USD 100.13 billion in 2025 and estimated to grow from USD 111.64 billion in 2026 to reach USD 177.47 billion by 2031, at a CAGR of 9.71% during the forecast period (2026-2031).
This report is Segmented by Streaming Type (Video Streaming, and Audio Streaming), Revenue Model (SVOD, TVOD/PPV, AVOD/FAST and Hybrid Monetization Billing), Advertising Format (In-Stream Video, Programmatic CTV, Branded Content, Shoppable/QR), Content Type (Movies and Films, TV Shows and Episodic Content, and Documentaries), and Geography. The Market Forecasts are Provided in Terms of Value (USD).
Global Smart TV OTT Streaming Market Trends and Insights
High-Speed Broadband and Home Wi-Fi Expansion
Fiber rollout and 5G fixed wireless access support the adoption of the Smart TV OTT streaming market by improving large-screen playback at home. The International Telecommunication Union reported that internet users represent a significant majority of the global population, while 5G subscriptions account for a substantial share of mobile broadband connections. 5G networks cover more than half of the global population, although access remains much higher in high-income economies than in low-income economies. The Federal Communications Commission reported in May 2025 that 96% of U.S. homes and small businesses had access to 5G mobile service. Continued investment in fiber and fixed wireless networks supports the wider availability of household connections suited to sustained television streaming. Better home connections reduce buffering and encourage longer smart TV sessions, which expands the advertising inventory available to platform operators and makes smart television viewing more reliable for services that depend on uninterrupted playback.
FAST Channel and Ad-Supported Tier Proliferation
FAST and ad-supported tiers have become central to revenue growth in the Smart TV OTT streaming market. Amagi reported strong year-over-year growth in global FAST viewing hours and ad impressions, based on a broad base of FAST channel deliveries. Its survey also found that most senior FAST operators viewed reformatting metadata across platforms as a major operational burden, while many said poor metadata reduced revenue or content visibility. The IAB expects digital video to account for a majority share of U.S. television and video advertising spending for the first time. It also expects U.S. connected TV advertising spending to continue growing year over year. These conditions favor operators that can manage content metadata, ad decisioning, and distribution across several platforms. The Smart TV OTT streaming market therefore gives an advantage to scaled services with effective content-management systems.
Fragmented TV Operating-System Ecosystems
Operating-system fragmentation limits distribution efficiency across the Smart TV OTT streaming market. A service seeking reach across North America, Europe, and Asia-Pacific must maintain certification across 5 to 7 operating-system environments with different app stores, application interfaces, advertising tools, and technical requirements. That work creates revenue-sharing obligations and development costs that can reduce the funds available for content investment, especially for providers without a broad technical support base. The European Digital Markets Act also affects the policy setting for television operating-system providers. European broadcasters asked competition authorities in March 2026 to assess Android TV, Amazon Fire OS, and Samsung Tizen as potential gatekeepers, which could lead to requirements for nondiscriminatory application placement and interoperability. Ownership changes above the operating-system layer could add another form of access control, as retail and broadcast groups invest in advertising technology and connected TV platforms. This environment remains more favorable to providers that combine operating systems, audience data, advertising tools, and content access.
Other drivers and restraints analyzed in the detailed report include:
- Bundled Streaming and Telecom Distribution
- Cloud Gaming and Large-Screen Interactive Entertainment
- Privacy, Consent, and Automatic Content Recognition Constraints
For complete list of drivers and restraints, kindly check the Table Of Contents.
Segment Analysis
Video streaming held 85.22% of the Smart TV OTT streaming market in 2025. Smart televisions are designed for large-format video delivery, which supports viewing of live sports, scripted programs, and nonfiction content. The ongoing transfer of programming from linear television to streaming services has added more video inventory to connected screens. Video also benefits from the established use of television sets for shared household viewing. These conditions keep video as the central source of platform viewing hours.
Audio streaming is projected to grow at a 10.11% CAGR through 2031. Smart TVs increasingly serve as home hubs for music, podcasts, and audiobooks during periods when video is not playing. Podcast services are also developing video-based formats that suit a living-room screen and use television audio systems more fully. Audio can create a pathway to later video viewing during the same household session. Operators that aggregate audio and video within one interface can use this behavior to build engagement across formats.
Recurring subscription billing held 45.36% of the Smart TV OTT streaming market in 2025. Premium originals, exclusive sports rights, and ad-free viewing support subscription demand despite wider consumer concern about managing several paid services. SVOD platforms can retain value when they offer content unavailable through competing services. Transactional billing serves time-specific demand for premium film releases and major live sports events. Hybrid models cover services shifting between subscription-led and advertising-led approaches.
Advertising-supported billing, including AVOD and FAST, is projected to grow at a 10.57% CAGR from 2026 to 2031. It responds to price-sensitive households and provides advertisers with a route into connected television audiences that may not be reached through conventional television schedules. The IAB found that 54% of incremental connected TV investment in 2026 came directly from linear television budget reallocation. Telecom bundles can improve household penetration, but discounts of 30% to 45% may reduce effective revenue per subscriber for services included in them, so the Smart TV OTT streaming market size for AVOD and FAST is supported by advertiser demand while margins remain sensitive to bundle terms. Operators must balance scale, ad load, revenue sharing, and the quality of the viewer experience as these models mature.
Complete Report Scope:
- By Streaming Type
- Video Streaming
- Audio Streaming
- By Revenue Model
- Recurring Subscription Billing (SVOD)
- Transactional Billing (TVOD/PPV)
- Advertising-Supported Billing (AVOD/FAST)
- Hybrid Monetization Billing
- By Advertising Format
- In-Stream Video Advertising
- Programmatic CTV Advertising
- Branded Content and Sponsorships
- Shoppable, and QR-Enabled Advertising
- By Content Type
- Movies and Films
- TV Shows and Episodic Content
- Documentaries
- Other Content Types
- By Geography
- North America
- United States
- Canada
- Mexico
- South America
- Brazil
- Argentina
- Chile
- Rest of South America
- Europe
- Germany
- United Kingdom
- France
- Italy
- Spain
- Russia
- Rest of Europe
- Asia-Pacific
- China
- India
- Japan
- South Korea
- Southeast Asia
- Australia and New Zealand
- Rest of Asia-Pacific
- Middle East
- Saudi Arabia
- United Arab Emirates
- Turkey
- Rest of Middle East
- Africa
- South Africa
- Nigeria
- Egypt
- Rest of Africa
- North America
Geography Analysis
North America held 41.37% of the regional total in 2025. Mature broadband networks, high smart TV adoption, and the movement of linear television budgets toward programmatic connected TV supported the region. U.S. connected TV advertising spending is expected to reach USD 29.3 billion in 2026, while digital video spending is projected to rise from USD 39.0 billion in 2021 to USD 81.9 billion in 2026. Comcast expanded StreamSaver in April 2026 by adding Disney+, Hulu, and HBO Max to bundles that already included Peacock, Netflix, and Apple TV, reinforcing telecom-led aggregation and closer links between streaming services and household broadband subscriptions. Canada and Mexico also contribute to regional demand, with Mexico providing room for FAST services among households moving from pay television to ad-supported options.
Asia-Pacific is projected to grow at a 10.49% CAGR through 2031. India had more than 1.45 billion OTT monthly active users in 2025, a 20% increase over 3 years, supported by cricket rights and competition among JioHotstar, ZEE5, SonyLIV, and Amazon. Paid streaming accounts across Indonesia, Thailand, the Philippines, Malaysia, and Singapore rose 19% year over year to exceed 61 million in 2025, while Vietnam and the Philippines are developing through AVOD and FAST-led consumption. Japan and South Korea contribute mature audiences with established smart TV and local-content ecosystems. The Asia Video Industry Association projected online video revenue in Asia-Pacific at USD 70 billion in 2025, with China, Japan, Australia, South Korea, and India generating 88% of that value.
Europe remains important because high smart TV penetration is combined with multilingual content needs and detailed regulation, and Germany, the UK, France, Italy, and Spain are the 5 largest European markets where free-to-air digital services and public broadcaster streaming compete for subscription and FAST viewing. South America recorded the fastest FAST growth in 2026, with viewing hours up 190% year over year and ad impressions up 124%, led by price-sensitive households in Brazil, Argentina, and Chile. Saudi Arabia and the UAE support premium smart TV adoption in the Middle East, and LG Channels launched a Korean entertainment cluster in the UAE in July 2026. Africa is earlier in its development, but CANAL+ and Samsung began pre-installing DStv Stream on new Samsung smart TVs across 18 African countries in June 2026, creating a direct streaming entry point in markets that did not have broad pay-TV infrastructure.
- Samsung Electronics Co., Ltd.
- LG Electronics Inc.
- TCL Technology Group Corporation
- Hisense Visual Technology Co., Ltd.
- Xiaomi Corporation
- Sony Group Corporation
- Roku, Inc.
- Amazon.com, Inc.
- Alphabet Inc.
- Apple Inc.
- VIZIO Holding Corp.
- Comcast Corporation
- Xperi Inc.
- Panasonic Holdings Corporation
- TPV Technology Co., Ltd.
- Skyworth Group Limited
- Haier Smart Home Co., Ltd.
- Sharp Corporation
- Changhong Electric Co., Ltd.
- Tencent Holdings Limited
Additional Benefits:
- The market estimate (ME) sheet in Excel format
- 3 months of analyst support
TABLE OF CONTENTS
1 INTRODUCTION
- 1.1 Study Assumptions and Market Definition
- 1.2 Scope of the Study
2 RESEARCH METHODOLOGY
3 EXECUTIVE SUMMARY
4 MARKET LANDSCAPE
- 4.1 Market Overview
- 4.2 Market Drivers
- 4.2.1 High-Speed Broadband and Home Wi-Fi Expansion
- 4.2.2 FAST Channel and Ad-Supported Tier Proliferation
- 4.2.3 Bundled Streaming and Telecom Distribution
- 4.2.4 Cloud Gaming and Large-Screen Interactive Entertainment
- 4.2.5 Retail-Media Convergence and Shoppable-TV Inventory
- 4.2.6 Household-Level Intent Signals From TV Interface Behavior
- 4.3 Market Restraints
- 4.3.1 Fragmented TV Operating-System Ecosystems
- 4.3.2 Privacy, Consent, and Automatic Content Recognition Constraints
- 4.3.3 Streaming Stick Substitution and Extended TV Replacement Cycles
- 4.3.4 App-Porting Friction From Chipset, Codec, and Remote-Control Variability
- 4.4 Value and Supply-Chain Analysis
- 4.5 Regulatory Landscape
- 4.6 Technological Outlook
- 4.7 Porter's Five Forces Analysis
- 4.7.1 Bargaining Power of Suppliers
- 4.7.2 Bargaining Power of Buyers
- 4.7.3 Threat of New Entrants
- 4.7.4 Threat of Substitutes
- 4.7.5 Competitive Rivalry
5 MARKET SIZE AND GROWTH FORECASTS (VALUE)
- 5.1 By Streaming Type
- 5.1.1 Video Streaming
- 5.1.2 Audio Streaming
- 5.2 By Revenue Model
- 5.2.1 Recurring Subscription Billing (SVOD)
- 5.2.2 Transactional Billing (TVOD/PPV)
- 5.2.3 Advertising-Supported Billing (AVOD/FAST)
- 5.2.4 Hybrid Monetization Billing
- 5.3 By Advertising Format
- 5.3.1 In-Stream Video Advertising
- 5.3.2 Programmatic CTV Advertising
- 5.3.3 Branded Content and Sponsorships
- 5.3.4 Shoppable, and QR-Enabled Advertising
- 5.4 By Content Type
- 5.4.1 Movies and Films
- 5.4.2 TV Shows and Episodic Content
- 5.4.3 Documentaries
- 5.4.4 Other Content Types
- 5.5 By Geography
- 5.5.1 North America
- 5.5.1.1 United States
- 5.5.1.2 Canada
- 5.5.1.3 Mexico
- 5.5.2 South America
- 5.5.2.1 Brazil
- 5.5.2.2 Argentina
- 5.5.2.3 Chile
- 5.5.2.4 Rest of South America
- 5.5.3 Europe
- 5.5.3.1 Germany
- 5.5.3.2 United Kingdom
- 5.5.3.3 France
- 5.5.3.4 Italy
- 5.5.3.5 Spain
- 5.5.3.6 Russia
- 5.5.3.7 Rest of Europe
- 5.5.4 Asia-Pacific
- 5.5.4.1 China
- 5.5.4.2 India
- 5.5.4.3 Japan
- 5.5.4.4 South Korea
- 5.5.4.5 Southeast Asia
- 5.5.4.6 Australia and New Zealand
- 5.5.4.7 Rest of Asia-Pacific
- 5.5.5 Middle East
- 5.5.5.1 Saudi Arabia
- 5.5.5.2 United Arab Emirates
- 5.5.5.3 Turkey
- 5.5.5.4 Rest of Middle East
- 5.5.6 Africa
- 5.5.6.1 South Africa
- 5.5.6.2 Nigeria
- 5.5.6.3 Egypt
- 5.5.6.4 Rest of Africa
- 5.5.1 North America
6 COMPETITIVE LANDSCAPE
- 6.1 Market Concentration
- 6.2 Strategic Moves
- 6.3 Market Share Analysis
- 6.4 Company Profiles (includes Global Level Overview, Market Level Overview, Core Segments, Financials as available, Strategic Information, Market Rank/Share, Products and Services, Recent Developments)
- 6.4.1 Samsung Electronics Co., Ltd.
- 6.4.2 LG Electronics Inc.
- 6.4.3 TCL Technology Group Corporation
- 6.4.4 Hisense Visual Technology Co., Ltd.
- 6.4.5 Xiaomi Corporation
- 6.4.6 Sony Group Corporation
- 6.4.7 Roku, Inc.
- 6.4.8 Amazon.com, Inc.
- 6.4.9 Alphabet Inc.
- 6.4.10 Apple Inc.
- 6.4.11 VIZIO Holding Corp.
- 6.4.12 Comcast Corporation
- 6.4.13 Xperi Inc.
- 6.4.14 Panasonic Holdings Corporation
- 6.4.15 TPV Technology Co., Ltd.
- 6.4.16 Skyworth Group Limited
- 6.4.17 Haier Smart Home Co., Ltd.
- 6.4.18 Sharp Corporation
- 6.4.19 Changhong Electric Co., Ltd.
- 6.4.20 Tencent Holdings Limited
7 MARKET OPPORTUNITIES AND FUTURE OUTLOOK
- 7.1 White-Space and Unmet-Need Assessment


