

|
시장보고서
상품코드
2118972
인산 시장 : 시장 점유율 분석, 업계 동향 및 통계, 성장 예측(2026-2031년)Phosphate - Market Share Analysis, Industry Trends & Statistics, Growth Forecasts (2026 - 2031) |
||||||
 Mordor Intelligence
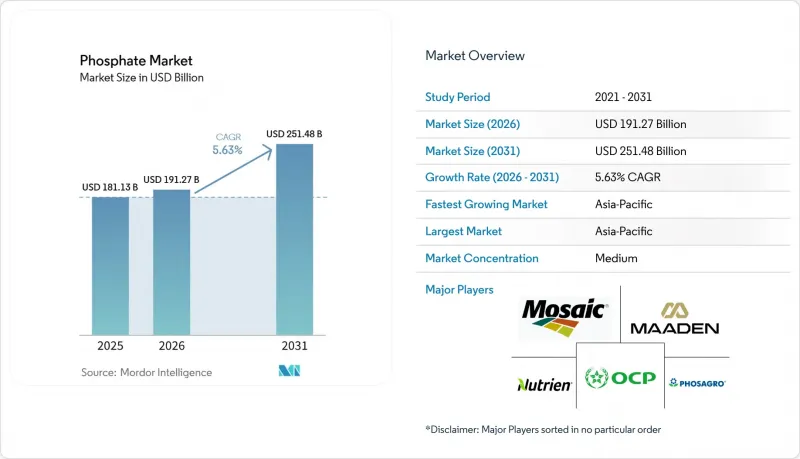
Mordor Intelligence에 의하면, 인산 시장 규모는 2025년에 1,811억 3,000만 달러로 평가되었고, 2026년 1,912억 7,000만 달러에서 2031년까지 2,514억 8,000만 달러로 확대될 것으로 예상되며, 예측 기간(2026-2031년) CAGR은 5.63%로 성장이 전망되고 있습니다.
본 보고서는 제품 유형별(인산암모늄, 인산칼슘 등), 등급별(식품·사료용, 의약품용 등), 최종 사용자 산업별(농약, 식품 및 음료 등), 지역별(아시아태평양, 북미, 유럽, 남미, 중동 및 아프리카)로 분류되어 있습니다. 시장 전망은 금액(달러) 기준으로 제시되어 있습니다.
세계의 인산 시장 동향 및 인사이트
수처리 및 폐수 관리 분야에서 인산 화학물질의 사용 확대
인산계 부식 방지제 및 스케일 억제제는 도시 및 산업용 수처리 시스템에서 여전히 중요한 역할을 하고 있습니다. 배출 기준이 엄격해짐에 따라 각국 정부는 처리 능력 확충을 추진하고 있습니다. 미국과 유럽의 수질 규제 및 화학 물질 관련 규정 준수 요건으로 인해 상수도 유틸리티자들은 처리용 화학 약품 및 회수용 시약의 사용을 촉진하고 있습니다. 또한 하수 처리장에서는 인산 소비에서 서서히 방출되는 비료로 판매 가능한 스트루바이트 회수로의 전환이 진행되고 있습니다. 2026년 연구에 따르면, 스트루바이트 및 스트루바이트-K의 결정화를 통해 세탁 폐수에서 인을 회수할 수 있는 것으로 밝혀져, 회수가 가능한 산업 폐수의 유형가 확대되고 있습니다. 동남아시아 및 사하라 이남 아프리카의 처리 인프라 확충으로 인해, 수처리용 화학약품과 회수용 원료 모두에서 인산 수요가 증가하고 있습니다.
동물 영양 분야의 성장에 힘입은 사료용 인산 수요 증가
사료용 인산 수요는 전 세계 가축 생산 규모와 가금류 및 돼지의 영양 요구 사항을 통해 인산 시장을 지탱하고 있습니다. 육계 사료에는 일반적으로 뼈 발달과 난각 형성을 위해 인이 필요하지만, 돼지의 경우 성장 정점기에 그 필요량이 증가합니다. 사료 공급망에서 순도 기준의 중요성이 점점 더 커지고 있어, 관리된 가공 공정과 적절한 문서화를 수행하는 생산자가 유리해지고 있습니다. PhosAgro사의 보고에 따르면, 2025년 1-9월 동안 동사의 인산계 비료 및 사료용 인산 생산량은 전년 동기 대비 5.5% 증가한 702만 톤에 달했습니다. 이 회사의 장기 개발 계획의 일환으로, 바라코보 공장의 일칼슘인산 현대화 프로그램도 진전되고 있습니다. 또한, 수출 시장을 대상으로 소화율과 추적성 향상을 추구하는 수산 사료 제조업체에서도 인증된 합성 인산이 사용되고 있습니다.
인광석 자원공급 제한과 지리적 집중
인(P)은 대기 중에서 생성될 수 없으며 유한한 광상에 의존하기 때문에 세계 인산 시장은 매장량의 집중, 수출 결정, 그리고 물류 혼란의 영향을 받기 쉬운 상황에 놓여 있습니다. OCP와 중국이 전 세계 인산암 생산량의 대부분을 차지하는 반면, 유럽연합(EU)의 국내 매장량은 제한적입니다. 따라서 수입에 의존하는 비료 제조업체들은 장기 공급 계약에 의지할 수밖에 없으며, 신속한 대체 수단은 거의 없습니다. 미국은 2026년, 원소 인공급을 확보하기 위해 ‘국방생산법’을 발동함으로써, 공급의 신뢰성이 전략적으로 점점 더 중요해지고 있음을 부각시켰습니다. 중국의 수출 규제나 높은 황 함유량으로 인한 비용은 주요 생산 지역 외의 구매자들에게 가용성, 가격 책정, 생산 계획에 추가적인 영향을 미칠 가능성이 있습니다.
부문 분석
2025년, 인산암모늄은 제품 카테고리별 매출의 46.22%를 차지하며 가장 큰 제품 카테고리가 되었습니다. 이러한 위상은 아시아,북미, 남미의 곡물 생산 지역 전반에 걸친 인산이암모늄(DAP) 및 인산이모늄(MAP)에 대한 지속적인 수요를 반영합니다. 인산칼륨은 가장 빠르게 성장하는 제품 유형으로, 2031년까지의 예측 연평균 성장률(CAGR)은 6.47%입니다. 수요는 특수 작물의 영양 관리, 고압 점적 관개를 이용한 원예, 그리고 인과 칼륨의 비율을 엄격하게 관리해야 하는 식품 원료에 집중되어 있습니다. 이러한 용도에는 커피 크리머의 완충 작용이나 비유래 단백질의 안정화 등이 포함됩니다. 2025년, 브라질의 비료 출하량은 4,911만 톤에 달했으며, 인산 제품이 수입 수요의 상당 부분을 차지하고 있어 대규모 농업 시장이 인산암모늄 소비에 중요한 역할을 하고 있음이 부각되고 있습니다.
인산은 비료 용도와 산업용도로 명확하게 분화되고 있습니다. 리튬 철 인산 양극재용 배터리 등급 인산은 2024년 중국 산업용 인산 수요의 약 15%를 차지하고 있으며, 현재 수준에서 연평균 20% 이상의 성장률을 보이고 있습니다. 인산칼슘은 품질 규격이 중요한 의약품의 부형제나 영양 보조제에 사용되고 있습니다. 인산나트륨은 식품 가공, 세제 배합, 보일러 수처리 분야에서 기존 역할을 유지하고 있습니다. 폴리인산 및 전자 등급 시약을 포함한 기타 인산은 반도체 제조 및 특수 산업용 세정에 사용됩니다. 이러한 소규모 용도 분야에서 전문 제조업체에게는 생산량보다 배합의 품질과 고객의 승인이 더 중요한 요소로 작용하고 있습니다.
지역별 분석
2025년 기준, 아시아태평양은 인산 시장의 44.81%를 차지했으며, 2031년까지 연평균 성장률(CAGR) 6.14%를 나타낼 것으로 예측됩니다. 농업의 집약화, 식품 가공 및 배터리 재료에 대한 수요가 이 지역의 인산 소비를 뒷받침하고 있습니다. 중국은 확인 매장량의 5%로 전 세계 인산 생산량의 약 41%를 생산하고 있어, 자원 고갈 및 보존에 대한 우려가 커지고 있습니다. 인도는 여전히 DAP의 주요 수입국이며, 그 보조금 제도가 비료에 대한 활발한 수요를 뒷받침하고 있습니다. CRISIL Ratings는 2026년 2월, 인도의 복합비료 생산 능력이 향후 3개 회계연도 동안 25% 증가할 것으로 전망한다고 발표했습니다. 일본과 한국은 특수 용도 및 의약품 등급 수요를 뒷받침하고 있는 반면, 베트남과 인도네시아는 급성장하는 사료 및 수산 양식 시장을 대표하고 있습니다.
북미와 유럽은 모두 인산 시장에서 중요한 순수입 지역이지만, 그 접근 방식은 다릅니다. 북미에서는 모자이크(Mosaic)와 뉴트리엔(Nutrien)이 지역 인산 생산 능력의 90% 이상을 차지하고 있습니다. 뉴트리엔(Nutrien)은 인산 부문의 향후 방향성을 검토하고 있는 반면, 모자이크(Mosaic)는 2026년 유황 가격 상승에 따라 루이지애나주 및 바토(Bartow) 시설의 생산량을 조정했습니다. 2025년 이후 미국의 정책 조치는 국내 공급의 회복력 강화에 중점을 두고 있습니다. 유럽에서는 탄소 배출 규제 및 규정 준수 요건을 활용하여 수입 비료의 조달처에 영향을 미치려 하고 있습니다. 독일, 프랑스, 이탈리아의 하류 가공업체들은 오랫동안 모로코산 인산에 의존해 온 공급망을 재검토하고 있습니다.
남미, 중동 및 아프리카는 각각 인산 시장에서 고유한 역할을 담당하고 있습니다. 브라질은 주요 수입국입니다. 아르헨티나는 여전히 가격에 민감한 MAP(인산모노암모늄)의 구매국이며, 2025년 전 세계적인 공급 부족 국면에서 사우디아라비아로부터 비료를 수입했습니다. 모로코의 OCP는 비료 생산 능력, 그린 암모니아, 해수 담수화, 재생에너지 인프라에 투자하고 있으며, 2028년까지 900만 톤의 비료 생산 능력을 확충하는 것을 목표로 하고 있습니다. 사우디아라비아의 마아덴(Maaden)은 종합 생산 기업으로 성장을 이어가고 있는 반면, 남아프리카공화국 수요는 식량 안보와 밀접하게 연관되어 있습니다. 앙골라도 카빈다 인산비료 공장 프로젝트를 통해 지역적 공급 능력을 확대되고 있습니다.
기타 혜택 :
- 엑셀 형식 시장 예측(ME) 시트
- 3개월간의 애널리스트 지원
자주 묻는 질문
목차
제1장 서론
제2장 조사 방법
제3장 개요
제4장 시장 구도
제5장 시장 규모 및 성장 예측
제6장 경쟁 구도
제7장 시장 기회 및 향후 전망
AJY 26.09.01According to Mordor Intelligence, the phosphate market size was estimated at USD 181.13 billion in 2025 and is projected to grow from USD 191.27 billion in 2026 to USD 251.48 billion by 2031, at a CAGR of 5.63% over the forecast period (2026-2031).
This report is Segmented by Product Type (Ammonium Phosphate, Calcium Phosphate, and More), Grade (Food and Feed Grade, Pharmaceutical Grade, and More), End-User Industry (Agrochemicals, Food and Beverages, and More), and Geography (Asia-Pacific, North America, Europe, South America, and Middle-East and Africa). The Market Forecasts are Provided in Terms of Value (USD).
Global Phosphate Market Trends and Insights
Increasing Use of Phosphate Chemicals in Water Treatment and Wastewater Management
Phosphate corrosion inhibitors and scale-control compounds remain important in municipal and industrial water systems. Governments are expanding treatment capacity as discharge requirements become more stringent. Water regulations in the United States and Europe, along with chemical compliance requirements, encourage utilities to use treatment chemicals and recovery reagents. Wastewater plants are also shifting from phosphate consumption toward struvite recovery, which can be sold as a slow-release fertilizer. A 2026 study found that struvite and struvite-K crystallization can recover phosphorus from laundry effluent, broadening the range of industrial wastewater streams that can support recovery. Expanding treatment infrastructure in Southeast Asia and sub-Saharan Africa is increasing demand for phosphate in both water-treatment chemicals and recovery inputs.
Rising Demand for Feed-Grade Phosphates Driven by Growth in Animal Nutrition
Feed-grade phosphate demand supports the phosphate market through the scale of global livestock production and the nutritional requirements of poultry and swine. Broiler diets generally require phosphorus for bone development and shell formation, while swine requirements increase during peak growth stages. Purity standards are becoming more important in feed supply chains, favoring producers with controlled processing and documentation. PhosAgro reported that its phosphate-based fertilizer and feed-phosphate production rose 5.5% year over year to 7.02 million tons in the first nine months of 2025. Its Balakovo monocalcium phosphate modernization program was advancing as part of the company's long-term development plan. Certified synthetic phosphate salts are also being used by aquafeed mills seeking improved digestibility and traceability for export markets.
Limited Availability and Geographic Concentration of Phosphate Rock Resources
Phosphorus cannot be produced from the atmosphere and depends on finite mined deposits, making the global phosphate market sensitive to reserve concentration, export decisions, and logistics disruptions. OCP and China account for a large share of global phosphate rock output, while the European Union has limited domestic reserves. Import-dependent fertilizer producers therefore rely on long-term supply arrangements and have few rapid alternatives. The United States invoked the Defense Production Act in 2026 to secure supplies of elemental phosphorus, highlighting the growing strategic importance of supply reliability. China's export restrictions and high sulfur costs can further affect availability, pricing, and production planning for buyers outside major producing regions.
Other drivers and restraints analyzed in the detailed report include:
- Expanding Adoption of Phosphorus Recovery and Recycling Technologies
- Increasing Demand for Sustainable and Low-Carbon Fertilizer Solutions
- Stringent Environmental Regulations Related to Phosphate Emissions and Water Pollution
For complete list of drivers and restraints, kindly check the Table Of Contents.
Segment Analysis
Ammonium phosphate held 46.22% of product-category revenue in 2025, making it the largest product category. This position reflects sustained demand for diammonium phosphate (DAP) and monoammonium phosphate (MAP) across grain-producing regions in Asia, North America, and South America. Potassium phosphate is the fastest-growing product type, with a projected CAGR of 6.47% through 2031. Demand is concentrated in specialty crop nutrition, high-pressure drip-irrigation horticulture, and food ingredients that require controlled phosphorus-to-potassium ratios. These uses include coffee-creamer buffering and non-dairy protein stabilization. Brazil's fertilizer deliveries reached 49.11 million tons in 2025, with phosphate products accounting for a material share of import demand, underscoring the importance of large agricultural markets to ammonium phosphate consumption.
Phosphoric acid is developing into distinct fertilizer and industrial application streams. Battery-grade phosphoric acid for lithium iron phosphate cathodes represented an estimated 15% of China's industrial phosphoric acid demand in 2024, with demand growing at more than 20% annually from its current base. Calcium phosphate is used as a pharmaceutical excipient and in nutraceutical products, where quality specifications are important. Sodium phosphate retains established roles in food processing, detergent formulations, and boiler-water treatment. Other phosphates, including polyphosphates and electronic-grade reagents, serve semiconductor production and specialty industrial cleaning. These smaller applications give specialty producers areas where formulation quality and customer approvals matter more than volume.
Complete Report Scope:
- By Product Type
- Ammonium Phosphate
- Calcium Phosphate
- Phosphoric Acid
- Potassium Phosphate
- Sodium Phosphate
- Other Phosphates
- By Grade
- Food and Feed Grade
- Pharmaceutical Grade
- Industrial Grade
- By End-User Industry
- Agrochemicals
- Food and Beverages
- Animal Feed
- Cleansers and Detergents
- Pharmaceutical and Personal Care
- Water Treatment
- By Geography
- Asia-Pacific
- China
- India
- Japan
- South Korea
- Rest of Asia-Pacific
- North America
- United States
- Canada
- Mexico
- Europe
- Germany
- United Kingdom
- France
- Italy
- Russia
- Rest of Europe
- South America
- Brazil
- Argentina
- Rest of South America
- Middle-East and Africa
- Saudi Arabia
- South Africa
- Rest of Middle-East and Africa
- Asia-Pacific
Geography Analysis
Asia-Pacific accounted for 44.81% of the phosphate market in 2025 and is forecast to grow at a 6.14% CAGR through 2031. Agricultural intensification, food processing, and demand for battery materials support phosphate consumption in the region. China produces an estimated 41% of global phosphate output from 5% of known reserves, raising concerns about resource depletion and conservation. India remains a major DAP importer, and its subsidy system supports large fertilizer demand. CRISIL Ratings stated in February 2026 that India's complex fertilizer capacity is expected to increase by 25% over the next three fiscal years. Japan and South Korea support specialty and pharmaceutical-grade demand, while Vietnam and Indonesia represent growing feed and aquaculture markets.
North America and Europe are both significant net-importing regions in the phosphate market, though their approaches differ. In North America, Mosaic and Nutrien account for more than 90% of regional phosphate production capacity. Nutrien is evaluating options for its phosphate division, while Mosaic adjusted output at its Louisiana and Bartow facilities amid high sulfur costs in 2026. U.S. policy actions since 2025 have focused on domestic supply resilience. Europe is using carbon and compliance requirements to influence the sourcing of imported fertilizers. Downstream processors in Germany, France, and Italy are reviewing supply chains that have long relied on Moroccan phosphate flows.
South America, the Middle-East, and Africa each have distinct roles in the phosphate market. Brazil is a major import destination. Argentina remains a price-sensitive MAP buyer and imported cargoes from Saudi Arabia during tighter global supply conditions in 2025. Morocco's OCP is investing in fertilizer capacity, green ammonia, desalination, and renewable energy infrastructure, aiming to add 9 million tons of fertilizer production capacity by 2028. Saudi Arabia's Maaden is growing as an integrated producer, while South African demand is tied to food security. Angola is also adding regional supply capacity through the Cabinda Phosphate Fertilizer Plant Project.
- Chemische Fabrik Budenheim KG
- EuroChem Group
- Fosfitalia Group
- Guizhou Phosphate Chemical Group
- Hubei Xingfa Chemicals Group Co., Ltd.
- ICL Group Ltd.
- Innophos Holdings, Inc.
- Jordan Phosphate Mines Company (JPMC)
- Maaden
- Mosaic
- Nutrien
- OCP S.A.
- PhosAgro Group
- Prayon SA
- Reciphos SAS
- WENGFU GROUP CO. LTD.
- Yara International ASA
- Yunnan Yuntianhua Co., Ltd.
Additional Benefits:
- The market estimate (ME) sheet in Excel format
- 3 months of analyst support
TABLE OF CONTENTS
1 Introduction
- 1.1 Study Assumptions and Market Definition
- 1.2 Scope of the Study
2 Research Methodology
3 Executive Summary
4 Market Landscape
- 4.1 Market Overview
- 4.2 Market Drivers
- 4.2.1 Increasing Use of Phosphate Chemicals in Water Treatment and Wastewater Management
- 4.2.2 Rising Demand for Feed-Grade Phosphates Driven by Growth in Animal Nutrition
- 4.2.3 Expanding Adoption of Phosphorus Recovery and Recycling Technologies
- 4.2.4 Growing Investments in Integrated Phosphate Mining and Processing Operations
- 4.2.5 Increasing Demand for Sustainable and Low-Carbon Fertilizer Solutions
- 4.3 Market Restraints
- 4.3.1 Limited Availability and Geographic Concentration of Phosphate Rock Resources
- 4.3.2 Stringent Environmental Regulations Related to Phosphate Emissions and Water Pollution
- 4.3.3 Stringent Regulatory and Quality Compliance Requirements for Food, Feed, and Pharmaceutical Grades
- 4.4 Value Chain Analysis
- 4.5 Porter's Five Forces Analysis
- 4.5.1 Threat of New Entrants
- 4.5.2 Bargaining Power of Suppliers
- 4.5.3 Bargaining Power of Buyers
- 4.5.4 Threat of Substitutes
- 4.5.5 Competitive Rivalry
5 Market Size and Growth Forecasts (Value)
- 5.1 By Product Type
- 5.1.1 Ammonium Phosphate
- 5.1.2 Calcium Phosphate
- 5.1.3 Phosphoric Acid
- 5.1.4 Potassium Phosphate
- 5.1.5 Sodium Phosphate
- 5.1.6 Other Phosphates
- 5.2 By Grade
- 5.2.1 Food and Feed Grade
- 5.2.2 Pharmaceutical Grade
- 5.2.3 Industrial Grade
- 5.3 By End-User Industry
- 5.3.1 Agrochemicals
- 5.3.2 Food and Beverages
- 5.3.3 Animal Feed
- 5.3.4 Cleansers and Detergents
- 5.3.5 Pharmaceutical and Personal Care
- 5.3.6 Water Treatment
- 5.4 By Geography
- 5.4.1 Asia-Pacific
- 5.4.1.1 China
- 5.4.1.2 India
- 5.4.1.3 Japan
- 5.4.1.4 South Korea
- 5.4.1.5 Rest of Asia-Pacific
- 5.4.2 North America
- 5.4.2.1 United States
- 5.4.2.2 Canada
- 5.4.2.3 Mexico
- 5.4.3 Europe
- 5.4.3.1 Germany
- 5.4.3.2 United Kingdom
- 5.4.3.3 France
- 5.4.3.4 Italy
- 5.4.3.5 Russia
- 5.4.3.6 Rest of Europe
- 5.4.4 South America
- 5.4.4.1 Brazil
- 5.4.4.2 Argentina
- 5.4.4.3 Rest of South America
- 5.4.5 Middle-East and Africa
- 5.4.5.1 Saudi Arabia
- 5.4.5.2 South Africa
- 5.4.5.3 Rest of Middle-East and Africa
- 5.4.1 Asia-Pacific
6 Competitive Landscape
- 6.1 Market Concentration
- 6.2 Strategic Moves
- 6.3 Market Share (%)/Ranking Analysis
- 6.4 Company Profiles (includes Global Overview, Market Overview, Core Segments, Financials as available, Strategic Information, Products and Services, and Recent Developments)
- 6.4.1 Chemische Fabrik Budenheim KG
- 6.4.2 EuroChem Group
- 6.4.3 Fosfitalia Group
- 6.4.4 Guizhou Phosphate Chemical Group
- 6.4.5 Hubei Xingfa Chemicals Group Co., Ltd.
- 6.4.6 ICL Group Ltd.
- 6.4.7 Innophos Holdings, Inc.
- 6.4.8 Jordan Phosphate Mines Company (JPMC)
- 6.4.9 Maaden
- 6.4.10 Mosaic
- 6.4.11 Nutrien
- 6.4.12 OCP S.A.
- 6.4.13 PhosAgro Group
- 6.4.14 Prayon SA
- 6.4.15 Reciphos SAS
- 6.4.16 WENGFU GROUP CO. LTD.
- 6.4.17 Yara International ASA
- 6.4.18 Yunnan Yuntianhua Co., Ltd.
7 Market Opportunities and Future Outlook
- 7.1 White-Space and Unmet-Need Assessment


