

|
시장보고서
상품코드
2119115
영국의 OTT 시장 : 시장 점유율 분석, 업계 동향 및 통계, 성장 예측(2026-2031년)United Kingdom OTT - Market Share Analysis, Industry Trends & Statistics, Growth Forecasts (2026 - 2031) |
||||||
 Mordor Intelligence
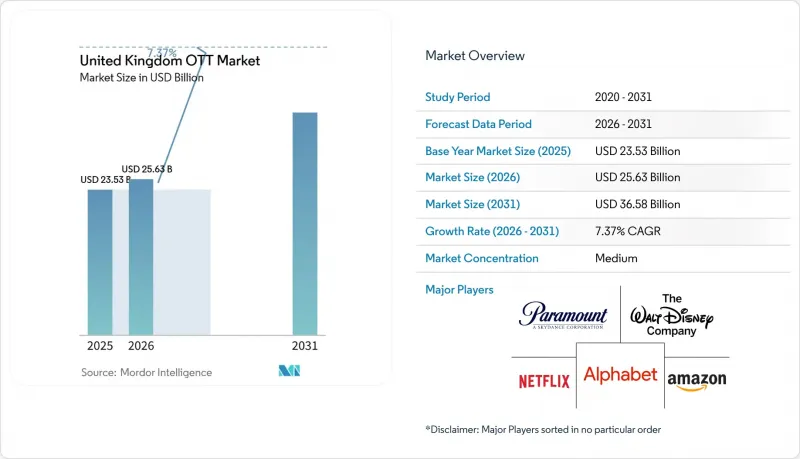
Mordor Intelligence에 의하면, 영국의 OTT 시장 규모는 2025년 235억 3,000만 달러로 평가되었고, 2026년에는 256억 3,000만 달러로 추정되고, 2026-2031년 CAGR 7.37%로 성장을 지속할 전망이며, 2031년에는 365억 8,000만 달러에 이를 것으로 예측됩니다.
본 보고서는 수익 모델별(SVOD, AVOD, TVOD, 하이브리드, 구독 및 광고), 기기 유형별(스마트폰 및 태블릿, 스마트 TV 등), 컨텐츠 장르별(영화, TV 프로그램 및 에피소드형 컨텐츠, 다큐멘터리)로 분류되어 있습니다. 시장 예측은 금액(달러) 기준으로 제시되어 있습니다.
영국의 OTT 시장 동향 및 인사이트
선형 TV에서 온디맨드 시청으로의 현저한 전환
1인당 1일 라이브 TV 시청 시간은 전년 대비 감소했습니다. 또한, 같은 기간 동안 라이브 또는 녹화된 TV 방송의 주간 도달률도 감소했습니다. 이러한 변화는 고령 시청자를 포함한 모든 연령대에 걸쳐 나타나고 있으며, 이러한 전환이 단순히 젊은 시청자가 고령 시청자를 대체하는 현상에 그치지 않음을 보여줍니다. 방송사가 제공하는 비디오 온 디맨드(VOD) 서비스는 주간 도달률과 이용 시간 증가에 힘입어 이러한 추세를 부분적으로 상쇄했습니다. 또한, 영국의 OTT 시장에서는 가정 내 동영상 시청 총 시간이 감소함에 따라 시청 시간 확보를 위한 경쟁도 벌어지고 있습니다. Ofcom의 ‘프로미넌스 프레임워크(Prominence Framework)’는 공영 방송사의 용도이 스마트 TV 인터페이스에서 쉽게 찾을 수 있는 상태를 유지하도록 의무화함으로써 국내 서비스를 지원하고 있습니다. 이를 통해 기기의 홈 화면에 전 세계 스트리밍 용도이 표시되더라도 시청자가 해당 서비스에 접근할 수 있도록 보장하고 있습니다.
주요 OTT 플랫폼에서의 광고 포함 요금제 확산
넷플릭스의 광고 포함 요금제는 이전보다 더 높은 점유율을 차지하게 되어, 영국 가입자의 상당 부분을 차지하게 되었습니다. 디즈니+의 해당 요금제 점유율도 증가한 반면, 아마존 프라임 비디오의 광고 포함 옵션은 영국 가입자 기반의 대부분을 차지하고 있습니다. 따라서, 특히 가구 보급률이 획득 주도형 성장을 제한하고 있는 상황에서 영국의 OTT 시장은 총 가입자 수뿐만 아니라 광고 수익, 시청자 타겟팅, 그리고 퍼스트파티 데이터에 대한 접근을 통해 점점 더 형성되고 있습니다. 각 플랫폼은 광고가 포함된 저가 요금제를 제공함으로써 가격에 민감한 시청자를 자사 생태계에 묶어두는 동시에, 기타 가구에게는 고가의 광고 없는 요금제를 유지할 수 있습니다. 넷플릭스 보고서에 따르면, 광고가 포함된 요금제가 제공되는 지역에서는 신규 가입자의 과반수가 프리미엄 요금제가 아닌 이 옵션을 선택했습니다. 이러한 추세는 영국에서 광고 포함 모델이 이미 높은 보급률을 보이고 있음에도 불구하고 여전히 발전의 여지가 있음을 시사하는 한편, 광고 슬롯의 품질과 광고주 수요가 중요함을 부각시키고 있습니다.
여러 서비스를 구독하는 가구의 ‘구독 피로감’
영국의 많은 가구는 여러 서비스를 이용하고 있으며, 주요 작품이 서로 다른 시기에 공개될 경우 매월 구독을 해지하고 재가입하는 것이 지출을 관리하기 위한 현실적인 수단이 되고 있습니다. BBC iPlayer, ITVX, Channel 4 Streaming 등 무료 국내 서비스들이 직접적인 구독료 없이 정평이 난 현지 프로그램을 제공하고 있기 때문에 영국의 OTT 시장은 이러한 행동의 영향을 받기 쉬운 상황에 놓여 있습니다. 유료 서비스를 순환식으로 이용하는 가구는 여전히 컨텐츠를 중요하게 생각할지 모르지만, 이러한 가입 현황의 변화로 인해 플랫폼의 수익 예측이 어려워지고, 프로모션을 통한 신규 고객 확보의 가치도 떨어지고 있습니다. 방송사의 주문형 비디오(VOD) 시청은 증가하고 있으며, 광고 수익으로 운영되는 무료 대체 서비스의 중요성이 부각되고 있습니다. 따라서 플랫폼 측은 주요 신작 출시나 스포츠 이벤트가 없는 기간에도, 프로그램 편성, 요금제 선택지, 혹은 유익한 번들 등을 통해 시청자가 유료 서비스를 계속 이용할 명확한 이유를 제시해야 합니다. 번들이나 차별화된 컨텐츠는 이러한 압박을 완화할 수 있지만, 가구가 비용을 관리해야 하는 근본적인 필요성을 없애지는 못합니다.
부문 분석
2025년, SVOD는 영국 유료 스트리밍 수익의 58.44%를 차지했으며, 넷플릭스, 아마존 프라임 비디오, 디즈니+, 디스커버리+가 이를 뒷받침했습니다. 2026년 1분기, 넷플릭스는 영국 가구의 61%에서 이용되고 있어, 아마존 프라임 비디오(46.1%)와 디즈니+(26.1%)를 앞질렀습니다. 이 서비스들은 영국 SVOD 수익의 80%를 차지했으며, 이는 각사의 컨텐츠 투자, 확고한 사용자 기반, 그리고 일반 가정에서의 높은 인지도를 반영합니다. 또한, 초기부터 사업을 확장해 온 덕분에 성숙한 가정용 구독 시장에서 더욱 견고한 입지를 다지고 있습니다. 영국 OTT 시장은 가입자 수가 이미 높은 수준에 도달했기 때문에 매출 성장은 신규 가구 가입보다는 가격 인상, 프리미엄 요금제, 번들 요금제에 더 크게 의존하는 경향이 강해질 것으로 예측됩니다.
하이브리드형(구독과 광고 병행) 모델은 2026-2031년 연평균 성장률(CAGR) 7.96%를 나타낼 것으로 예측됩니다. 광고 포함 요금제는 광고 없는 요금제에 요금을 지불하고 싶지 않은 고객을 유지하기 위한 수단이 됩니다. 또한, 국내 방송사의 서비스도 2025년에 온디맨드 시청을 9% 확대하며, 광고 수익형 동영상의 입지를 더욱 공고히 했습니다. TVOD는 신작이나 조기 디지털 스트리밍을 원하는 시청자에게 계속해서 서비스를 제공하고 있는 반면, 라쿠텐 TV 등의 서비스는 광고 주도형과 유료형 양쪽 형식으로 운영되고 있습니다. MUBI는 아트하우스 영화와 독립 영화 분야에서 구독형과 과금형 두 가지 시청 형태 모두에서 독보적인 입지를 확립했으며, 엄선된 작품 라인업과 독자적인 공개 전략을 통해 대규모 대중 오락 서비스와는 차별화된 위치를 차지하고 있습니다.
기타 혜택 :
- 엑셀 형식 시장 예측(ME) 시트
- 3개월간의 애널리스트 지원
자주 묻는 질문
목차
제1장 서론
제2장 조사 방법
제3장 주요 요약
제4장 시장 구도
제5장 시장 규모 및 성장 예측
제6장 경쟁 구도
제7장 시장 기회 및 향후 전망
AJY 26.09.03According to Mordor Intelligence, the United Kingdom OTT market size is expected to grow from USD 23.53 billion in 2025 to USD 25.63 billion in 2026 and is forecast to reach USD 36.58 billion by 2031 at 7.37% CAGR over 2026-2031.
This report is Segmented by Revenue Model (SVOD, AVOD, TVOD, and Hybrid, Subscription and Ads), Device Types (Smartphones and Tablets, Smart TVs, and More), Content Genre (Movies and Films, TV Shows and Episodic Content, and Documentaries). The Market Forecasts are Provided in Terms of Value (USD).
United Kingdom OTT Market Trends and Insights
Strong Transition From Linear TV to On-Demand Viewing
Live television viewing declined on a per-person, per-day basis compared with the previous year. Weekly reach for live or recorded broadcast television also declined over the period. The change extended across age groups, including older viewers, which shows that the shift is broader than younger viewers replacing older ones. Broadcaster video-on-demand services partly absorbed this movement, as weekly reach and time spent on these services increased. The United Kingdom OTT market also faces competition for viewing time because total in-home video viewing has declined. Ofcom's prominence framework supports domestic services by requiring public service broadcaster applications to remain easy to find on smart television interfaces, which preserves their access to viewers when device home screens also feature global streaming applications.
Rising Adoption of Ad-Supported Tiers Across Major OTT Platforms
Netflix's ad-supported plan reached a substantial share of its UK subscribers, compared with a lower share previously. Disney+'s corresponding share also increased, while Amazon Prime Video's ad-supported option accounted for most of its UK subscriber base. The United Kingdom OTT market is therefore increasingly shaped by advertising yield, audience targeting, and access to first-party data rather than subscriber totals alone, especially as household penetration limits acquisition-led growth. Platforms can keep price-sensitive viewers in their ecosystems by offering a lower-priced plan with advertising while retaining a higher-priced ad-free option for other households.Netflix reported that a majority of new subscribers in territories with an ad plan chose that option instead of a premium plan. This pattern indicates that the ad-supported model still has room to develop in the UK despite already high adoption, but it also raises the importance of inventory quality and advertiser demand.
Subscription Fatigue Among Multi-Service Households
Many UK households hold several services, which makes monthly cancellation and rejoining a practical way to control spending when major titles are released at different times. The United Kingdom OTT market is exposed to this behavior because free domestic services, including BBC iPlayer, ITVX, and Channel 4 Streaming, provide established local programming without a direct subscription charge. Households that rotate paid services may still value the content, but their changing subscriptions make platform revenue less predictable and reduce the value of promotional acquisition. Broadcaster video-on-demand viewing grew, showing the relevance of free, ad-funded alternatives. Platforms must therefore give viewers clear reasons to maintain a paid service between major releases or sports events, whether through programming, plan choice, or a useful bundle. Bundles and differentiated content can reduce this pressure, but they do not remove the basic need for households to manage costs.
Other drivers and restraints analyzed in the detailed report include:
- Growth of Connected TV and Big-Screen Streaming Consumption
- Premium Sports and Local Content Rights Supporting Subscriber Retention
- Intensifying Price Sensitivity and Tier Downgrades
For complete list of drivers and restraints, kindly check the Table Of Contents.
Segment Analysis
SVOD accounted for 58.44% of UK paid streaming revenue in 2025, supported by Netflix, Amazon Prime Video, Disney+, and Discovery+. Netflix was present in 61% of UK households in Q1 2026, compared with 46.1% for Amazon Prime Video and 26.1% for Disney+. These services accounted for 80% of UK SVOD revenue, reflecting their content investment, established user bases, and household familiarity, and their earlier expansion also gave them a stronger position in a mature household-subscription market. The United Kingdom OTT market has reached a high level of subscriptions, so revenue growth is expected to rely more on price increases, premium plans, and bundles than on new household adoption.
The hybrid subscription-and-ads model is projected to grow at a 7.96% CAGR from 2026 to 2031. Ad-supported plans provide a route for services to retain customers who do not want to pay for an ad-free tier. Domestic broadcaster services also expanded their on-demand viewing by 9% in 2025, reinforcing the role of ad-funded video. TVOD continues to serve viewers seeking new releases and early digital viewing windows, while services such as Rakuten TV operate across advertising and transaction-led formats. MUBI maintains a distinct position across subscription and transaction-led viewing for art-house and independent cinema, where a focused catalog and distinct release strategy separate it from larger general entertainment services.
Complete Report Scope:
- By Revenue Model
- SVOD
- AVOD
- TVOD
- Hybrid, Subscription and Ads
- By Device Type
- Smartphones and Tablets
- Smart TVs
- Laptops and Desktops
- Other Device Types
- By Content Genre
- Movies and Films
- TV Shows and Episodic Content
- Documentaries
- Other Content Genres
List of Companies Covered in this Report:
- Netflix, Inc.
- Amazon.com, Inc.
- The Walt Disney Company
- Alphabet Inc.
- British Broadcasting Corporation
- ITV plc
- Comcast Corporation
- Channel Four Television Corporation
- Paramount, a Skydance Corporation
- Warner Bros. Discovery, Inc.
- Apple Inc.
- DAZN Group Limited
- Rakuten Group, Inc.
- Fox Corporation
- Everyone TV Limited
- STV Group plc
- Sony Group Corporation
- Samsung Electronics Co., Ltd.
- MUBI, Inc.
- Plex, Inc.
Additional Benefits:
- The market estimate (ME) sheet in Excel format
- 3 months of analyst support
TABLE OF CONTENTS
1 INTRODUCTION
- 1.1 Study Assumptions and Market Definition
- 1.2 Scope of the Study
2 RESEARCH METHODOLOGY
3 EXECUTIVE SUMMARY
4 MARKET LANDSCAPE
- 4.1 Market Overview
- 4.2 Market Drivers
- 4.2.1 Rising Adoption of Ad-Supported Tiers Across Major OTT Platforms
- 4.2.2 Strong Transition From Linear TV to On-Demand Viewing
- 4.2.3 Growth of Connected TV and Big-Screen Streaming Consumption
- 4.2.4 Premium Sports and Local Content Rights Supporting Subscriber Retention
- 4.2.5 Subscription Bundling and Hybrid Monetization Expanding Addressable Revenue
- 4.2.6 Platform-Level Personalization and Recommendation Engines Increasing Watch Time
- 4.3 Market Restraints
- 4.3.1 Subscription Fatigue Among Multi-Service Households
- 4.3.2 Intensifying Price Sensitivity and Tier Downgrades
- 4.3.3 Fragmented Rights Landscape Increasing Content Acquisition Costs
- 4.3.4 Regulatory Scrutiny on Children's Safety, Advertising, and Data Use
- 4.4 Industry Value Chain Analysis
- 4.5 Regulatory Landscape
- 4.6 Technological Outlook
- 4.7 Porter's Five Forces Analysis
- 4.7.1 Bargaining Power of Buyers
- 4.7.2 Bargaining Power of Suppliers
- 4.7.3 Threat of New Entrants
- 4.7.4 Threat of Substitutes
- 4.7.5 Industry Rivalry
- 4.8 Impact of Macroeconomic Factors on the Market
5 MARKET SIZE AND GROWTH FORECASTS
- 5.1 By Revenue Model
- 5.1.1 SVOD
- 5.1.2 AVOD
- 5.1.3 TVOD
- 5.1.4 Hybrid, Subscription and Ads
- 5.2 By Device Type
- 5.2.1 Smartphones and Tablets
- 5.2.2 Smart TVs
- 5.2.3 Laptops and Desktops
- 5.2.4 Other Device Types
- 5.3 By Content Genre
- 5.3.1 Movies and Films
- 5.3.2 TV Shows and Episodic Content
- 5.3.3 Documentaries
- 5.3.4 Other Content Genres
6 COMPETITIVE LANDSCAPE
- 6.1 Market Concentration
- 6.2 Strategic Moves
- 6.3 Vendor Positioning Analysis
- 6.4 Company Profiles (includes Global Level Overview, Market Level Overview, Core Segments, Financials as available, Strategic Information, Market Rank/Share, Products and Services, Recent Developments)
- 6.4.1 Netflix, Inc.
- 6.4.2 Amazon.com, Inc.
- 6.4.3 The Walt Disney Company
- 6.4.4 Alphabet Inc.
- 6.4.5 British Broadcasting Corporation
- 6.4.6 ITV plc
- 6.4.7 Comcast Corporation
- 6.4.8 Channel Four Television Corporation
- 6.4.9 Paramount, a Skydance Corporation
- 6.4.10 Warner Bros. Discovery, Inc.
- 6.4.11 Apple Inc.
- 6.4.12 DAZN Group Limited
- 6.4.13 Rakuten Group, Inc.
- 6.4.14 Fox Corporation
- 6.4.15 Everyone TV Limited
- 6.4.16 STV Group plc
- 6.4.17 Sony Group Corporation
- 6.4.18 Samsung Electronics Co., Ltd.
- 6.4.19 MUBI, Inc.
- 6.4.20 Plex, Inc.
7 MARKET OPPORTUNITIES AND FUTURE OUTLOOK
- 7.1 White-Space and Unmet-Need Assessment


