

|
시장보고서
상품코드
2119377
바이오 기반 탄소 충전재 : 시장 점유율 분석, 업계 동향 및 통계, 성장 예측(2026-2031년)Bio-Based Carbon Fillers - Market Share Analysis, Industry Trends & Statistics, Growth Forecasts (2026 - 2031) |
||||||
 Mordor Intelligence
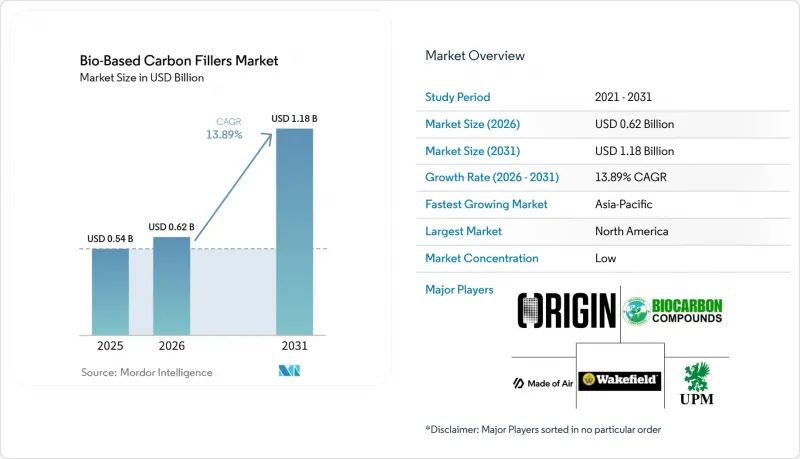
Mordor Intelligence에 의하면, 바이오 기반 탄소 충전재 시장은 2025년에 5억 4,000만 달러 규모였지만, 2026년에는 6억 2,000만 달러에 달하고, 2031년까지 11억 8,000만 달러에 이를 것으로 예측됩니다.
예측 기간(2026-2031년) 동안 연평균 성장률(CAGR)은 13.89%를 나타낼 것으로 전망됩니다.
본 보고서는 제품 유형(바이오숯, 바이오 카본블랙 등), 원료(목재 바이오매스, 농업 잔여물, 리그닌 및 펄프 잔여물 등), 용도(폴리머 컴파운드, 고무 컴파운드 및 타이어 소재 등), 지역(아시아태평양, 북미, 유럽, 남미, 중동 및 아프리카)별로 분류되어 있습니다. 시장 예측은 금액(달러) 기준으로 제시되어 있습니다.
세계의 바이오 기반 탄소 충전재 시장 동향 및 인사이트력
기업의 스코프 3 및 제품의 탄소 발자국에 관한 요건
스코프 3 배출량 공개 의무는 여러 산업 분야의 자재 조달에서 중요한 요소로 자리 잡고 있습니다. 지침(EU) 2026/470은 대상 기업에 대한 스코프 3 온실가스 공개 요건을 유지하면서도, 의무화되는 데이터 항목의 총 수를 61% 줄였습니다. 이전에 비재무 보고 지침의 적용 대상이었던 ‘1차 대상’ 기업들은 2026년 데이터에 대해 보고를 진행하고 있습니다. 캘리포니아주 상원 법안 253호에서는 2027년부터 스코프 3 보고가 의무화되어, 해당 주에서 사업을 영위하는 대기업의 보고 부담이 증가하고 있습니다. 검증을 거친 바이오 탄소 충전재는 배출량이 많은 원자재의 대체재로 사용될 경우, 구매자의 카테고리 1(구매 품목 및 서비스) 재고를 줄일 수 있습니다. 이러한 변화로 인해 유럽 바이오숯 인증(EBC), 국제 바이오숯 이니셔티브(International Biochar Initiative) 및 ASTM D6866에 기반한 인증은 단순한 마케팅 주장을 넘어 구매 요건이 되었습니다.
지속 가능한 바이오숯 저장을 위한 탄소 제거 오프테이크 수요
장기적인 탄소 제거 계약을 통해, 본래라면 산업용 충전재 구매자가 이용할 수 있었을 바이오숯공급량이 확보되고 있습니다. 2025년 1월, 마이크로소프트는 엑소매드 그린(Exomad Green)과 최소 124만 미터톤의 이산화탄소 제거를 내용으로 하는 10년 계약을 체결했습니다. 2026년 4월, 엑소매드 그린(Exomad Green)과 슈퍼크리티컬(Supercritical)은 최대 50만 메트릭톤의 지속 가능한 탄소 제거에 관한 3년 계약을 체결하여, 이를 통해 엑소매드 그린의 2026년 재고 전량을 확보했습니다. 이 계약으로 인해 인증된 바이오숯에 대한 탄소 크레딧 수요와 충전재 등급 수요 간의 경쟁이 더욱 심화되었습니다. 또한, 이 계약은 생산자에게 계약에 따른 수익을 가져다주며, 새로운 열분해 프로젝트 및 원료 개발을 지원하는 결과로 이어집니다. 충분한 규모를 갖춘 바이오 탄소 충전재 시장 진출기업들은 두 가지 최종 용도 모두를 충족시키면서 단일 수익원에 대한 의존도를 낮출 수 있습니다.
원료의 편차와 불순물 관리의 부담
이용 가능한 바이오매스 원료의 범위가 넓다는 것은 공급 선택지를 넓혀주지만, 로트 간 조성이나 오염 물질 프로파일에 편차가 발생합니다. 유럽 바이오숯 인증 기준(European Biochar Certificate Standard) 버전 10.5E에서는 농업용 등급의 바이오숯에 대해 플라스틱 및 고무의 혼입을 질량비 1% 이내로 제한하고 있습니다. Carbon Standards International의 서면 승인이 있는 경우, EBC-Material 용도에서는 이 상한선을 10%까지 높일 수 있습니다. 또한, 이 규격에서는 의약품이나 미코톡신을 포함한 유기 미량 오염 물질을 분해하기 위해 최소 500°C에서 10분 이상 열분해를 수행해야 합니다. 카드뮴, 납, 비소 등의 중금속 함량은 원료 공급원이나 과거 농약 사용 상황에 따라 변동될 가능성이 있습니다. International Biochar Initiative(IBI) 버전 2.0 프로토콜에서는 원료 조성이 혼합 비율 기준으로 20% 이상 변동할 경우 재검사를 의무화하고 있습니다. 이러한 조치는 운영상의 복잡성을 가중시켜 바이오 기반 탄소 충전재 시장의 보급을 지연시킬 가능성이 있습니다.
부문 분석
2025년에는 바이오숯이 제품 유형별 매출의 48.56%를 차지했으나, 바이오 카본블랙은 2031년까지 연평균 성장률(CAGR) 16.68%로 확대될 것으로 예측됩니다. 바이오숯의 입지는 목재 잔여물, 농업 부산물 및 혼합 유기물 스트림을 활용할 수 있는 확립된 운영 체계를 반영한 것입니다. 광범위한 원료 기반 덕분에 다른 특수한 바이오 카본 등급이 널리 사용되기 전부터 상업적 규모의 생산이 가능했습니다. 바이오 카본블랙은 안료의 대체재로 활용될 수 있어 포장, 코팅, 잉크 분야에서 수요가 증가하고 있습니다. 2025년 12월, UPM은 재생 가능한 리그닌을 원료로 하여, 바이오이며 근적외선으로 감지 가능하고 탄소 음성인 흑색 안료 ‘Circular Renewable Black’을 출시했습니다. 이 제품은 국제 지속가능성 탄소 인증 플러스(ISCC+), 산림관리협의회(FSC), 산림인증제도 승인 프로그램(POFC)의 각 기준에 따른 인증을 획득했습니다.
바이오차을 활용한 바이오 기반 탄소 충전재 시장 규모는 기존 시스템에서 여러 바이오매스 원료로 제조할 수 있기 때문에 계속해서 우위를 유지했습니다. 기존 카본블랙을 사용하면 재활용 시설의 근적외선 선별 시스템에서 검은색 플라스틱 포장재를 감지하기 어려울 수 있습니다. UPM의 소재는 근적외선 선별 성능이 필요한 포장 시스템에서 이러한 과제를 해결합니다. 활성 바이오차는 에너지 저장용 전극이나 여과재로 이용되고 있으며, 그 높은 비표면적과 흡착 특성 덕분에 높은 가격 책정이 가능합니다. 특수한 흑연계 바이오차의 경우, 전도성 폴리머나 특수 복합재료 분야에서 여전히 상용화의 초기 단계에 있습니다. 바이오숯의 비표면적은 보통 50-300 m2/g 범위인 반면, 용광로 방식 카본블랙은 150-1,500 m2/g입니다. 이러한 차이로 인해 고성능 고무에서 완전한 대체는 어렵지만, 활성화 처리나 표면 개질을 통해 부분적인 대체는 가능합니다.
지역별 분석
2025년, 북미는 바이오 기반 탄소 충전재 시장 점유율의 36.40%를 차지했습니다. 이 지역은 산업 규모의 열분해 인프라, 공급망의 배출량 감축 목표를 준수하는 기업 구매자, 그리고 미국 중서부 및 온타리오주에 위치한 폴리머 및 고무 컴파운드 제조업체와의 지리적 근접성을 갖추고 있습니다. 퀘벡주 포트 카르티에에 위치한 Carbonity사는 2025년 5월, 캐나다 최초의 산업 규모 바이오숯 플랜트이자 북미 최대 규모의 플랜트로 가동을 시작했습니다. 이 플랜트는 당초 연간 1만 메트릭톤의 생산 능력으로 가동을 시작했으며, 2026년 말까지 연간 3만 메트릭톤으로 확대하는 것을 목표로 하고 있습니다. 이 프로젝트에서는 산림관리협의회(FSC) 인증을 받은 목질 잔여물을 사용하여, 임업 지역에서 재현 가능한 추적 가능성을 갖춘 원료 모델을 실현하고 있습니다. 2027년부터 시행되는 캘리포니아주의 스코프 3 보고 요건에 따라, 해당 지역 전체에서 배출 감축 효과가 입증된 제품의 구매가 더욱 촉진될 것으로 예측됩니다.
아시아태평양은 2031년까지 연평균 성장률(CAGR) 16.11%로 확대될 것으로 예측됩니다. 이 지역의 타이어 및 고무 제조거점을 고려할 때, 재생 가능 충전재에 대한 대체 수요는 비록 소규모일지라도 잠재적 수요가 있을 것으로 전망됩니다. 중국과 인도는 타이어 및 산업용 고무 생산에 사용되는 카본블랙 소비의 주요 지역 공급원입니다. 2026년 1월, 마이크로소프트는 발라하(Varaha)사와 2029년까지 3년 동안 10만 메트릭톤 이상의 이산화탄소 제거 크레딧을 구매하는 계약을 체결했습니다. 이 계약은 마하라슈트라주에서 산업용 열분해의 규모 확대를 지원할 뿐만 아니라, 바이오숯 프로젝트의 생산 및 자금 조달의 확실성을 높입니다. 일본 경제산업성이 정한 소비재 접촉 용도에 관한 인증 요건과 한국의 특수 폴리머 컴파운드 시장은 인증을 받았으며 다환 방향족 탄화수소(PAH) 함량이 낮은 충전재 등급에 대한 수요를 뒷받침하고 있습니다.
유럽 수요 동향은 내재된 탄소(embodied carbon) 보고, 다환 방향족 탄화수소(PAH) 규제, 그리고 포장재에 관한 확대 생산자 책임(EPR) 규정에 의해 형성되고 있습니다. 독일, 프랑스, 스칸디나비아 국가에서는 짧은 공급망, 문서화된 인증 및 검증된 탄소 속성을 요구하는 산업 구매자들 수요가 이를 뒷받침하고 있습니다. UPM의 로이나 바이오리파이너리는 유럽의 컴파운더를 위한 지역적 공급 거점을 제공합니다. 남미는 여전히 주로 원료 산지이지만, 폴리머 컴파운딩 능력의 확장에 따라 국내 필러 수요가 확대될 것으로 예측됩니다. 중동 및 아프리카는 여전히 초기 단계에 있지만, 남아프리카의 자동차 부품 부문과 폐기물 바이오매스 활용에 대한 폭넓은 관심으로 인해 예측 기간 후반에는 수요가 뒷받침될 가능성이 있습니다. 바이오 기반 탄소 충전재 시장은 원료 공급, 탄소 크레딧 수요, 기술 기준 및 현지 가공 능력이 지역마다 다르기 때문에 이들 지역 간에 서로 다른 속도로 발전할 전망입니다.
기타 혜택 :
- 엑셀 형식 시장 예측(ME) 시트
- 3개월간의 애널리스트 지원
자주 묻는 질문
목차
제1장 서론
제2장 조사 방법
제3장 주요 요약
제4장 시장 구도
제5장 시장 규모 및 성장 예측
제6장 경쟁 구도
제7장 시장 기회 및 향후 전망
KTH 26.09.10According to Mordor Intelligence, the bio-Based carbon fillers market was valued at USD 0.54 billion in 2025 and is estimated to grow from USD 0.62 billion in 2026 to reach USD 1.18 billion by 2031, at a CAGR of 13.89% during the forecast period (2026-2031).
This report is Segmented by Product Type (Biochar, Bio-Based Carbon Black, and More), Feedstock (Wood Biomass, Agricultural Residues, Lignin and Pulp Residues, and More), Application (Polymer Compounds, Rubber Compounds and Tire Materials, and More), and Geography (Asia-Pacific, North America, Europe, South America, and Middle-East and Africa). The Market Forecasts are Provided in Terms of Value (USD).
Global Bio-Based Carbon Fillers Market Trends and Insights
Corporate Scope 3 and Product Carbon Footprint Requirements
Mandatory Scope 3 emissions disclosure has become an active factor in materials sourcing across several industries. Directive (EU) 2026/470 preserved Scope 3 greenhouse gas disclosure requirements for in-scope companies while reducing the total number of mandatory data points by 61%. Wave 1 companies that were previously subject to the Non-Financial Reporting Directive are reporting on 2026 data. California Senate Bill 253 requires Scope 3 reporting from 2027, which adds reporting pressure for large companies with activities in the state. Verified bio-based carbon fillers can reduce a buyer's Category 1 purchased goods and services inventory when the material replaces a higher-emission input. This shift makes certification under the European Biochar Certificate (EBC), the International Biochar Initiative, and ASTM D6866 a purchasing requirement rather than only a marketing claim.
Carbon Removal Offtake Demand for Durable Biochar Storage
Long-term carbon-removal agreements are securing biochar volumes that might otherwise be available to industrial filler buyers. In January 2025, Microsoft signed a 10-year agreement with Exomad Green for at least 1.24 million metric tons of carbon dioxide removal. In April 2026, Exomad Green and Supercritical signed a 3-year agreement for up to 500,000 metric tons of durable carbon removal, securing Exomad Green's entire 2026 inventory. The agreement reinforced competition between carbon-credit demand and filler-grade demand for certified biochar. It also provides producers with contracted revenue that can support new pyrolysis projects and feedstock development. Bio-based carbon fillers market participants with sufficient scale can serve both end uses and reduce their exposure to a single revenue stream.
Feedstock Variability and Contaminant-Control Burden
The broad range of usable biomass inputs improves supply options but creates differences in composition and contaminant profiles between batches. European Biochar Certificate Standard Version 10.5E limits plastic and rubber contamination to 1% by mass for agronomic-grade biochar. The limit can rise to 10% for EBC-Material applications with written approval from Carbon Standards International. The standard also requires pyrolysis at a minimum of 500 °C for at least 10 minutes to degrade organic micropollutants, including pharmaceuticals and mycotoxins. Heavy-metal content, including cadmium, lead, and arsenic, can vary with feedstock source and prior agricultural chemical use. International Biochar Initiative Version 2.0 protocols require retesting when feedstock composition changes beyond a 20% mixing-ratio change. These measures add operational complexity and can slow adoption in the bio-based carbon fillers market.
Other drivers and restraints analyzed in the detailed report include:
- Substitution of Fossil Carbon Black and Silica in Rubber and Plastics
- Waste Biomass Valorization and Integrated Energy Recovery
- Qualification Cycles Against Carbon Black Performance Specifications
For complete list of drivers and restraints, kindly check the Table Of Contents.
Segment Analysis
Biochar held 48.56% of the product type revenue in 2025, while bio-based carbon black is projected to advance at a 16.68% CAGR through 2031. Biochar's position reflected established operations that can use wood residues, agricultural byproducts, and mixed organic streams. Its broad feedstock base supported commercial-scale production before other specialized bio-based carbon grades reached wider use. Bio-based carbon black is gaining demand in packaging, coatings, and inks because it can serve as a pigment replacement. In December 2025, UPM launched Circular Renewable Black, a bio-based, near-infrared detectable, carbon-negative black pigment made from renewable lignin. The product was certified under International Sustainability and Carbon Certification Plus, Forest Stewardship Council, and Programme for the Endorsement of Forest Certification standards.
The bio-based carbon fillers market size for biochar retained an advantage because existing systems can make it from several biomass sources. Conventional carbon black can make black plastic packaging difficult for near-infrared sorting systems to detect at recycling facilities. UPM's material addresses this issue for packaging systems that need near-infrared sorting performance. Activated bio-carbon serves energy-storage electrodes and filtration media where high surface area and adsorption properties can support higher prices. Specialty graphitic bio-carbon remains at an early commercial stage for conductive polymers and specialty composites. Biochar surface area typically ranges from 50 to 300 m2/g, compared with 150 to 1,500 m2/g for furnace carbon black. This difference limits full substitution in high-performance rubber but allows partial replacement when activation and surface modification are used.
Complete Report Scope:
- By Product Type
- Biochar
- Bio-Based Carbon Black
- Activated Bio-Carbon
- Other Product Types (Graphitic Bio-Carbon, Specialty Bio-Based Carbon Fillers)
- By Feedstock
- Wood Biomass
- Agricultural Residues
- Lignin and Pulp Residues
- Other Feedstocks (Bamboo, Coconut Shells, Organic Waste, Other Biomass Feedstocks)
- By Application
- Polymer Compounds
- Rubber Compounds and Tire Materials
- Coatings and Inks
- Adhesives and Sealants
- Other Applications (Composites, Energy Storage, Filtration and Environmental Remediation)
- By Geography
- Asia-Pacific
- China
- India
- Japan
- South Korea
- Rest of Asia-Pacific
- North America
- United States
- Canada
- Mexico
- Europe
- Germany
- United Kingdom
- France
- Italy
- Rest of Europe
- South America
- Brazil
- Argentina
- Rest of South America
- Middle-East and Africa
- Saudi Arabia
- South Africa
- Rest of Middle-East and Africa
- Asia-Pacific
Geography Analysis
North America held 36.40% of the bio-based carbon fillers market share in 2025. The region combines industrial-scale pyrolysis infrastructure, corporate buyers that are responding to supply-chain emissions targets, and proximity to polymer and rubber compounders in the U.S. Midwest and Ontario. Carbonity in Port-Cartier, Quebec, began operations in May 2025 as Canada's first industrial-scale biochar plant and North America's largest. The plant began with 10,000 metric tons per year of capacity and targets 30,000 metric tons per year by the end of 2026. Its use of Forest Stewardship Council-certified woody residues gives the project a traceable feedstock model that can be replicated in forestry regions. California's Scope 3 reporting requirements from 2027 are expected to strengthen documented emissions-reduction purchasing across the region.
Asia-Pacific is projected to advance at a 16.11% CAGR through 2031. The region's tire and rubber manufacturing base gives even small levels of renewable filler substitution material demand potential. China and India are key regional sources of carbon black consumption for tire and industrial rubber production. In January 2026, Microsoft signed an agreement with Varaha to purchase more than 100,000 metric tons of carbon dioxide removal credits over 3 years through 2029. The agreement supports industrial pyrolysis scale-up in Maharashtra and improves production-finance certainty for biochar projects. Japan's Ministry of Economy, Trade, and Industry certification requirements for consumer-goods contact applications and South Korea's specialty polymer compounding base support demand for certified, low-polycyclic aromatic hydrocarbon filler grades.
Europe has a demand profile shaped by embodied-carbon reporting, restrictions on polycyclic aromatic hydrocarbons, and extended producer responsibility rules for packaging. Germany, France, and Scandinavia support demand from industrial buyers that seek short supply chains, documented certification, and verified carbon attributes. UPM's Leuna biorefinery provides a regional supply base for European compounders. South America remains primarily a feedstock origin, while domestic filler demand is expected to develop as polymer compounding capacity grows. The Middle-East and Africa remain at an early stage, although South Africa's automotive component sector and wider interest in waste-biomass use could support demand later in the forecast period. The bio-based carbon fillers market is likely to develop at different speeds across these regions because feedstock supply, carbon-credit demand, technical standards, and local processing capacity vary.
- Airex Energy Inc.
- ArSta Eco Private Limited
- Biocarbon Compounds
- Biochar Now
- Biochar Supreme, LLC
- BLACK DONUTS INC.
- Carbofex Oy
- Carboganic
- Carbon Gold Ltd
- CHAR Technologies Ltd.
- Made of Air
- Nature Coatings
- Novocarbo GmbH
- Origin Materials
- UPM
- Wakefield BioChar
Additional Benefits:
- The market estimate (ME) sheet in Excel format
- 3 months of analyst support
TABLE OF CONTENTS
1 Introduction
- 1.1 Study Assumptions and Market Definition
- 1.2 Scope of the Study
2 Research Methodology
3 Executive Summary
4 Market Landscape
- 4.1 Market Overview
- 4.2 Market Drivers
- 4.2.1 Corporate Scope 3 and Product Carbon Footprint Requirements
- 4.2.2 Carbon Removal Offtake Demand for Durable Biochar Storage
- 4.2.3 Substitution of Fossil Carbon Black and Silica in Rubber and Plastics
- 4.2.4 Waste Biomass Valorization and Integrated Energy Recovery
- 4.2.5 Engineered Particle and Surface Properties for Drop-In Processing
- 4.2.6 Biochar-Enabled Lightweighting and Functional Performance
- 4.3 Market Restraints
- 4.3.1 Feedstock Variability and Contaminant-Control Burden
- 4.3.2 Qualification Cycles Against Carbon Black Performance Specifications
- 4.3.3 Limited Industrial-Scale Supply and Batch-to-Batch Consistency
- 4.3.4 Certification Fragmentation and Unclear End-Use Claims
- 4.4 Value Chain Analysis
- 4.5 Porter's Five Forces Analysis
- 4.5.1 Threat of New Entrants
- 4.5.2 Bargaining Power of Suppliers
- 4.5.3 Bargaining Power of Buyers
- 4.5.4 Threat of Substitutes
- 4.5.5 Competitive Rivalry
5 Market Size and Growth Forecasts (Value)
- 5.1 By Product Type
- 5.1.1 Biochar
- 5.1.2 Bio-Based Carbon Black
- 5.1.3 Activated Bio-Carbon
- 5.1.4 Other Product Types (Graphitic Bio-Carbon, Specialty Bio-Based Carbon Fillers)
- 5.2 By Feedstock
- 5.2.1 Wood Biomass
- 5.2.2 Agricultural Residues
- 5.2.3 Lignin and Pulp Residues
- 5.2.4 Other Feedstocks (Bamboo, Coconut Shells, Organic Waste, Other Biomass Feedstocks)
- 5.3 By Application
- 5.3.1 Polymer Compounds
- 5.3.2 Rubber Compounds and Tire Materials
- 5.3.3 Coatings and Inks
- 5.3.4 Adhesives and Sealants
- 5.3.5 Other Applications (Composites, Energy Storage, Filtration and Environmental Remediation)
- 5.4 By Geography
- 5.4.1 Asia-Pacific
- 5.4.1.1 China
- 5.4.1.2 India
- 5.4.1.3 Japan
- 5.4.1.4 South Korea
- 5.4.1.5 Rest of Asia-Pacific
- 5.4.2 North America
- 5.4.2.1 United States
- 5.4.2.2 Canada
- 5.4.2.3 Mexico
- 5.4.3 Europe
- 5.4.3.1 Germany
- 5.4.3.2 United Kingdom
- 5.4.3.3 France
- 5.4.3.4 Italy
- 5.4.3.5 Rest of Europe
- 5.4.4 South America
- 5.4.4.1 Brazil
- 5.4.4.2 Argentina
- 5.4.4.3 Rest of South America
- 5.4.5 Middle-East and Africa
- 5.4.5.1 Saudi Arabia
- 5.4.5.2 South Africa
- 5.4.5.3 Rest of Middle-East and Africa
- 5.4.1 Asia-Pacific
6 Competitive Landscape
- 6.1 Market Concentration
- 6.2 Strategic Moves
- 6.3 Market Share (%)/Ranking Analysis
- 6.4 Company Profiles (includes Global Overview, Market Overview, Core Segments, Financials as available, Strategic Information, Products and Services, and Recent Developments)
- 6.4.1 Airex Energy Inc.
- 6.4.2 ArSta Eco Private Limited
- 6.4.3 Biocarbon Compounds
- 6.4.4 Biochar Now
- 6.4.5 Biochar Supreme, LLC
- 6.4.6 BLACK DONUTS INC.
- 6.4.7 Carbofex Oy
- 6.4.8 Carboganic
- 6.4.9 Carbon Gold Ltd
- 6.4.10 CHAR Technologies Ltd.
- 6.4.11 Made of Air
- 6.4.12 Nature Coatings
- 6.4.13 Novocarbo GmbH
- 6.4.14 Origin Materials
- 6.4.15 UPM
- 6.4.16 Wakefield BioChar
7 Market Opportunities and Future Outlook
- 7.1 White-Space and Unmet-Need Assessment


