|
시장보고서
상품코드
2119593
런던 데이터센터 : 시장 점유율 분석, 업계 동향과 통계, 성장 예측(2026-2031년)London Data Center - Market Share Analysis, Industry Trends & Statistics, Growth Forecasts (2026 - 2031) |
||||||
 Mordor Intelligence
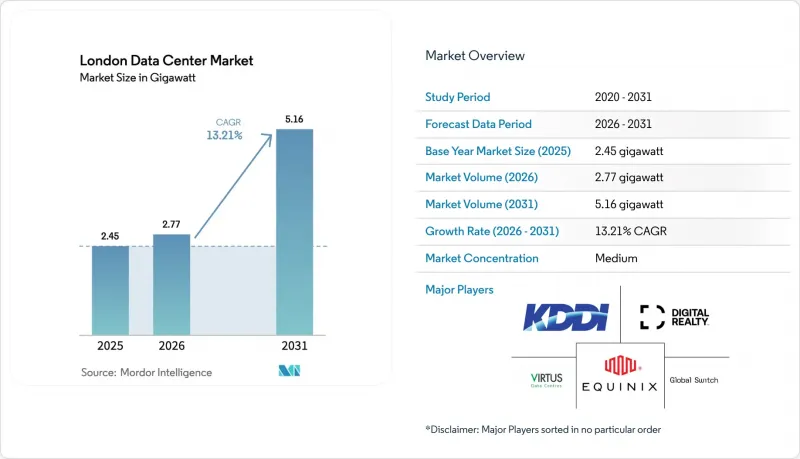
Mordor Intelligence에 따르면 2026년 런던 데이터센터 시장의 규모는 2.77 GW와 추정되고 있으며, 2025년 2.45GW로부터 확대하며, 2031년에는 5.16GW에 달할 것으로 예측됩니다.
2026-2031년에 연평균 성장률(CAGR) 13.21%로 성장할 것으로 전망됩니다.
이 보고서는 데이터센터 규모(소규모, 중규모, 대규모, 초대규모, 메가 규모), 티어 유형(Tier 1·2, Tier 3, Tier 4) 및 데이터센터 유형(클라우드 서비스 제공업체(CSP), 코로케이션 등)별로 분류되어 있습니다. 시장 전망은 금액(달러)으로 표시되어 있습니다.
런던 데이터센터 시장의 동향 및 인사이트
하이퍼스케일러의 클라우드 확장이 시장 성장을 주도
각 하이퍼스케일러 기업은 계속해서 런던 데이터센터 시장을 주도하고 있으며, AI 대응을 위한 신규 건설 및 개보수 프로그램에 수십억 파운드 규모의 예산을 투자하고 있습니다. 2025년 1월, 영국 정부는 AI 인프라를 목적으로 한 140억 파운드 규모의 데이터센터 프로젝트를 발표하며, 새로운 용량을 지정된 AI 성장 구역으로 배정할 방침을 밝혔습니다. CoreWeave의 10억 파운드 규모 진출은 GPU 가속 환경을 지원하는 풍부한 자본력을 입증하는 것입니다. 전력 공급 상한선으로 인해 신규 신청이 억제되는 가운데, 슬라우(Slough) 지역의 기존 지배력은 점차 약화되고 있습니다. Ada Infrastructure사의 210MW 규모 로열 독스(Royal Docks) 캠퍼스는 이러한 동부 지역으로의 재편을 여실히 보여주고 있습니다. 개발업자들이 더 신속한 인가를 얻기 위해, 지역 기여 방안-부지내 기술 아카데미, 공공 녹지, 지역 열 공급 시스템과의 연계-가 표준화되고 있습니다.
AI 주도 연산 밀도가 시설 설계를 혁신
40-140kW 랙의 등장으로 런던 데이터센터 시장 전체의 설계 기준이 새롭게 정립되었습니다. 2025년 3월 Kao Data가 Nvidia H200 GPU를 도입한 사례는 폐쇄형 루프 방식의 후면 도어 열교환기와 100% 재생 가능 에너지 공급을 통합함으로써 운영 측면에서 비약적인 진보를 입증했습니다. AI 서버 1대당 전력 소비량은 기존 워크로드의 4-5배에 달하고 있으며, 전력, 공간, 냉각 지표를 융합한 새로운 수익 모델의 구축이 시급합니다. 알고리즘 트레이딩나 리스크 시뮬레이션에서 GPU 클러스터를 많이 사용하는 금융 서비스 테넌트는 시티 근교에서 지연 시간에 민감한 컴퓨팅 환경을 확보하기 위해 더 높은 코로케이션 요금을 수용하고 있습니다. 시설 설계도에서는 슬래브 간 여유 높이 6m 이상, 132kV 이중 전원 공급, 그리고 장시간의 다운타임 없이 공기 냉각에서 액체 냉각으로 전환 가능한 모듈식 냉각 블록의 채택이 점점 더 늘어나고 있습니다.
송전망의 전력 배분이 개발의 중대한 병목 현상으로
서부 런던에서는 처리되지 않은 송전망 연결 신청이 400GW를 초과함에 따라 신규 연결이 일시 중단되었으며, 개발업자들은 변전소 업그레이드 비용을 부담하거나 프로젝트를 런던 동부로 이전할 수밖에 없는 상황에 처해 있습니다. 전력 공급 능력을 이유로 일부 제안이 즉시 기각됨에 따라 사업자들은 하이브리드형 현장 발전이나 배터리 솔루션으로의 전환을 강요받고 있습니다. 연결 대기 리스트 개혁과 템즈강에서 선박을 통한 전력망 공급 시범 사업에 대한 정부의 검토로 단기적인 완화 효과가 기대되지만, 전력 공급이 제한된 자치구에서 100MW 이상의 블록을 계획 중인 프로젝트의 경우 여전히 위험이 남아 있습니다.
부문 분석
2025년에는 10MW에서 20MW 규모의 대규모 사이트가 용량의 최상위를 차지하며 런던 데이터센터 시장에 44.95%를 기여했습니다. 이러한 우위는 건설 비용과 주요 광섬유 경로와의 근접성 사이에서 균형을 잘 잡은 최적의 범위에 위치했음을 반영합니다. 그러나 성장 동력은 40MW를 초과하는 메가 캠퍼스로 이동하고 있으며, 2026-2031년까지 연평균 성장률(CAGR) 27.60%로 급성장할 것으로 예측됩니다. Ada Infrastructure사의 210MW 규모 로열 독스(Royal Docks) 프로젝트가 그 청사진을 보여줍니다. 이 프로젝트는 수랭식 GPU 클러스터용으로 구성된 3개의 70MW 홀로 이루어져 있으며, 지역 냉방 시스템과의 연동으로 보완됩니다. 이러한 프로젝트는 전력 조달 및 부지내 변전소 구축에 있으며, 규모의 경제를 활용하여, 사업자가 배전망 사업자와의 요금 협상에서 유리한 고지를 점할 수 있도록 합니다. 5MW 미만의 소규모 시설은 IoT 및 핀테크 애플리케이션의 지연을 줄이는 에지 노드로 재활용되어, 런던 데이터센터 시장의 발자취를 교외의 교환국이나 지하 광섬유 저장소까지 확대하고 있습니다.
이러한 성장 궤적은 업계의 통합 압력을 더욱 강화하고 있습니다. 메가 캠퍼스 투자자들은 여러 데이터 홀을 단일 계획 틀로 통합함으로써 1MW당 설비 투자를 절감하고 수익화까지의 기간을 단축하고 있습니다. 기업은 예측 가능한 확장 경로와 탄탄한 상호 연결 기반을 찾아 이러한 대규모 시설로 몰려들고 있습니다. 한편, 중규모 자산은 높아지는 랙 밀도에 대응하기 위해 설비 투자를 통한 업그레이드를 서둘러야 하는 상황에 처해 있습니다. 30kW 랙으로 개조할 수 없는 사업자는 AI 워크로드가 자사를 우회함에 따라 가동률이 하락하여, 합병이나 자산 매각을 피할 수 없게 될 가능성이 있습니다. 런던 데이터센터 시장에서 메가 시설 시장 규모는 2배로 증가할 것으로 예상되며, 10년 말까지 총 수익에서 차지하는 비중이 3분의 1을 넘어설 전망입니다.
기타 혜택:
- 엑셀 형식의 시장 예측(ME) 시트
- 3개월간의 애널리스트 지원
자주 묻는 질문
목차
제1장 서론
제2장 조사 방법
제3장 개요
제4장 시장 구도
제5장 시장 규모와 성장 예측(MW)
제6장 경쟁 구도
제7장 시장 기회와 향후 전망
KSA 26.09.02According to Mordor Intelligence, london data center market size in 2026 is estimated at 2.77 GW, growing from 2025 value of 2.45 GW with 2031 projections showing 5.16 GW, growing at 13.21% CAGR over 2026-2031.
This report is Segmented by Data Center Size (Small, Medium, Large, Massive, Mega), Tier Type (Tier 1&2, Tier 3, Tier 4), and Data Center Type (Cloud Service Providers (CSPs), Colocation Type, and More). The Market Forecasts are Provided in Terms of Value (USD).
London Data Center Market Trends and Insights
Hyperscaler Cloud Expansion Driving Market Growth
Hyperscalers continue to underwrite the London data center market, committing multi-billion-pound budgets to AI-ready builds and retrofit programs. January 2025 saw a UK government announcement of GBP 14 billion in data-center projects aimed at AI infrastructure, redirecting new capacity toward designated AI Growth Zones. CoreWeave's GBP 1 billion entry underscores the capital depth backing GPU-accelerated environments. Slough's historic dominance is waning as power caps squeeze new requests; Ada Infrastructure's 210 MW Royal Docks campus illustrates the eastward realignment. Community benefit packages-on-site skills academies, public green space, and district-heating interfaces-have become standard as developers secure faster approvals.
AI-Driven Compute Density Transforming Facility Design
The arrival of 40-140 kW racks has reset design norms across the London data center market. Kao Data's deployment of Nvidia H200 GPUs in March 2025 demonstrated the operational leap, integrating closed-loop rear-door heat exchangers and 100% renewable energy feeds. Power draw per AI server now runs 4-5 times that of legacy workloads, forcing new revenue models that blend power, space, and cooling metrics. Financial-services tenants-whose algorithmic trading and risk simulations thrive on GPU clusters-accept higher colocation rates in exchange for latency-sensitive compute near the City. Facility blueprints increasingly adopt slab-to-slab clear heights above 6 m, dual 132 kV feeds, and modular cooling blocks that can swing from air-to-liquid without extended downtime.
Grid-Power Allocation Creating Critical Development Bottleneck
Pending grid requests topping 400 GW in West London have triggered a pause on new connections, compelling developers to fund sub-station upgrades or migrate projects east of the city. Some proposals have been rejected outright on power-availability grounds, pushing operators toward hybrid on-site generation and battery solutions. Government deliberations on connection-queue reform and vessel-to-grid pilots on the Thames hint at near-term relief, yet risk persists for schemes banking on 100 MW-plus blocks in constrained boroughs.
Other drivers and restraints analyzed in the detailed report include:
- Sub-sea Cable Ecosystem Enhancing London's Connectivity Value
- Renewable Energy PPAs Becoming Operational Imperative
- High Land Costs and Planning Complexities Impeding Growth
For complete list of drivers and restraints, kindly check the Table Of Contents.
Segment Analysis
Large sites between 10 MW and 20 MW led capacity in 2025, contributing 44.95% to the London data center market. The dominance reflected their sweet spot in balancing build costs and proximity to key fiber routes. Momentum is shifting, however, toward Mega campuses exceeding 40 MW, projected to gallop ahead at a 27.60% CAGR between 2026 and 2031. Ada Infrastructure's 210 MW Royal Docks project illustrates the blueprint: three 70 MW halls configured for liquid-cooled GPU clusters and supplemented by district-cooling tie-ins. Such projects exploit economies of scale in power procurement and on-site sub-station build-outs, giving operators tariff leverage with distribution network operators. Smaller facilities under 5 MW are repurposed into edge nodes that trim latency for IoT and fintech applications, extending the London data center market footprint into suburban exchange buildings and underground fiber vaults.
The growth trajectory reinforces consolidation pressures. Mega campus investors bundle multiple data halls into a single planning envelope, reducing per-MW capital expenditure and shortening time-to-revenue. Enterprises gravitate toward these scale facilities for predictable expansion paths and richer interconnection fabrics. Conversely, medium-sized assets now face capex upgrades to chase rising rack densities. Operators unable to retrofit to 30 kW racks may see occupancy taper as AI workloads bypass them, driving mergers or asset sales. The London data center market size for Mega facilities is forecast to double, lifting their revenue contribution above one-third of the total by decade's end.
Complete Report Scope:
- By Data Center Size
- Small
- Medium
- Large
- Massive
- Mega
- By Tier Type
- Tier 1 and 2
- Tier 3
- Tier 4
- By Data Center Type
- Hyperscalers/Cloud Service Providers
- Enterprise and Edge
- Colocation
- Utilized
- Colocation Type
- Retail
- Wholesale
- Hyperscale
- End User
- Cloud and IT
- Telecom
- Media and Entertainment
- Government
- BFSI
- Manufacturing
- E-Commerce
- Other End User
- Colocation Type
- Utilized
- Non-Utilized
List of Companies Covered in this Report:
- Colt Technology Services Group Limited
- Digital Realty Trust, Inc.
- Equinix, Inc.
- NTT Ltd
- Kao Data Ltd
- Telehouse (KDDI Corp.)
- VIRTUS Data Centres (STT GDC)
- 4D Data Centres (Redcentric plc)
- Pulsant Ltd
- Iron Mountain Inc.
- Cyxtera Technologies, Inc.
- Rackspace Technology Inc.
- Vantage Data Centers
- Serverfarm LLC
- CyrusOne Inc.
- Global Switch
- Ark Data Centres
- Yondr Group
- STACK Infrastructure
- Echelon Data Centres
Additional Benefits:
- The market estimate (ME) sheet in Excel format
- 3 months of analyst support
TABLE OF CONTENTS
1 INTRODUCTION
- 1.1 Study Assumptions and Market Definition
- 1.2 Scope of the Study
2 RESEARCH METHODOLOGY
3 EXECUTIVE SUMMARY
4 MARKET LANDSCAPE
- 4.1 Market Overview
- 4.2 Market Drivers
- 4.2.1 Hyperscaler cloud expansion demand
- 4.2.2 AI / GPU-driven high-density compute requirements
- 4.2.3 Sub-sea cable and metro-fiber ecosystem depth
- 4.2.4 Renewable-energy PPAs and net-zero mandates
- 4.2.5 London Underground fiber right-of-way for edge DCs
- 4.2.6 Thames River district-cooling schemes
- 4.3 Market Restraints
- 4.3.1 Grid-power allocation shortages in West London
- 4.3.2 High land and business-rate costs + planning delays
- 4.3.3 Waste-heat reuse obligations tightening CAPEX
- 4.3.4 HV commissioning-engineer scarcity (Crossrail-2 pull)
- 4.4 Value / Supply-Chain Analysis
- 4.5 Regulatory Landscape
- 4.6 Technological Outlook (Liquid cooling, SMRs, fuel-cells)
- 4.7 Connectivity and Data-Consumption Trends
- 4.8 IT Load Capacity Analysis
- 4.9 Raised Floor Space Analysis
- 4.10 Rack Density and Number-of-Racks Analysis
- 4.11 Porter's Five Forces
- 4.11.1 Threat of New Entrants
- 4.11.2 Bargaining Power of Suppliers
- 4.11.3 Bargaining Power of Buyers
- 4.11.4 Threat of Substitutes
- 4.11.5 Industry Rivalry
5 MARKET SIZE AND GROWTH FORECASTS (MW)
- 5.1 By Data Center Size
- 5.1.1 Small
- 5.1.2 Medium
- 5.1.3 Large
- 5.1.4 Massive
- 5.1.5 Mega
- 5.2 By Tier Type
- 5.2.1 Tier 1 and 2
- 5.2.2 Tier 3
- 5.2.3 Tier 4
- 5.3 By Data Center Type
- 5.3.1 Hyperscalers/Cloud Service Providers
- 5.3.2 Enterprise and Edge
- 5.3.3 Colocation
- 5.3.3.1 Utilized
- 5.3.3.1.1 Colocation Type
- 5.3.3.1.1.1 Retail
- 5.3.3.1.1.2 Wholesale
- 5.3.3.1.1.3 Hyperscale
- 5.3.3.1.2 End User
- 5.3.3.1.2.1 Cloud and IT
- 5.3.3.1.2.2 Telecom
- 5.3.3.1.2.3 Media and Entertainment
- 5.3.3.1.2.4 Government
- 5.3.3.1.2.5 BFSI
- 5.3.3.1.2.6 Manufacturing
- 5.3.3.1.2.7 E-Commerce
- 5.3.3.1.2.8 Other End User
- 5.3.3.1.1 Colocation Type
- 5.3.3.1 Utilized
- 5.3.4 Non-Utilized
6 COMPETITIVE LANDSCAPE
- 6.1 Market Concentration
- 6.2 Strategic Moves
- 6.3 Company Profiles (includes Global level Overview, Market level overview, Core Segments, Financials as available, Strategic Information, Market Rank/Share for key companies, Products and Services, and Recent Developments)
- 6.3.1 Colt Technology Services Group Limited
- 6.3.2 Digital Realty Trust, Inc.
- 6.3.3 Equinix, Inc.
- 6.3.4 NTT Ltd
- 6.3.5 Kao Data Ltd
- 6.3.6 Telehouse (KDDI Corp.)
- 6.3.7 VIRTUS Data Centres (STT GDC)
- 6.3.8 4D Data Centres (Redcentric plc)
- 6.3.9 Pulsant Ltd
- 6.3.10 Iron Mountain Inc.
- 6.3.11 Cyxtera Technologies, Inc.
- 6.3.12 Rackspace Technology Inc.
- 6.3.13 Vantage Data Centers
- 6.3.14 Serverfarm LLC
- 6.3.15 CyrusOne Inc.
- 6.3.16 Global Switch
- 6.3.17 Ark Data Centres
- 6.3.18 Yondr Group
- 6.3.19 STACK Infrastructure
- 6.3.20 Echelon Data Centres
- 6.4 Market Share Analysis
7 MARKET OPPORTUNITIES AND FUTURE OUTLOOK
- 7.1 White-space and Unmet-Need Assessment