|
시장보고서
상품코드
2119595
피닉스 데이터센터 : 시장 점유율 분석, 업계 동향과 통계, 성장 예측(2026-2031년)Phoenix Data Center - Market Share Analysis, Industry Trends & Statistics, Growth Forecasts (2026 - 2031) |
||||||
 Mordor Intelligence
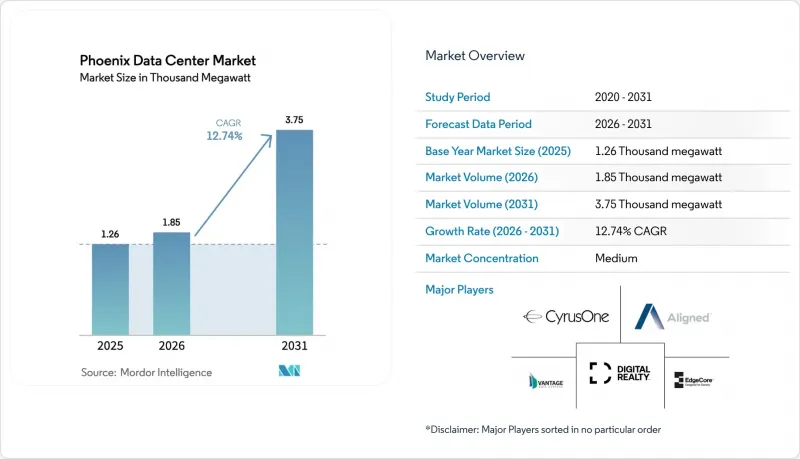
Mordor Intelligence에 따르면 2026년 피닉스 데이터센터 시장 규모는 1.85기가와트로 추정되고 있으며, 2025년 1.25기가와트로부터 확대하며, 2031년에는 3.75기가와트에 달할 것으로 예측됩니다.
2026-2031년까지 연평균 성장률(CAGR) 12.74%로 성장할 것으로 전망됩니다.
이 보고서는 데이터센터 규모(소규모, 중규모, 대규모, 초대규모, 메가 규모), 티어 유형(Tier 1·2, Tier 3, Tier 4), 데이터센터 유형(코로케이션, 클라우드 서비스 제공업체(CSP), 기업, 모듈러, 엣지)별로 분류되어 있습니다. 시장 전망은 금액(달러) 기준으로 제시되어 있습니다.
피닉스 데이터센터 시장의 동향 및 인사이트
급증하는 하이퍼스케일 및 AI 주도 수요
AI 훈련 클러스터에는 캠퍼스당 최대 1,000MW의 전력이 필요하며, 이는 기존 도입 사례의 10배에 해당합니다. 이에 따라 피닉스 대도시권 전역에서 부지 및 전력 확보가 급속히 진행되고 있습니다. 마이크로소프트의 굿이어 시설은 대량의 물을 사용하는 증발 냉각 방식을 채택하여 설계된 반면, 블랙스톤이 250억 달러를 투자한 시설은 60개 이상의 미식축구장 면적에 달하는 바닥 면적을 차지하고 있습니다. 2025년 이후, TSMC의 현지 반도체 생산은 GPU 공급망을 단축하고, 칩이 지역 AI 워크로드를 지원하며, 추가적인 용량 확장을 촉진하는 선순환 구조를 강화하고 있습니다.
경쟁력 있는 전력 가격과 재생에너지 PPA
애리조나주의 평균 전기 요금은 캘리포니아주보다 20% 저렴하며, 전력 회사의 병목 현상을 피하는 혁신적인 전력 구매 계약(PPA)을 통해 더욱 낮아지고 있습니다. 솔트 리버 프로젝트(SRP)는 260MW 규모의 태양광발전 및 에너지 저장 복합 시설로 구글의 메사 캠퍼스를 지원하고 있으며, 메타의 200MW 브리틀부시 태양광발전소는 전용 청정 전력을 공급하고 있습니다. 미국 청정 전력 협회(ACPA)에 따르면 주 전체에서 완료 및 확정된 청정 에너지 투자액은 130억 달러에 달합니다.
전력 회사의 계통 연계 대기 병목 현상
APS는 2024년에 고작 7기가와트만 공급할 수 있었던 기존 송전망에 대해 13기가와트가 넘는 계통 연계 신청 심사를 이미 진행 중이며, 승인까지의 기간이 최장 3년에 달합니다. 이러한 대기 문제를 해결하기 위해 Aligned Data Centers는 계통 독립 운전이 가능한 63메가와트 규모의 디젤 마이크로그리드를 도입했으며, Vantage는 VoltaGrid와 제휴하여 1기가와트의 현장 발전 용량을 확보했습니다.
부문 분석
2025년, 피닉스시의 데이터센터 시장 점유율 중 대규모 캠퍼스가 42.19%를 차지하며, 2031년까지 연평균 성장률(CAGR) 15.86%라는 가장 높은 성장 궤도를 보였습니다. 따라서 피닉스시의 대규모 데이터센터 시장 규모는 향후 10년 말까지 2.2GW를 크게 상회할 것으로 전망됩니다. 각 사업자들은 캐비닛당 40kW 이상의 전력을 소비하는 AI 랙에 적합한 지속적인 전력 공급과 효율적인 액체 냉각 루프를 실현하기 위해 광대한 부지를 확보하고 있습니다. QTS는 웨스트밸리에서 400에이커가 넘는 750MW 규모의 캠퍼스 건설을 추진 중이며, 한편 Tract는 30개 동으로 구성된 140억 달러 규모의 1,000에이커 부지에 대한 마스터플랜을 수립 중입니다.
지역 기업을 위한 50MW 미만의 홀에 대한 2차 수요는 여전히 존재하지만, 확장 계획에서는 하이퍼스케일이 주류를 이루고 있습니다. Vantage-VoltaGrid사의 1GW 프로그램에서 볼 수 있듯이, 메가 캠퍼스에는 일반적으로 전용 변전소, 태양광발전 어레이, 가스 연소 마이크로그리드가 추가됩니다. TSMC 팹에 인접한 엣지 스케일 룸은 저지연 분석 및 로봇 제어를 호스팅함으로써 광범위한 시설을 보완합니다.
기타 혜택:
- 엑셀 형식의 시장 예측(ME) 시트
- 3개월간의 애널리스트 지원
자주 묻는 질문
목차
제1장 서론
제2장 조사 방법
제3장 개요
제4장 시장 구도
제5장 시장 규모와 성장 예측(MW)
제6장 경쟁 구도
제7장 시장 기회와 향후 전망
KSA 26.09.02According to Mordor Intelligence, phoenix data center market size in 2026 is estimated at 1.85gigawatt, growing from 2025 value of 1.25 gigawatt with 2031 projections showing 3.75 gigawatt, growing at 12.74% CAGR over 2026-2031.
This report is Segmented by Data Center Size (Small, Medium, Large, Massive, Mega), Tier Type (Tier 1&2, Tier 3, Tier 4), Data Center Type(Colocation, Cloud Service Providers (CSPs), Enterprise, Modular, and Edge). The Market Forecasts are Provided in Terms of Value (USD).
Phoenix Data Center Market Trends and Insights
Surging hyperscale and AI-driven demand
AI training clusters require up to 1,000 MW per campus-tenfold traditional deployments-prompting rapid land and power acquisitions across greater Phoenix. Microsoft's Goodyear estate is engineered for high water-usage evaporative cooling, while Blackstone's USD 25 billion outlay covers more than 60 football fields of floor area. Local semiconductor output by TSMC from 2025 shortens supply chains for GPUs, reinforcing a loop in which chips feed local AI workloads and spur even more capacity additions.
Competitive power prices and renewable PPAs
Arizona's average electricity tariff is 20% below California and is falling further through innovative power-purchase agreements (PPAs) that bypass utility bottlenecks. Salt River Project (SRP) supports Google's Mesa campus with a 260 MW solar-plus-storage farm, while Meta's 200 MW Brittlebush Solar Park delivers dedicated green power. The American Clean Power Association values completed and committed clean-energy investments across the state at USD 13 billion.
Utility power-queue bottlenecks
APS is already evaluating interconnection requests that exceed 13 GW against an existing grid that served just 7 GW in 2024, stretching approval cycles to as long as three years. To sidestep the queue, Aligned Data Centers adopted a 63 MW diesel microgrid capable of grid-island operation, while Vantage paired with VoltaGrid to secure 1 GW of on-site generation capacity.
Other drivers and restraints analyzed in the detailed report include:
- Ten-year sales-tax waiver on IT equipment
- Semiconductor fabs' edge-compute spill-over
- Water-consumption scrutiny in a desert climate
For complete list of drivers and restraints, kindly check the Table Of Contents.
Segment Analysis
Large campuses accounted for 42.19% of Phoenix data center market share in 2025 and captured the highest growth trajectory at 15.86% CAGR to 2031. The Phoenix data center market size for large builds is therefore set to rise well above 2.2 GW by the end of the decade. Operators deploy massive footprints to deliver contiguous power and efficient liquid-cooling loops that suit AI racks drawing 40 kW or more per cabinet. QTS is progressing on a 750 MW campus over 400 acres in the West Valley, while Tract is master-planning a USD 14 billion, 1,000-acre estate comprising 30 buildings.
Second-tier demand persists for sub-50 MW halls serving regional enterprises, yet hyperscale roadmaps dominate expansions. Mega campuses typically add dedicated substations, solar arrays, and gas-fired microgrids, as seen in Vantage-VoltaGrid's 1 GW program. Edge-scale rooms closer to TSMC fabs complement the wider footprint by hosting low-latency analytics and robotics control.
Complete Report Scope:
- By Data Center Size
- Small
- Medium
- Large
- Hyperscale
- By Tier Type
- Tier 1 and 2
- Tier 3
- Tier 4
- By Data Center Type
- Cloud Service Providers (CSPs)
- Enterprise, Modular and Edge
- Colocation
- Non-Utilized
- Utilized
- Colocation Type
- Retail
- Wholesale
- End User
- Cloud and IT
- Telecom
- Media and Entertainment
- Government
- BFSI
- Manufacturing
- E-Commerce
- Other End User
- Colocation Type
List of Companies Covered in this Report:
- EdgeCore Digital Infrastructure
- STACK INFRASTRUCTURE
- Aligned Data Centers
- VPS House Technology Group LLC ("VPS House")
- Iron Mountain Information Management, LLC
- QTS Realty Trust, LLC
- Krypt
- EvoSwitch B.V. (Iron Mountain Information Management, LLC)
- Stream Data Centers
- Vantage Data Centers Management Company, LLC
- DigitalBridge Group, Inc.
- EDC VENTURE LLC (Edged)
- 5C AI Group Inc.
- Digital Realty Trust Inc.
- Lumen Technologies
- CyrusOne LLC
- HonorHealth
- phoenixNAP LLC
- Zayo Group Holdings, Inc.
- Expedient (Continental Broadband, LLC)
- Flexential Corp.
- Enzu Inc.
Additional Benefits:
- The market estimate (ME) sheet in Excel format
- 3 months of analyst support
TABLE OF CONTENTS
1 INTRODUCTION
- 1.1 Study Assumptions and Market Definition
- 1.2 Scope of the Study
2 RESEARCH METHODOLOGY
3 EXECUTIVE SUMMARY
4 MARKET LANDSCAPE
- 4.1 Market Overview
- 4.2 Market Drivers
- 4.2.1 Surging hyperscale and AI-driven demand
- 4.2.2 Competitive power prices and renewable PPAs
- 4.2.3 Ten-year sales-tax waiver on IT equipment
- 4.2.4 Semiconductor fabs' edge-compute spill-over
- 4.2.5 Migration from CA seismic and water-restricted sites
- 4.2.6 On-site microgrid deployment for rapid energization
- 4.3 Market Restraints
- 4.3.1 Utility power-queue bottlenecks
- 4.3.2 Water-consumption scrutiny in desert climate
- 4.3.3 Municipal push-back over heat-island rezoning
- 4.3.4 Transformer supply-chain delays for liquid-cooling
- 4.4 Value / Supply-Chain Analysis
- 4.5 Regulatory Landscape
- 4.6 Technological Outlook
- 4.7 Porter's Five Forces Analysis
- 4.7.1 Competitive Rivalry
- 4.7.2 Threat of New Entrants
- 4.7.3 Bargaining Power of Suppliers
- 4.7.4 Bargaining Power of Buyers
- 4.7.5 Threat of Substitutes
- 4.8 Assessment of Macro Economic Trends on the Market
5 MARKET SIZE AND GROWTH FORECASTS (MW)
- 5.1 By Data Center Size
- 5.1.1 Small
- 5.1.2 Medium
- 5.1.3 Large
- 5.1.4 Hyperscale
- 5.2 By Tier Type
- 5.2.1 Tier 1 and 2
- 5.2.2 Tier 3
- 5.2.3 Tier 4
- 5.3 By Data Center Type
- 5.3.1 Cloud Service Providers (CSPs)
- 5.3.2 Enterprise, Modular and Edge
- 5.3.3 Colocation
- 5.3.3.1 Non-Utilized
- 5.3.3.2 Utilized
- 5.3.3.2.1 Colocation Type
- 5.3.3.2.1.1 Retail
- 5.3.3.2.1.2 Wholesale
- 5.3.3.2.2 End User
- 5.3.3.2.2.1 Cloud and IT
- 5.3.3.2.2.2 Telecom
- 5.3.3.2.2.3 Media and Entertainment
- 5.3.3.2.2.4 Government
- 5.3.3.2.2.5 BFSI
- 5.3.3.2.2.6 Manufacturing
- 5.3.3.2.2.7 E-Commerce
- 5.3.3.2.2.8 Other End User
- 5.3.3.2.1 Colocation Type
6 COMPETITIVE LANDSCAPE
- 6.1 Market Concentration
- 6.2 Strategic Moves
- 6.3 Market Share Analysis
- 6.4 Company Profiles (includes Global level Overview, Market level overview, Core Segments, Financials as available, Strategic Information, Market Rank/Share for key companies, Products and Services, and Recent Developments)
- 6.4.1 EdgeCore Digital Infrastructure
- 6.4.2 STACK INFRASTRUCTURE
- 6.4.3 Aligned Data Centers
- 6.4.4 VPS House Technology Group LLC ("VPS House")
- 6.4.5 Iron Mountain Information Management, LLC
- 6.4.6 QTS Realty Trust, LLC
- 6.4.7 Krypt
- 6.4.8 EvoSwitch B.V. (Iron Mountain Information Management, LLC)
- 6.4.9 Stream Data Centers
- 6.4.10 Vantage Data Centers Management Company, LLC
- 6.4.11 DigitalBridge Group, Inc.
- 6.4.12 EDC VENTURE LLC (Edged)
- 6.4.13 5C AI Group Inc.
- 6.4.14 Digital Realty Trust Inc.
- 6.4.15 Lumen Technologies
- 6.4.16 CyrusOne LLC
- 6.4.17 HonorHealth
- 6.4.18 phoenixNAP LLC
- 6.4.19 Zayo Group Holdings, Inc.
- 6.4.20 Expedient (Continental Broadband, LLC)
- 6.4.21 Flexential Corp.
- 6.4.22 Enzu Inc.
7 MARKET OPPORTUNITIES AND FUTURE OUTLOOK
- 7.1 White-space and Unmet-need Assessment